
Facilities inventory development
We integrated multiple national datasets to compile an inventory of wastewater treatment facilities in the USA, their energy requirements and GHG emissions (Fig. 6). Our inventory consists of 15,863 WWTPs that reported non-zero flow to the US EPA in 202215. Throughout this Article, WWTPs refer to facilities owned and/or operated by municipalities or other public entities, including treatment plants and lagoons. We determined the treatment train for each facility in our inventory, defined as a common set of unit operations designed to reduce wastewater pollution between the influent and effluent of the plant. We used unit processes reported across the aggregated 2004, 2008, 2012 and 2022 CWNS12,13,14,15, supplemented with additional publicly available data that provided more granular or recent information: the US EPA’s Lagoon Inventory Dataset36, the Water Environment Federation’s Water Resource Recovery Facilities Biogas Database37 and the US Department of Energy’s Combined Heat and Power Installation Database38.
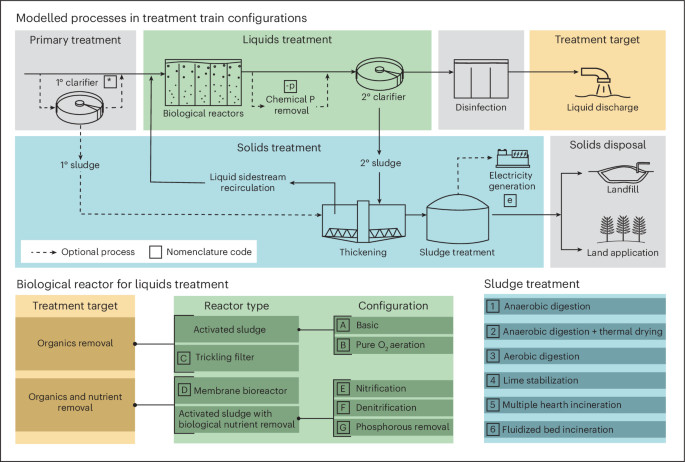
Using reported unit process data, we assigned each facility one or more treatment trains, abbreviated using alphanumeric codes, based on those previously defined by Tarallo et al.16 but with modifications to reflect additional possible combinations of liquids and solids treatment processes (full details are provided in Supplementary Methods section 2.2.2) Each treatment train is a unique combination of unit processes depicted in Fig. 1, and each configuration includes liquids and solids treatment processes, with optional primary treatment, chemical phosphorous removal and CHP for energy recovery. Liquids (or secondary) treatment technologies include activated sludge configurations, trickling filters and membrane bioreactors. Solids treatment options include aerobic and anaerobic digestion, lime stabilization and two incineration methods (see Supplementary Tables 2 and 3 for additional details). With available unit process data, we assigned treatment trains to 10,962 facilities, approximately 69% of the national fleet.
Where unit process data were incomplete or unavailable, we assigned treatment trains on the basis of facilities of a similar size and geographic location. For the 1,991 facilities with only partial unit process data available (that is, plants that provide information on secondary treatment or solids management but not both), we assigned treatment trains on the basis of the most common treatment train of similar plant size in the same EPA region, considering key unit processes present (activated sludge, biological nutrient removal, aerobic/anaerobic digesters, lime stabilization, incineration and trickling filters). For the remaining facilities with either insufficient partial data or fully absent data (2,910 facilities), we assigned a treatment train on the basis of the most common treatment train of similar plant size in the same EPA region. Supplementary Fig. 2 and Supplementary Table 7 provide a size breakdown and additional details on facilities with missing data.
Facility-level emissions associated with energy
For all treatment trains in the national inventory, we calculated electricity and natural gas consumption, as well as on-site electricity generation from biogas utilization. We used energy calculations from the results of process models in GPS-X reported by Tarallo et al.16. Because our study includes treatment trains beyond those reported by Tarallo et al., we used mass and heat balances for unit processes to determine energy requirements for treatment trains that were not modelled previously16 (details in Supplementary Methods section 2.3.1).
To estimate the GHG emissions associated with electricity consumption, we assigned each facility a regional emissions factor (kg CO2e kWh−1). Specifically, we used existing model results that simulate the energy mix across 134 simulated subregions of the USA, reflecting state-level and utility boundaries and capturing the existing variation to maintain load–interchange–generation balance39. We calculated electricity emissions factor (kg CO2e kWh−1) for each geographic region using the corresponding total emissions (kg CO2e) divided by the net power generated, as reported in National Renewable Energy Laboratory (NREL) Standard Scenarios Cambium data for 202017,40. We used data from the mid-case scenario based on central parameter values, including future electricity consumption, fuel costs and technology selection. We also calculated full fuel cycle GHG emissions for electricity and natural gas using the Greenhouse gases, Regulated Emissions, and Energy use in Technologies (GREET) model41 (Supplementary Table 18).
Carbon dioxide, methane and nitrous oxide
We estimated total CO2, CH4 and N2O from biological treatment processes, referred to here as ‘process emissions’ for brevity. For CO2, we assumed a baseline of 11.9% of influent carbon is of fossil origin, and 53.5% of influent COD (508 mg l−1) is released as CO2 during biological treatment42. To determine CH4 production, we used emissions factors based on the presence of key unit processes, and for N2O production we used emissions factors based on treatment targets. Namely, anaerobic processes (anaerobic digestors and lagoons) emit CH4, and nutrient removal processes emit N2O. For CH4, we used data reported by Song et al. (2023) to assign emissions on the basis of whether a facility contains an anaerobic digester3. For facilities with anaerobic or facultative lagoons, we used emissions factors reported by the IPCC43. For N2O, we developed emissions factors using data compiled by Song et al. (2024) to determine the median value of literature-reported values categorized by treatment objective: organics removal, nitrification or full denitrification5 (Supplementary Table 20). N2O emissions factors are a function of influent TN, and we assumed a range typical of domestic wastewater (23–69 mg l−1)44. As with CH4, we used N2O emissions factors reported by the IPCC for aerobic, anaerobic and facultative lagoons43. For uncategorized lagoons, we calculated both CH4 and N2O emissions factors using a flow-weighted average of the three other types of lagoon in the contiguous USA. For specific emissions factors and additional details, see Supplementary Methods section 2.4.
Biosolids-associated emissions
To estimate biosolids production, we combined reported production rates, where data were available, with mass flow calculations where data were unavailable. For 2,124 facilities, we used the US EPA’s Biosolids Biennial Report for 2020–202145, which documents the volume of biosolids produced, and their ultimate disposal through incineration, landfilling or land application. For the remaining facilities, we calculated sludge production based on facility flow rate, as developed elsewhere11 and described in Supplementary Methods section 2.5.1. For land applied biosolids, we used the IPCC N2O emissions factor for organic soil amendments27. For landfills, we used the US EPA’s Landfill Gas Emissions Model (LandGEM) to calculate the CH4 emissions factor for municipal solid waste landfills46. Full details are included in Supplementary Methods section 2.5.2.
Uncertainty and sensitivity analyses
For all treatment trains, we conducted Monte Carlo simulations (N = 10,000) for 19 input parameters subject to uncertainty. We selected all uncertainty ranges and distributions (Supplementary Table 24) using the tiered selection criteria previously developed47,48, with minor modifications described in Supplementary Methods section 2.6. Sensitivity analyses evaluated the relative impact of all input parameters on total per-volume GHG emissions for each treatment train, using Spearman’s rank order correlation coefficients. In this analysis, we defined key drivers of uncertainty as those with a P value <0.05 and an absolute ρ value >0.2.
For national-level results, we also evaluated uncertainty around two additional inputs: local electricity carbon intensity and facility biosolids production. We determined baseline facility-specific carbon intensity using 134 geographic regions reported in NREL Standard Scenarios Cambium data for 202017,40 and determined emissions factors for each electricity production pathway using the GREET model41. For local electricity carbon intensity, we assumed a uniform distribution with 80% and 120% of the baseline value as the lower and upper bound, respectively. For biosolids, we calculated the baseline facility-level mass flow rate and determined disposal pathways as described above and in Supplementary Methods section 2.5. Next, we used facility-level data to calculate the national total biosolids mass flow to landfills and land application. For our uncertainty analysis, we assumed a uniform distribution with 80% and 120% of the national total biosolids mass flow rate as the lower and upper bounds, respectively. Full details are provided in Supplementary Methods sections 2.5 and 2.6.
Due to the large number of facilities included in this study, we report only median values for all facility-level results (Figs. 4 and 5 and Supplementary Dataset C). Specifically, for each WWTP, we used median emissions factors to estimate emissions from individual processes (for example, biological CH4 emissions and upstream electricity emissions) and summed across all processes at a given facility to determine total emissions.