
Study source and population
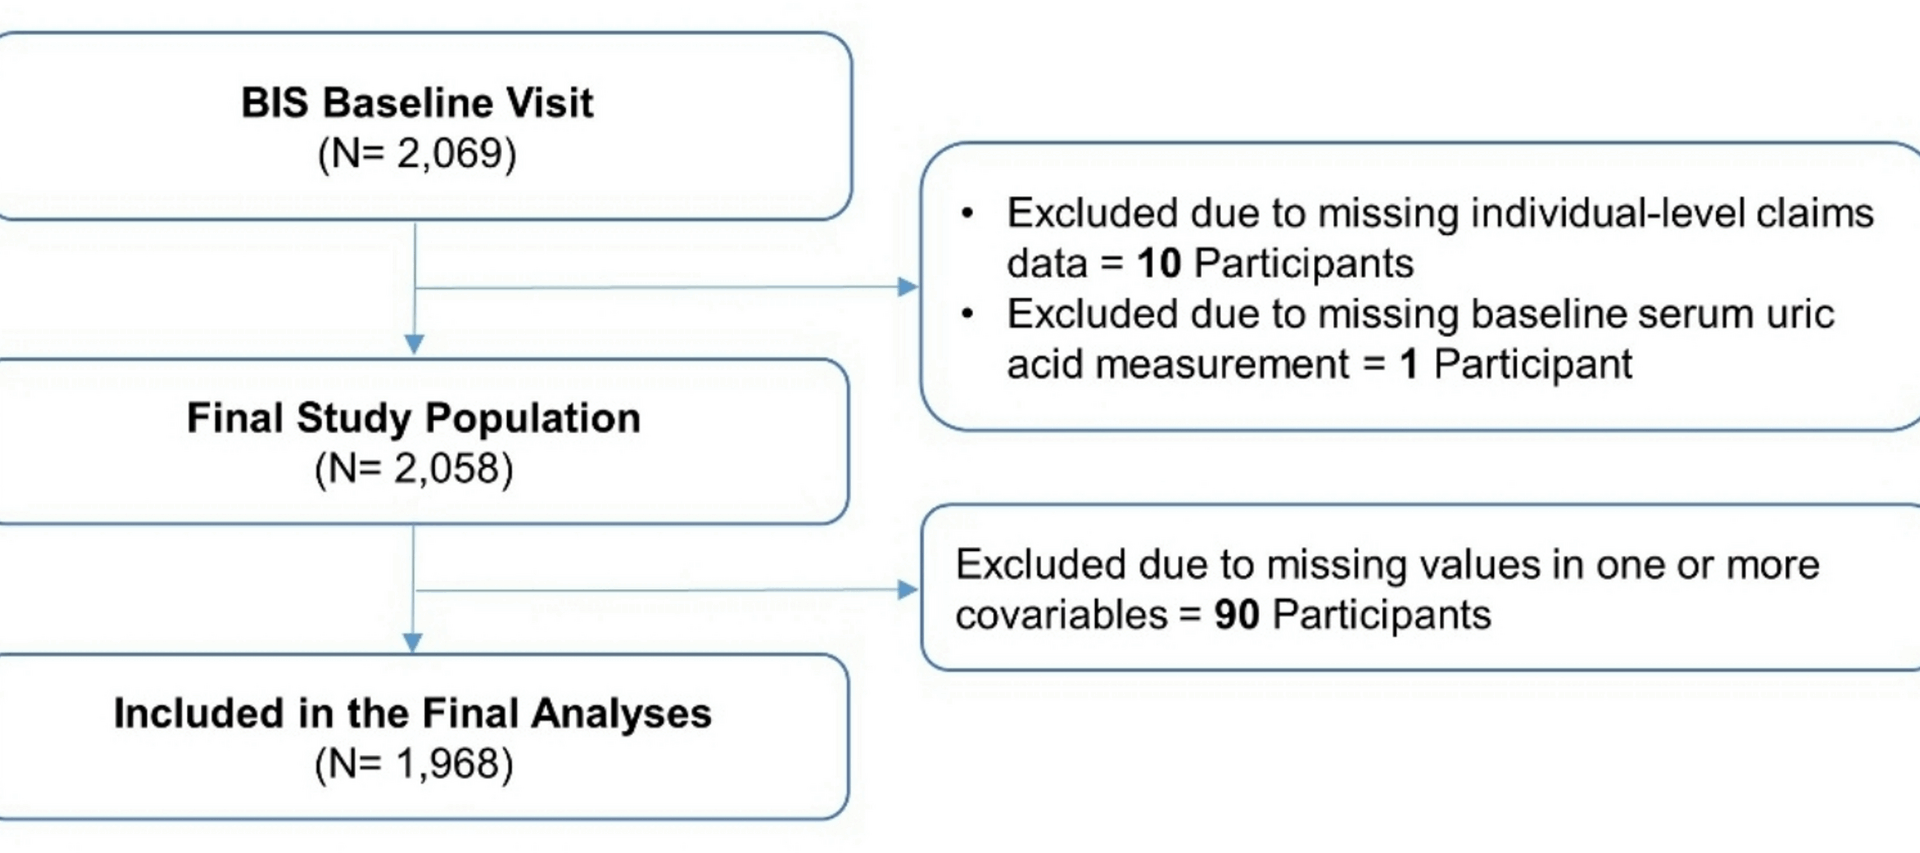
We used data from the Berlin Initiative Study (BIS), a population-based cohort study that was initiated in 2009 to prospectively assess chronic kidney disease (CKD) among 2,069 community-dwelling older adults. Inclusion criteria of the BIS were membership in the statutory health insurance fund “AOK Nordost – Die Gesundheitskasse” and age of at least 70 years [8]. Exclusion criteria of the BIS were requirement for nursing care or kidney replacement therapy in the form of dialysis or transplantation at baseline. The study was approved by the Ethics Committee at Charité – Universitätsmedizin Berlin (EA2/009/08) and was conducted in alignment with the Helsinki Declaration on Medical Research Involving Human Subjects.
For the analyses presented here, in addition to the aforementioned inclusion and exclusion criteria of the BIS, we also required individuals to have a valid assessment of SUA at baseline and linkage to individual-level healthcare claims data. Participants were followed up from the date of their inclusion in the BIS (‘baseline’) until the date of the outcome, two years after their last attended BIS visit, four years after their last visit with measurement of SUA levels (see below), or the end of study period (2021), whichever occurred first.
Exposure definition
SUA was measured via the standardized enzymatic colorimetric method (UA plus cobas® assay) using a Roche/Hitachi modular analyzer (Roche Deutschland Holding GmbH, Baden-Württemberg, Germany). Based on the distribution of SUA among the total study population at baseline, we created tertiles of SUA levels and operationalized them as an ordinal categorical variable with the following groups: tertile 1 with SUA values 1.68–5.16 mg/dl (‘lower SUA levels’); tertile 2 with SUA values 5.17–6.48 mg/dl (‘intermediate SUA levels’); and tertile 3 with SUA values 6.49-13.00 mg/dl (‘higher SUA levels’). Given the population-based character of the BIS, the distribution of SUA levels in our study should approximate the distribution of SUA levels in the older German general population. We used a time-varying exposure definition, where participants were allowed to contribute person-time to > 1 exposure groups over time. SUA values were updated at every biennial visit during follow-up. Missing SUA values were imputed using the ‘last observation carried forward’ approach. For participants with consecutive missing SUA values (n = 33; Table S1), only the first missing value was imputed using the observed value from the preceding visit. A detailed illustration of the approach we used for missing SUA values during follow-up is shown in Figure S1.
Outcome definition
The two study outcomes were MACE and all-cause mortality. MACE was defined as a composite endpoint consisting of non-fatal stroke, non-fatal myocardial infarction (MI), and cardiovascular death. For non-fatal stroke and non-fatal MI, we used individual-level healthcare claims data and self-reported information by the participants. Self-reported information was validated based on official hospital reports. Non-fatal stroke was defined using the 10th Revision of the International Classification of Diseases, German Modification (ICD-10-GM) codes I61, I63, and I64; non-fatal MI was defined using the ICD-10 GM codes I21 and I22. For cardiovascular and all-cause mortality, we used individual-level healthcare claims data, which were validated based on death certificates (available in 88% of the cases). We also used the confidential part of death certificates to determine the cause of death. A cardiovascular cause of death was defined as death due to MI, coronary heart disease, cerebrovascular disease or peripheral vascular disease and was assessed by two independent physicians (NE and ES); any disagreements were resolved through discussion.
Covariate assessment
In the BIS, covariates were assessed based on primary data complemented by secondary data (i.e., individual-level healthcare claims data from the insurance fund). Primary data included self-reported information by BIS participants on sociodemographic variables, lifestyle variables, and comorbidities that were collected at baseline using a standardized questionnaire. They also included measurements of anthropometric variables, clinically relevant biomarkers, and geriatric assessments.
For the current analysis, we selected potential confounders based on subject matter expertise and literature search. We included the following sociodemographic and anthropometric variables: age (modeled flexibly via B splines), sex, level of general and vocational education (low, intermediate, high) according to the Comparative Analysis of Social Mobility in Industrial Nations scale [9], and body mass index (continuous variable). We also included the following lifestyle variables: history of smoking (binary variable), history of alcohol intake (binary variable), and frequency of physical activity (less than once per week, 1–2 times per week, 3–5 times per week, or more than 5 times per week). In addition, we included two renal parameters: estimated glomerular filtration rate (eGFR) using the BIS2 equation (modeled flexibly via B splines) [10] as a measure of kidney function and urine albumin to creatinine ratio (ACR) as a measure of kidney damage. Moreover, we included the following comorbidities: treated arterial hypertension, diabetes mellitus, hyperlipidemia, active cancer, prior MI, prior stroke, heart failure, and peripheral vascular disease. Covariate definitions are shown in Table S2. Finally, we assessed use of SUA related medications at baseline (allopurinol, febuxostat, probenecid, benzbromarone) and reported it in a descriptive fashion. Given the lack of an association between these medications and the risk of the study outcomes, we did not deem them to be confounders and, therefore, did not include them in the statistical models.
Statistical analysis
We stratified baseline characteristics according to SUA tertiles. Categorical variables were presented as absolute and relative frequencies; continuous variables were presented as mean with standard deviation or median with interquartile range according to their distribution. We used Cox proportional hazards regression with time-fixed covariates and SUA tertiles as a time-varying exposure to estimate crude and confounder-adjusted hazard ratios (HRs) along with the corresponding 95% confidence intervals (95% CIs) of the study outcomes. We compared lower versus intermediate SUA levels and higher versus intermediate SUA levels, with intermediate SUA levels serving as reference group. Person-time was also used to calculate incidence rates for the different exposure groups. The proportional hazards assumption was assessed using the Schoenfeld residuals test [11].
Secondary analyses
We conducted three secondary analyses to assess potential effect measure modifications. First, we stratified by diabetes mellitus status at baseline given the complex interplay between SUA levels and insulin resistance and the higher prevalence of hyperuricemia among patients with type 2 diabetes compared to non-diabetic populations [12]. Second, we stratified by age (70-<80 years, ≥ 80 years) given that SUA levels tend to increase over the course of life [2,3,4]. Third, we stratified by sex given the differences between men and women regarding the incidence of hyperuricemia related conditions such as gout [13].
Sensitivity analyses
We conducted two pre-specified sensitivity analyses to account for the potential impact of time-dependent confounding. Time-dependent confounding is a bias that occurs after cohort entry and can be augmented when applying time-varying exposure definitions. First, we used Cox proportional hazards regression with time-fixed covariates and SUA tertiles as a time-varying exposure and additionally adjusting for two renal parameters reflecting kidney function and kidney damage (eGFR, ACR) modelled as time-varying covariates. Second, because time-updated eGFR and ACR may lie in the causal pathway between exposure (SUA levels) and study outcomes (MACE, all-cause mortality) and thus be mediators and not ‘true’ confounders [1, 14], we used marginal structural Cox proportional hazards models with eGFR and ACR as time-varying covariates and inverse probability weighting [15]. Extreme weights were trimmed at 10, which resulted in the truncation of < 0.2% for stabilized weights.
We also conducted two post-hoc sensitivity analyses. First, we redefined our exposure based on the reference range (2.6-6.0 mg/dl for females; 3.5–7.2 mg/dl for males [16]) used in routine clinical practice (lower, within, or higher than the reference range). Second, we used directed acyclic graphs for covariate selection.
Supplementary analysis
We conducted a supplementary analysis, where SUA levels were modeled flexibly using B splines to account for potential non-linear associations with the study outcomes. All statistical analyses were conducted using R (Version 4.3.1; R Foundation for Statistical Computing, Vienna, Austria). The study was reported according to the Strengthening the Reporting of Observational Studies in Epidemiology (STROBE) statement (Table S3).