
Every once in a while – not often – the IMF/WB annual meetings taking place this week are market moving. I wrote about one recent example in the introduction to yesterday’s post. In the run-up to the annual meetings two years ago, 10-year Treasury yield had pushed up near 5 percent, its highest level since 2007. No one had any idea what was driving that move. In fact, every meeting I did that week started with the same question: “Why do you think 10-year yield has gone up so much?” Most people came away from those meetings deeply skeptical of the move and that collective judgement ended up playing out in markets. 10-year fell for the remainder of 2023 and has not dared rise back up to 5 percent ever since.
The thing that made the 2023 meetings market moving is that there was a central question – the rise in 10-year yield – around which the meetings congealed and for which there was no consensus. This made in-person exchanges at those meetings so valuable and helped turn market direction. There’s a similar degree of confusion in markets now, which centers around the unrelenting – and completely puzzling – rise in gold prices. Underneath that move are a set of subsidiary puzzles, which I discuss in today’s post.
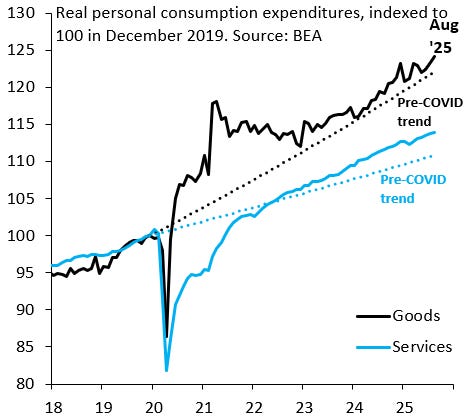
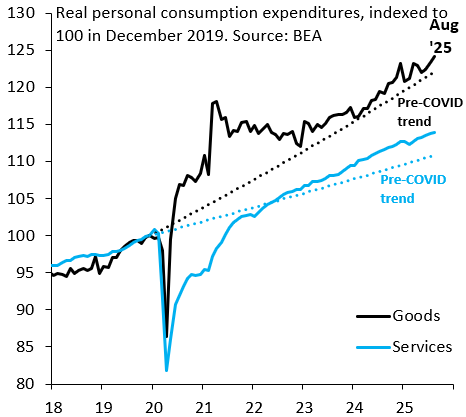
The resilient US consumer: the biggest surprise of all is the surprising resilience of private consumption in the face of substantial tariffs. There’s a number of explanations people give, most notably that consumption is increasingly driven by rich households who have positive wealth effects from the rise in the S&P 500 and crypto, but the truth is that no one has any idea what’s going on. The chart below shows real private consumption on goods (black line) and services (blue line) to August. Both series are well above their pre-COVID trends. A big puzzle.
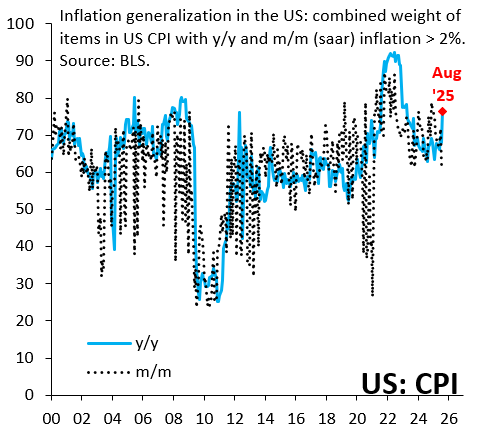
A murky inflation picture. If the real economy is puzzling, the inflation picture is just as bizarre. On the dovish side, the tariff impulse to inflation peaked in June and has faded ever since. On the hawkish side, it looks like there’s a broad-based rise in inflation momentum that’s not about tariffs and is more consistent with an economy that’s overheating. The chart below shows the combined weight of items in the CPI with inflation above 2 percent in year-over-year (blue line) and month-over-month (black line) terms. Leaving aside the post-COVID inflation shock, we’re near the upper end of the range for this measure. There’s something going on with inflation that’s deeply puzzling.
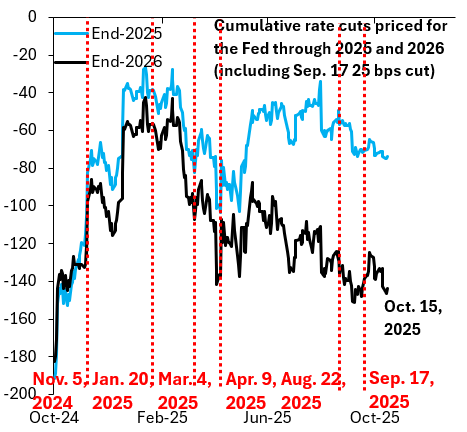
The dovish Fed. If private consumption is solid and the inflation picture murky, it’s far from obvious why the Fed is signaling a substantial cutting cycle. The chart below shows what’s priced in for Fed easing through the end of 2025 and 2026. One popular explanation for why so many cuts are priced is that this is about political dominance and not about the economy. But that just raises the final puzzle I discuss in today’s note.
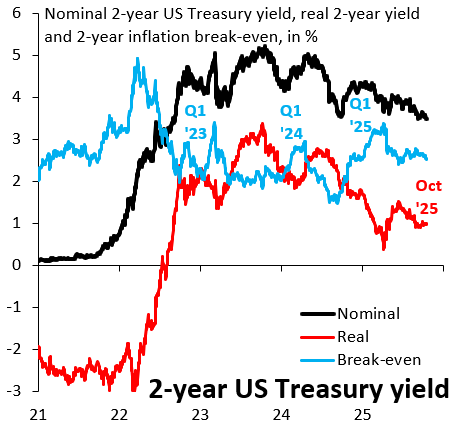
Markets don’t price a policy mistake. As the chart below shows, there’s nothing going on with break-even inflation (blue line). That’s hard to reconcile with the murky inflation picture, not to mention possible political dominance of the Fed.
What’s Occam’s razor here? The IMF/WB meetings tend to be dominated by investors from Europe, which is where the visceral recoil from Trump has been strongest. My best guess is that a lot of these people will see a country that isn’t imploding the way they thought in April. That should see them turn more bullish on US growth, more cautious on inflation, more hawkish on the Fed and – by extension – more positive on the Dollar. That’s the only way I can think for all these puzzles to be resolved.