
Study design
This multicenter observational study was conducted between January 2021 and June 2024 as a part of a prospective ongoing acute PE cohort, named the Adverse Outcomes in Acute Pulmonary Embolism patients using Computed Tomography pulmonary angiography (AOAPECT) cohort (ClinicalTrials.gov identifier NCT05098769). This study included hospitalized patients with acute PE from five large tertiary care hospitals across China. These institutions are regional medical centers with integrated medical-system databases.
Three local centers were used to analyze the correlation between the VS curvature ratio and deterioration, and to assess its discriminatory power for deterioration. Data from two nonlocal centers were used to validate the predictive capacity of the VS curvature ratio. Additionally, a subgroup of patients diagnosed with acute PE via electrocardiogram-gated computed tomography angiography (ECG-gated CTA) was included to examine the effect of cardiac cycle on the measurement of the VS curvature ratio.
This study was approved by the hospital’s Institutional Ethics Committee (No. 2021PS783K), and informed consent was obtained in accordance with the requirements of each local committee. The cohort was established according to the Strengthening the Reporting of Observational Studies in Epidemiology (STROBE) guidelines.
Study population
Patients with acute symptomatic PE who were normotensive at the time of admission were enrolled in this study. Normotension was defined as the absence of PE-related hemodynamic instability, such as cardiac arrest, obstructive shock, or persistent hypotension, based on the 2019 European Society of Cardiology (ESC) Guidelines and as documented in the admission medical records. Details of hemodynamic instability are provided in Supplementary Table S1.
The inclusion criteria were as follows: (1) age ≥ 18 years, (2) diagnosis of acute PE confirmed by CTPA, and (3) normotensive status. Exclusion criteria were: (1) receipt of reperfusion therapy; (2) pregnancy; (3) missing CTPA data for reconstruction; (4) absence of cardiac troponin I (c-Tn I) or N-terminal pro-B-type natriuretic peptide (NT-pro BNP) data; (5) absence of echocardiography within 24 h of admission; (6) incomplete medical records; and (7) loss to follow-up. The details of inclusion and exclusion criteria were described in Supplementary Figure S1. Demographic information, vital signs, laboratory data, medical history, and CTPA data were collected from the electronic medical records and documented in a unified case report form.
Measurement of VS curvature ratio and VS deviation to LV in CTPA
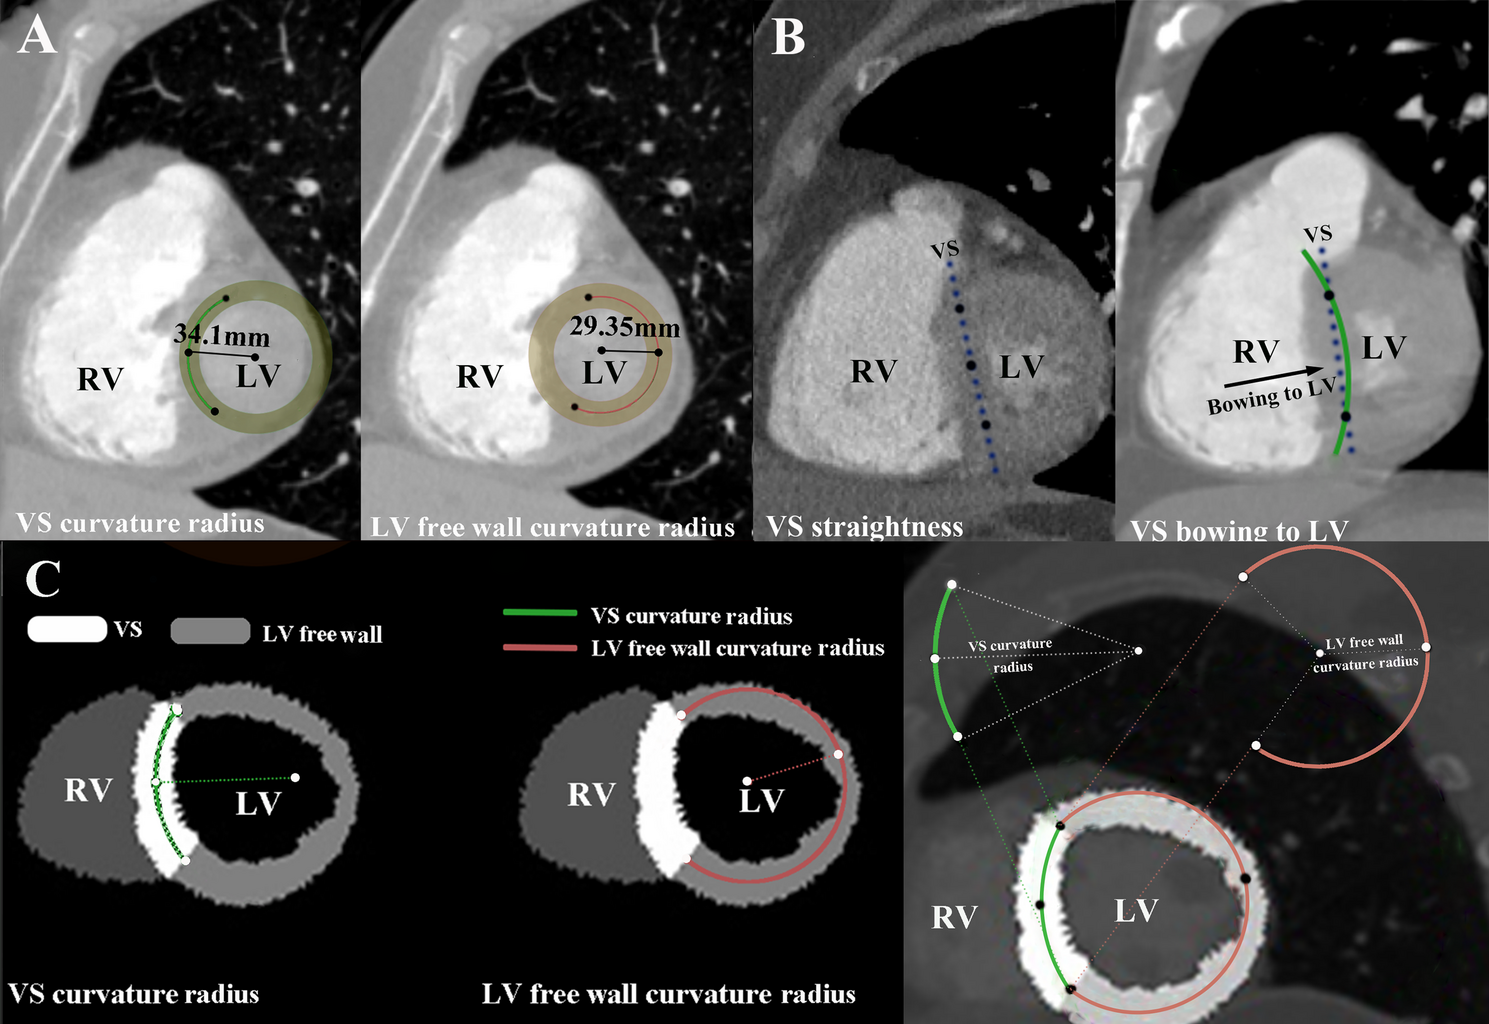
The CTPA imaging protocols are detailed in Supplementary Method S1. CTPA reconstructions were performed using the Mimics Medical software (version 19.0, Mimics Medical Software, Leuven, Belgium). The short-axis view of the RV was reconstructed using double-oblique multiplanar reformation [13]. For VS bowing to the RV, the VS curvature ratio was calculated as the ratio of the VS curvature radius to the LV free wall curvature radius (Fig. 1A). VS curvature ratio was segmented according to its curve-fitting relationship with deterioration risk. As VS curvature radius increasing until a point where no curvature radius can be calculated, VS straight & bowing to the LV was defined (Fig. 1B). For VS bowing to the RV, the following measurements were taken: (1) locating the two intersection points between the VS and the LV free wall, and use them as common points for measuring the curvature radii of the VS and the LV free wall. (2) finding the third point, which can be combined with the first two intersection points to create a circle that best fits the VS, and then calculate the VS curvature radius. (3) finding the fourth point, which can be combined with the first two intersection points to create a circle that best fits the LV free wall, and then calculate the LV free wall radius (Fig. 1C).
Fig. 1
Measurement method of measurement VS curvature ratio and typical examples. (A) VS bowing to RV and VS curvature ratio was 1.16, which was calculated as VS curvature radius (34.1 mm)/LV free wall radius (29.35 mm) at double oblique plane; (B) VS straightness and VS bowing to LV at double oblique plane; (C) Segmentation of VS and LV free wall to measure VS curvature ratio at double oblique plane. VS, ventricular septum; LV, left ventricle; RV, right ventricle
Supplementary Figure S2 and Supplementary Appendix outline a simplified method for measuring the three side lengths of the triangle inscribed in the LV to calculate the VS curvature. This method allows the VS and LV free wall curvature radius to be measured using Picture Archiving and Communication Systems (PACS), which are commonly available in most hospitals (Supplementary Video).
The four-chamber view was reconstructed to calculate the right-to-left ventricular (RV/LV) four-chamber diameter ratio [14]. The maximal diameters of the RV and LV were measured from the endocardial border to the VS using a line perpendicular to the long axis of the heart [11]. The RV/LV diameter ratio was also calculated (Supplementary Figure S3).
In the transverse section of CTPA, if the VS bowing direction was towards the RV, VS deviation to LV was not defined (Supplementary Figure S4A); however, if the VS was straight or bowing towards the LV, VS deviation to LV was defined (Supplementary Figures S4B and S4C) [10].
Risk stratification calculation
The 2019 ESC risk stratification, Bova score, and simplified Pulmonary Embolism Severity Index (sPESI) were applied based on patients’ characteristics at the time of acute PE diagnosis [9, 15]. For the 2019 ESC risk stratification, the patients were classified into low-, intermediate-low-, and intermediate-high-risk groups. For the Bova score, the patients were classified into low-, intermediate-, and high-risk groups. For sPESI, patients were classified as low- or high-risk groups (Supplementary Tables S2, S3, and S4). The RV function was evaluated by echocardiography. Tricuspid regurgitation velocity (TRIV) and systolic pulmonary artery pressure (sPAP) were measured (Supplementary Method S2).
Study outcomes
Deterioration was defined as any PE-related clinical adverse event occurring within 7 days and 30 days after admission, including death, cardiac arrest, hemodynamic instability (Supplementary Table S1), unplanned endotracheal intubation, unexpected requirement for mechanical ventilation endotracheal intubation, or mechanical ventilation, as documented in the medical records or follow-up. Investigators evaluating outcomes were blinded to the clinical and laboratory data collection and CTPA parameter measurements [16].
Statistical analysis
Continuous and categorical variables are expressed as median (interquartile range [IQR]) and percentages (%), respectively. Comparisons between groups were performed using the Mann-Whitney U test for continuous variables and the chi-square test for categorical variables. A random-effects model with inverse variance weighting and the DerSimonian and Laird approach was applied, with a sensitivity analysis performed using fixed effects (random effects) [17]. Heterogeneity among the three centers was assessed using forest plots and I² statistic [18]. Inter-observer variability was evaluated by randomly selecting 20% of the patients’ CTPA images, which were independently measured by two investigators. Intraclass correlation coefficients (ICC) and Cohen’s κ coefficient were calculated using a two-way mixed-effects model, with interpretation thresholds as follows: <0.5 (poor), 0.5–0.75 (moderate), 0.75–0.9 (good); and >0.9 (excellent) [19].
Curve-fitting analysis was conducted to evaluate the relationship between VS bowing to RV and deterioration, with VS curvature ratios partitioned into different intervals based on dose-response effects [20]. A log-likelihood ratio test comparing the one-line model to the segmented regression model was used to determine the presence of thresholds [21]. Based on the curve-fitting relationships, VS curvature ratios were stratified, and other important covariates related to PE-related prognosis, such as age [9], sex [22], heart rate (HR) [23], systolic blood pressure (SBP) [24], and RV/LV diameter ratio [25], were also categorized according to their relationship with deterioration. Trend analysis across different VS curvature ratio strata was performed using the Cochran-Armitage method. Hierarchical logistic regression analysis was used to assess the association between VS curvature strata and deterioration, with odds ratio (OR) and 95% confidence interval (CI) calculated. Multivariate logistic regression models were used to determine the independent association with deterioration, adjusting for age, sex, hospital site, HR, SBP, and the RV/LV diameter ratio. Besides, we conducted a spearman’s correlation analysis between echocardiography-related parameters and VS curvature ratio.
To evaluate whether the VS curvature ratio improved the discrimination power for deterioration, its performance was compared with traditional risk stratification methods (2019 ESC risk stratification, Bova score, and sPESI) using a receiver operating characteristic (ROC) curve analysis. The area under the ROC curve (AUC), sensitivity, specificity, positive predictive value (PPV), and negative predictive value (NPV) were calculated. Differences in AUCs were compared using the DeLong test [26]. Clinical utility was assessed using decision curve analysis (DCA) to estimate the net benefit across different threshold probabilities, and calibration was evaluated using a calibration curve to assess the consistency between actual and predicted deterioration events. All statistical analyses were conducted using R software (version 4.2.0; R Foundation, https://www.r-project.org) with statistical significance as p < 0.05.