
Kirill Kaprizov, Connor McDavid, Jack Eichel, Kyle Connor and now Martin Necas. Just like that, next year’s elite UFA class suddenly looks extremely thin. That leaves Artemi Panarin, Adrian Kempe and Alex Tuch as the last of the big-name free agents.
In this current cap environment, it’s impossible to know just how much those three can get on the open market. When talent becomes more scarce than cap space, it’s bound to lead to some extremely eye-popping numbers — especially from teams flush with cash and desperate for wins.
That doesn’t mean teams should abandon the concept of cap efficiency; it just means not being as rigid as they once were. Paying too much for a declining asset — which almost all UFAs are — is still risky business. And that business might start seriously booming with all the leverage going to the top players.
Panarin is going big, Kempe could ask for the moon given his start, and Tuch’s asking price is apparently over $10 million.
Here’s how I would price each player, with some help from AFP Analytics’ projections over at Cap Wages.
Artemi Panarin

Top comps: Henrik Zetterberg, Sidney Crosby, Marián Hossa, Martin St. Louis, Patrick Kane
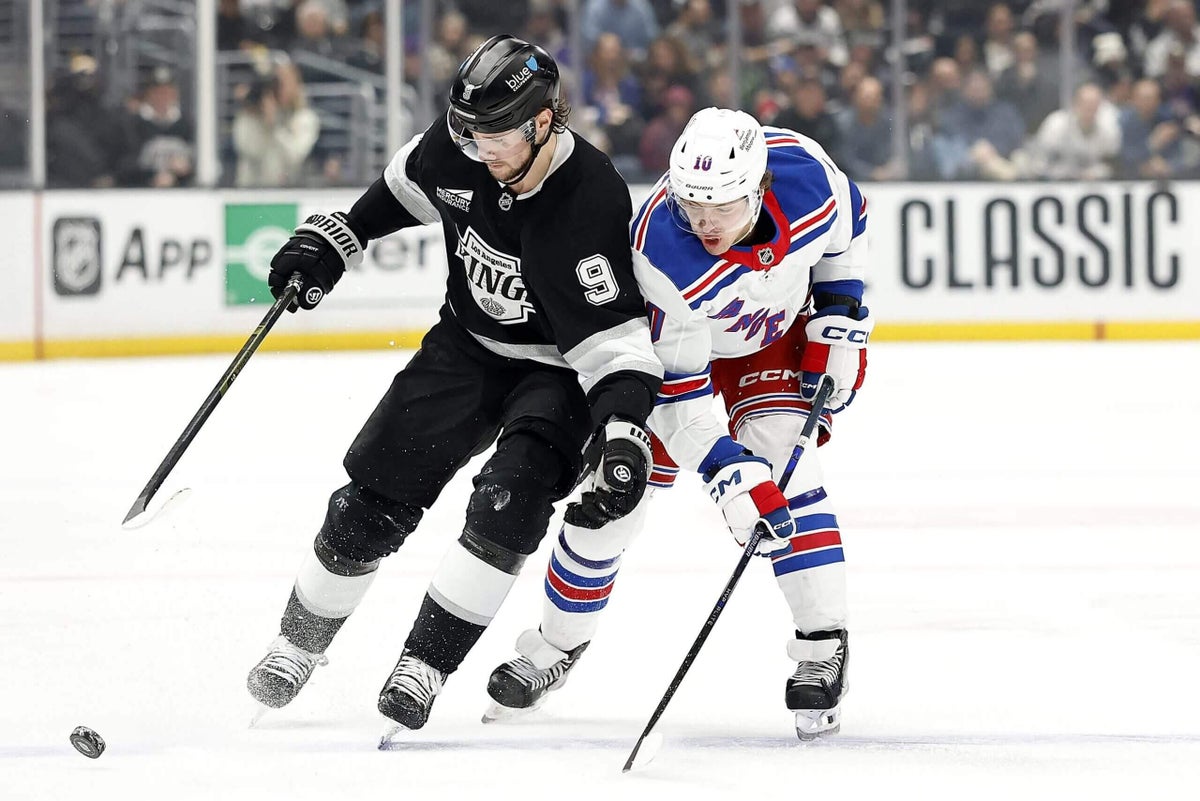
Like a lot of Rangers, Panarin is off to a really slow start offensively with just seven points in 14 games. His underlying numbers still look great, and it’s nice to see he’s bought in defensively along with the rest of the team. He still projects as an elite winger.
For how long is the question, though, as Panarin is eyeing a lot of term. Over the next four years, he looks to be worth his current price tag (and more than AFP’s $10.4 million), but anything longer drops his value accordingly. In Year 5, he drops to $9.2 million, in Year 6, it’s $7.5 million and anything more probably shouldn’t be entertained.
Panarin has some great comps that aged really well into their late 30s, which limits some risk, but anything above his current $11.6 million should be a no-go.
Adrian Kempe

Top comps: Logan Couture, Brock Nelson, Max Pacioretty, Tomas Hertl, Blake Wheeler
Kempe seems to only get better every year and looks like the kind of player that can drive percentages. In each of his last four seasons, his goals rate has been at least seven percentage points clear of his expected goals rate. He gets results and puts numbers on the board.
Still, a drop to 45 percent xG this season is a bit of a red flag for a player entering his 30s whose game relies a lot on speed. According to NHL Edge, Kempe’s top speed has dropped from 94th percentile last year to 69th this season, and his 20 mph bursts per game rate has dropped from 3.3 to 2.1.
Kempe is a great player, but not an elite one. Considering Connor went for $12 million and Necas went for $11.5 million, anything above $11 million is a tough sell. He’s not at that level.
Alex Tuch

Top comps: Tomas Hertl, Logan Couture, Brock Nelson, Andrew Ladd, Ryan Kesler
The rumors surrounding Tuch’s next deal are the main reason I wanted to look into the top of next year’s free agent class. They’re … uhh … a little much. AFP has him at $8.5 million, while I think he’s closer to $7.5 million — a lower mark that has a lot to do with age. Any deal paying Tuch over the rumored $10 million ask would be immediately onerous.
Tuch is a tremendous player who is off to a great start. He has a history of scoring goals and driving play — a guy any team would be lucky to have. But he’s not elite. While it’s true $10 million is in line to become average first-liner money during the life of a long-term deal, it’s unlikely Tuch continues to play at that level for the majority of his next contract. Tuch likely declines faster than the market rises (and some of his best comps have a scary trajectory), projecting to land in second-line territory by Year 3 of any long-term deal.
With any projection, it’s the range of outcomes that’s most important. It’s possible Tuch ages gracefully and earns his keep. But every million bucks over the average forecast lowers the odds of a good deal. For Tuch, a $10 million deal provides positive value 31 percent of the time and every $500,000 above that decreases the odds by roughly five percentage points. For reference, Jeff Skinner’s deal came in at 21 percent in a world where the salary cap didn’t go flat, meaning an $11 million deal for Tuch would be a similar overpay.
Really, it’s a question of risk appetite. Teams have much more cap room going forward to add risky deals to their roster portfolio, especially if they’re able to make it up elsewhere. But that doesn’t necessarily mean bending the knee for a bad deal.
Buffalo is in a tough spot, given the franchise’s current lack of desirability after over a decade of ineptitude. Keeping talent should be the priority, but there’s a limit to that — a walk-away price. To keep Tuch, the Sabres are going to have to overpay, but $10 million should be a hard line given where the current market is.
16 stats
1. Doan is the real deal
In the summer, I wrote a piece that looked at which teams improved the most during the offseason. The Sabres were ranked controversially high, a product of the JJ Peterka trade that landed them Josh Doan and Michael Kesselring. The argument: Buffalo’s depth would be greatly improved with two under-the-radar pieces. The jury is still out on Kesselring, who has only suited up for four games so far, but to this point, Doan has more than delivered.
Doan’s plus-2.0 Net Rating leads all Sabres forwards at the moment, a product of scoring four goals and nine points in 13 games and leading the team with a 59.3 percent xG. That’s well above the next best Sabres forward (Tuch at 54 percent). The latter mark shouldn’t be a surprise either, given Doan posted a 59.7 percent xG last year in Utah.
The next step is finding more ice time for Doan. Despite dominating possession and being second in points per 60 (2.37) and shots per 60 at five-on-five (10.3), Doan currently has Buffalo’s eighth-highest ice time among forwards at five-on-five. If the Sabres are serious about finally getting to the playoffs, that usage needs to change.
2. Do the Leafs low-key miss Holmberg?
Toronto has a lot of bodies in the bottom six, so “miss” might be the wrong word for Pontus Holmberg. But he might’ve been the wrong guy to give up on, considering his play in Tampa Bay so far. The Lightning are giving up just 1.72 xGA per 60 and 0.39 GA per 60 with Holmberg on the ice this year, and he’s not playing easy minutes either. The fourth line, where Holmberg plays with Yanni Gourde, is actually facing similar levels of offensive competition as Tampa Bay’s first line.
A quality fourth line can really help ease the burden for a scoring line, and Holmberg’s presence looks to be providing that. His plus-1.8 Defensive Rating — which accounts for his low minute usage and moderate quality of competition — is among the league’s best. It would also lead the Leafs.
3. Zadorov, defensive rock star
It always felt like Nikita Zadorov’s eye test didn’t really match his defensive results, but that’s changed so far this year. Through 15 games, his plus-2.8 Defensive Rating ranks third in the league behind Vladislav Gavrikov and Brayden McNabb. Zadorov is taking on the toughest assignments on the Bruins, yet allows just 2.14 xGA per 60. The next closest regular, Andrew Peeke, is at 3.02. That’s one of the largest discrepancies in the league.
4. Demidov is super-charging Montreal’s power play
Five games ago, the Canadiens (finally) added their rookie sensation to the top power-play unit, a move that created instantly incredible dividends. In just 12:28 minutes of time together, the team’s top power play with Ivan Demidov has already scored six goals. For those doing the math at home, that’s an astounding 28.8 goals per 60.
It’s a small sample and the five-man unit is shooting 60 percent (!) from the field, but it’s still an electric opening salvo from a power play that looks set to terrorize the league for the next decade.
5. Suzuki and the Selke penalty-killing debate
After the first month of the season, Nick Suzuki feels like the obvious Selke front-runner. His plus-2.3 Defensive Rating leads all forwards and the Canadiens are giving up just 1.85 xGA per 60 and 0.92 GA per 60 in his minutes. That’s elite work in tough minutes. But there’s a catch to Suzuki’s Selke bid: He’s averaging just 19 seconds of penalty-kill time this season.
In the salary cap era, there have only been three instances where a Selke finalist averaged less than a minute on the penalty kill per game. Those instances: Pavel Datsyuk, who won in 2009-10 (41 seconds), Datsyuk in 2010-11 (40 seconds) and Auston Matthews in 2023-24 (43 seconds).
Should it matter? Probably not, especially with strong enough numbers at five-on-five. But it has definitely mattered in the past. Unless Montreal starts using him more while short-handed, a Suzuki Selke would be an exception to the rule.
6. Atop the early Selke leaderboard … McDavid?
It’s too early to be talking about the NHL’s awards to begin with, especially when it comes to defensive contributions. But small samples can make it fun.
Case in point, the current front-runner based on Defensive Rating: Connor McDavid. His plus-2.0 is lower than Suzuki’s, but he’s the leader based on the usual parameters I work with (top-line ice time, shutdown minutes and at least one minute on the penalty kill per game).
With McDavid on the ice, the Oilers are allowing just 2.15 xGA per 60, which is 0.37 better than the team average. The latter is among the best marks in the league, especially against tough competition — Suzuki is at 0.39, for the record — and McDavid is also managing that while playing nearly one full minute more per game at five-on-five than the next highest forward. There’s defensive value in eating minutes and slowing down a high-pace environment, both of which Defensive Rating accounts for.
Whether McDavid should be slowing things down, though, is up for debate. As his defensive metrics go up, his offensive ones have dropped. His five-on-five rate of points per 60 is down to 1.37 and the Oilers are weirdly struggling to score with him on the ice, with just 2.11 goals per 60.
7. Theodore the shutdown defenseman
One more note on individual defense for Vegas’ No. 1 defenseman. Shea Theodore actually lands just behind Zadorov at plus-2.7 as his pair with McNabb has been lights-out. Together, they’ve allowed just 2.05 xGA per 60 and 1.22 GA per 60.
In the past, there have been some concerns about Theodore’s ability to handle tough matchups. Alex Pietrangelo was always the guy for Vegas, but that started to shift last season to a more balanced approach in the top four. This year, it’s been Theodore’s pair taking on some of the league’s toughest minutes — and they’ve aced that assignment.
8. Vegas’ Stone-less power play update
In the last edition of 16 stats, I mentioned how pivotal Mark Stone was to the team’s power play thanks to a specific set play with Jack Eichel and Pavel Dorofeyev. The Golden Knights have now played six games without Stone and the difference in their power play with and without is illuminating.
With Stone
TOI: 29.7 minutes
GF/60: 17.5
xGF/60: 12.6
Without Stone
TOI: 31.8 minutes
GF/60: 3.5
xGF/60: 5.7
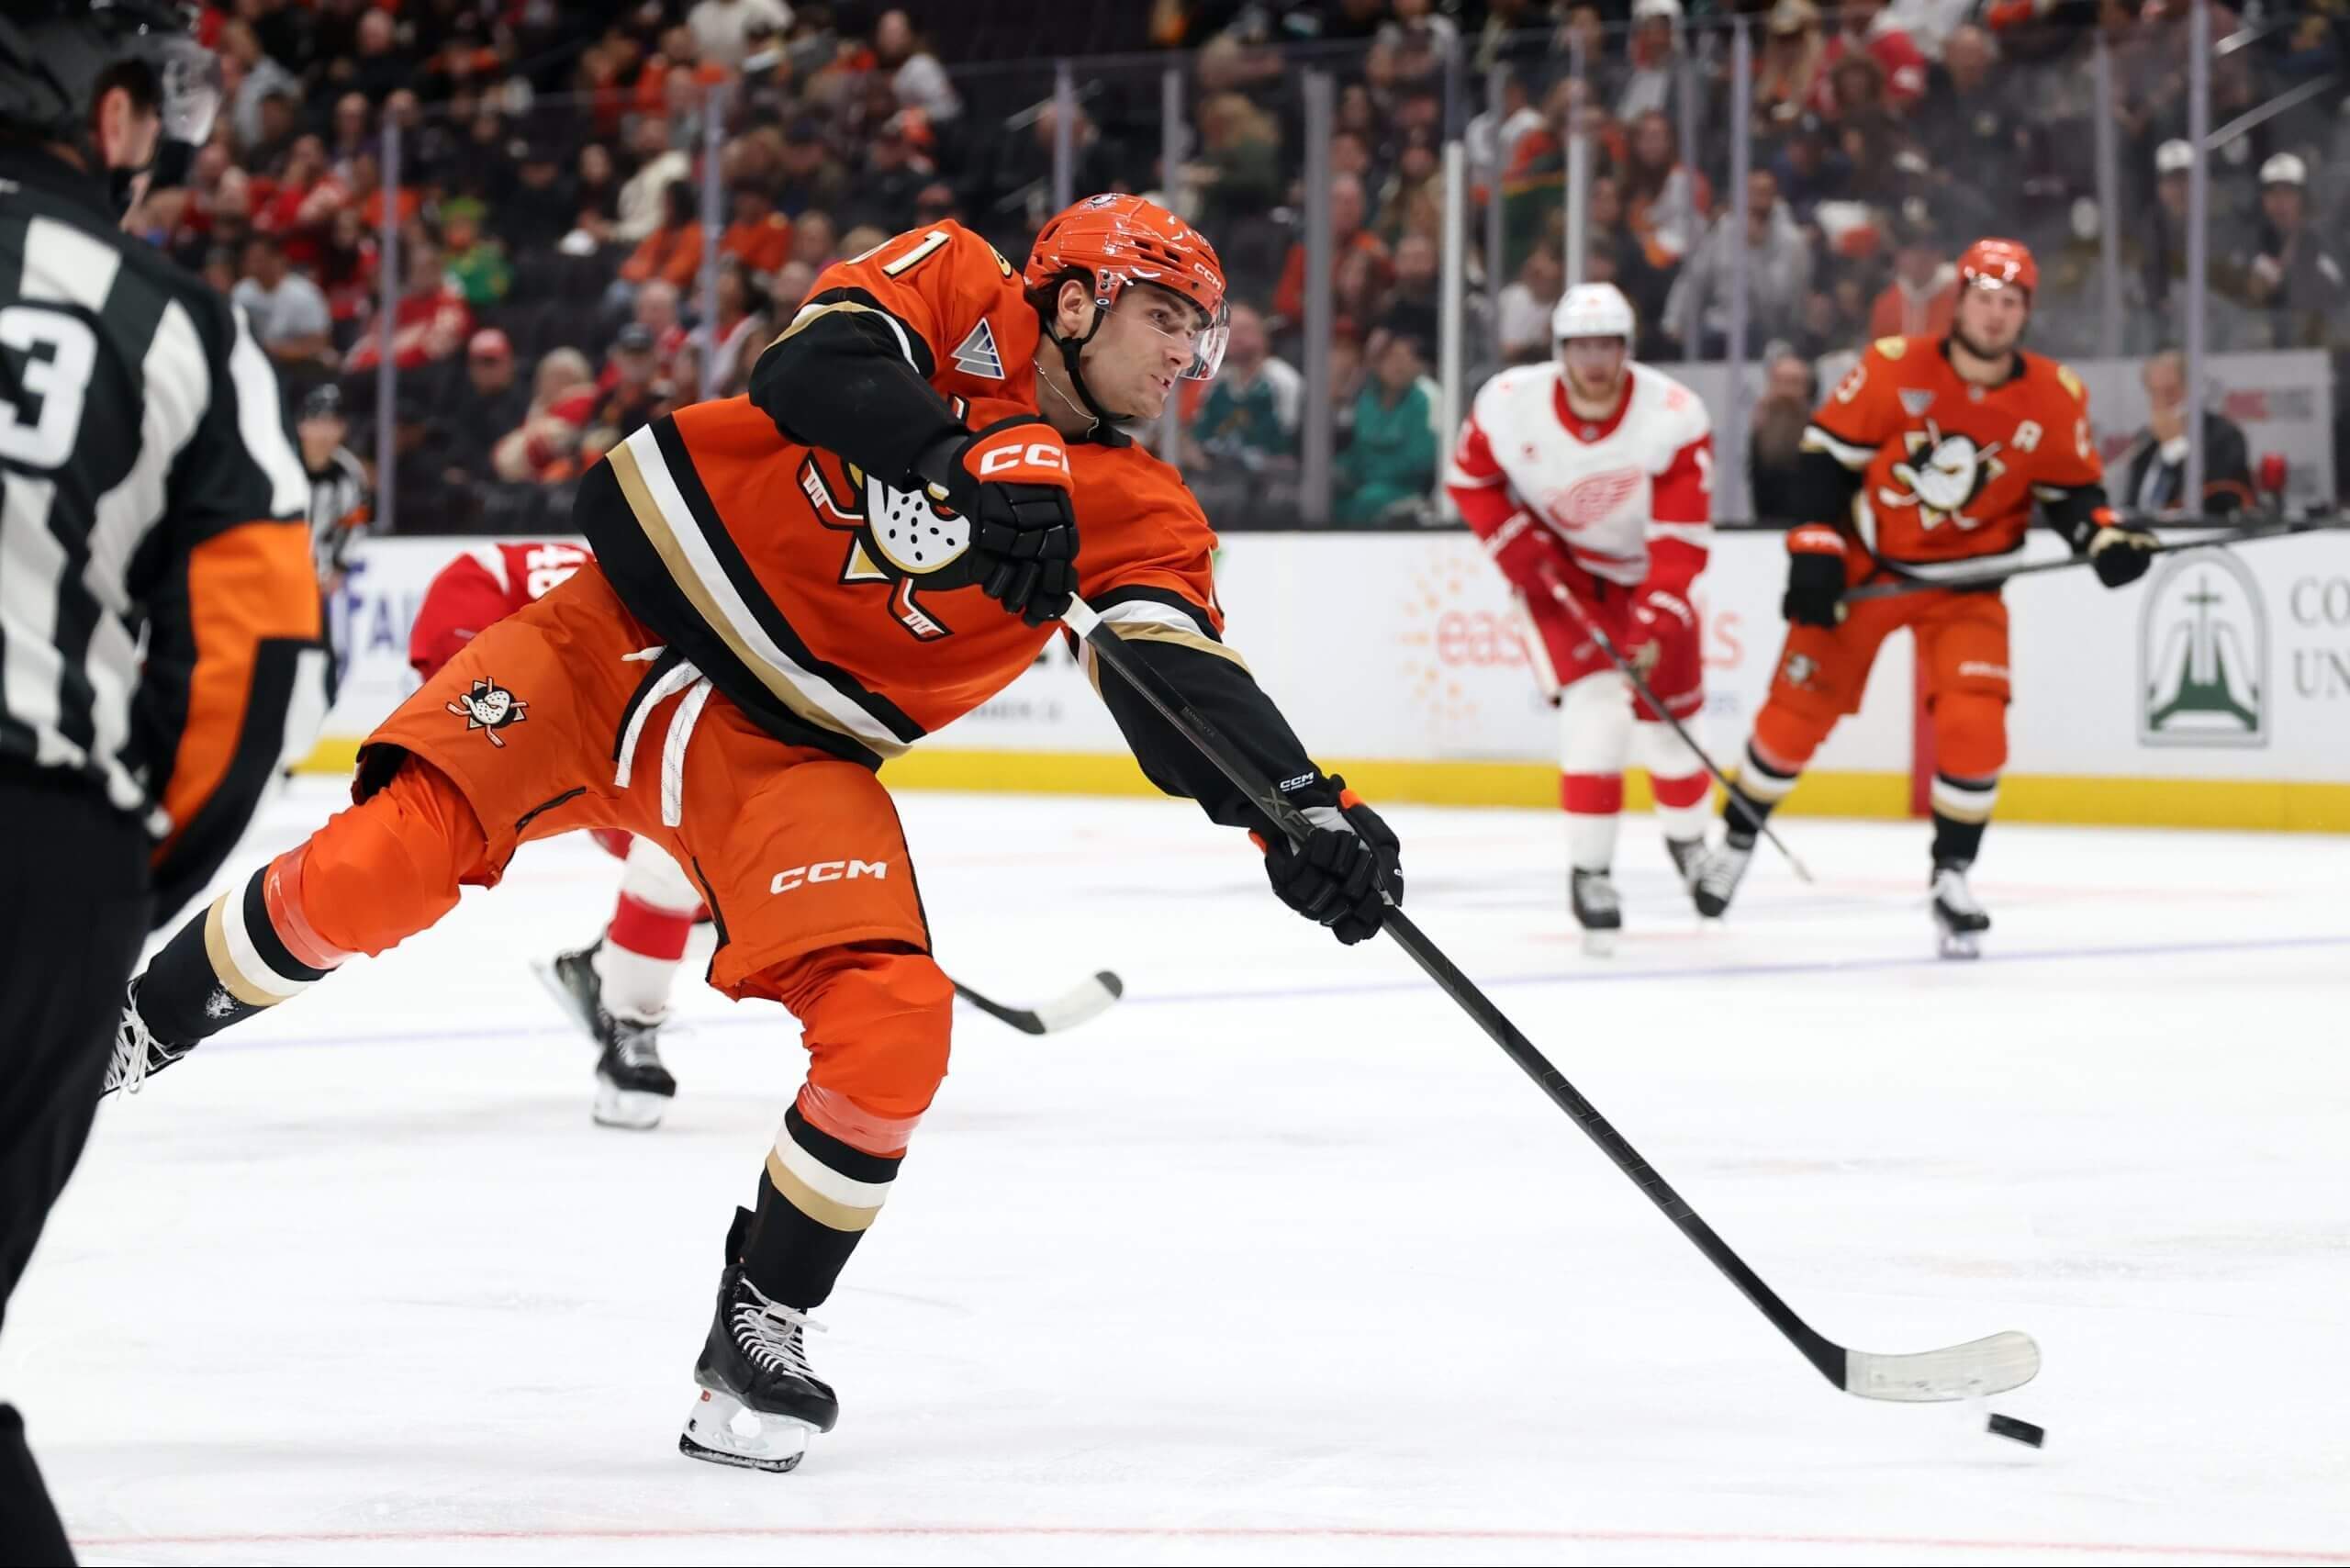
Cutter Gauthier has 10 goals in 12 games for the Ducks. (Kiyoshi Mio-Imagn Images)
9. Gauthier is letting it rip
Offensively, the Ducks are flying right now and Gauthier has been one of the leaders in that regard with 10 goals in 12 games. The biggest takeaway from that is just how shot-happy Gauthier has been with 58 shots in 12 games, or 4.83 per game. That leads the league and is about half a shot more per game than Nathan MacKinnon in second. Even more impressive is that Gauthier only plays 18 minutes per night, almost four less than MacKinnon. On a per-60 basis, Gauthier’s 16.1 is miles ahead of anyone else and isn’t far off from an analytics-era record: Alex Ovechkin’s 17.4 shots per 60 in 2008-09.
10. Ducks’ defense still a concern
Defensively, I’m still worried about the Ducks. Their offense is great, but Anaheim is still giving up a lot of chances against. The Ducks’ 3.49 xGA per 60 is the worst mark in the league, 0.3 higher than Pittsburgh and 0.49 higher than last year’s mark.
Embracing high-event hockey is probably the best course forward for such a young and exciting team, especially with an elite goalie such as Lukáš Dostál in net. But there’s still a lot that needs to be cleaned up without the puck for long-term sustainability.
11. San Jose’s top power play with and without Klingberg
The Sharks are apparently not ready to move away from John Klingberg on the top power play, but if their play on the man advantage without him is any indication, maybe they should. In 25:42 with Klingberg, Macklin Celebrini has been on the ice for 4.7 GF per 60 and 9.0 xGF per 60. With Dmitry Orlov, however, Celebrini’s numbers shoot up to 22.7 and 12.5, respectively, in 15:51 minutes. This should be a no-brainer.
12. Change of pace in New York
One thing I noticed while compiling the Playoff Report this week is how different the three New York metro area teams have been compared to their expected preseason pace.
The Devils’ Offensive Rating has dropped 7.3 goals, but their Defensive Rating has gone up by 7.7. New Jersey has slowed things down.
The Islanders’ Offensive Rating has jumped up 7.0 goals, but their Defensive Rating has dropped by 10.4. The Islanders have amped things up.
The Rangers, though, take the cake under new coach Mike Sullivan. Their Offensive Rating is down a league-worst 15.9 goals as the team struggles to score, but their Defensive Rating has gone up by a league-best 17.4 goals.
We’ll see how that changes throughout the season, but for now it’s a brand new world in New York (and New Jersey).
13. Lafrenière’s scoring slump
Alexis Lafrenière may have just one goal and six points in 14 games, but he also has 5.3 expected goals on the season. For a player who’s always scored right at his expected rate, that means getting the bounces is the difference between his current rate and being on pace for 64 points this year.
Considering Lafrenière currently leads the Rangers’ forwards in xG percentage at 59.7 percent, I’m inclined to believe he’s going to turn things around. His underlying process looks the best it ever has.
14. Robertson looks poised to explode
One of the things I always find interesting about new coaches is how they use their players compared to the previous guy. Jason Robertson is a perfect example of that.
Last season, he was Dallas’ top-used forward at five-on-five (until Mikko Rantanen showed up) at 13.8 minutes per game. This year, he’s up to 15.6 minutes. On the power play, Robertson was used 60.5 percent of the time last year compared to 79 percent this year; that comes out to one extra minute per game. Put that together and Robertson has gone from playing just under 18 minutes per game to just over 21.
That hasn’t manifested into elite results yet, but it feels like only a matter of time. Robertson has scored above three points per 60 every season, but is down to 2.41 this year. That’s mostly a result of converting on just 5.4 percent of his shots despite a massive increase in both shot volume (12.3 shots per 60 compared to 8.8 last year) and quality (expected shooting percentage of 15.2 percent compared to 12.3 percent last year). Robertson has never had a season scoring less than expected; this year, he has just three goals on 8.5 xG.
15. Minnesota’s penalty differential
The Wild are off to a tough start and what makes that even wilder (sorry) is their penalty differential. Minnesota has drawn 57 penalties this season — but only taken 33. The Wild’s plus-24 is 14 better than the second-best team. Per 60, Minnesota is at plus-1.68; no team has ever finished the season above one per 60.
16. Overtimes are way up
One of the reasons the standings feel so tight this year: more overtimes. Going into Wednesday’s games, 60 of 212 games played this year needed extra time, or 28.3 percent. That’s the highest in the cap era (25.0 percent in 2013-14) and way up from last year’s 20.7 percent, which was the lowest in the cap era. Parity!
— Data via Evolving-Hockey, Natural Stat Trick, NHL, Cap Wages and Hockey Stat Cards