
Fiber-integrated Er3+ qubit chip
Figure 1 illustrates the schematic of our Er3+ qubit device. The die chip consists of a sub-wavelength-thick, cubic-phase Er3+ doped Y2O3 film, which is transferred onto a distributed Bragg reflector (DBR) stack on a silicon substrate (Methods). High-purity, single crystal Er3+:Y2O3 films are epitaxially grown using Molecular Beam Epitaxy (MBE) on silicon (111) wafers35. The Er3+ dopants are positioned at least 40 nm away from the top and bottom crystal interfaces during the layer-by-layer growth process. Er3+ substitutes Y3+ in two lattice sites: a C2 site characterized by both electric and magnetic dipole-allowed Z1 → Y1 optical transitions, and a C3i site, which features only magnetic dipole-allowed optical transitions due to quenched electric dipoles by the centro-inversion symmetry (Fig. 1(a)).
Fig. 1: Schematic of the Er3+ qubit device and experiment setup.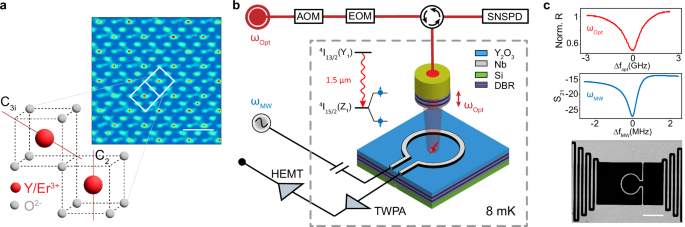
a Transmission electron microscope (TEM) lattice image of the cubic-phase epitaxial Y2O3 films grown on silicon. The scale bar is 1 nm. Yttrium oxide lattice possesses a C2 low symmetry and a C3i high symmetry site, with their respective symmetry axes shown in red. b The device consists of a tunable cryogenic fiber Fabry-Perot cavity coupled to the 4I15/2 Z1 → 4I13/2 Y1 optical transition of Er3+ and a low-impedance superconducting microwave resonator coupled to the Er3+ spin transition at 5–6 GHz. c (Top) the reflection spectrum of the fiber Fabry-Perot cavity shows a Q of 139, 000. (Middle) the spectrum of the microwave resonator exhibits a loaded Q of 3000. (Bottom) SEM image of a co-planar superconducting microwave resonator based on niobium. The scale bar is 20 μm. SNSPD superconducting nanowire single photon detector, TWPA traveling wave parametric amplifier, HEMT high electron mobility transistor. DBR distributed Bragg reflector.
Perpendicular to the plane of the chip, a tunable fiber Fabry-Perot cavity is formed by the DBR substrate and a DBR-coated dimpled fiber36. This cavity couples to the 1.5 μm telecom-C band transitions between the lowest crystal field doublets Z1 and Y1 of the 4I15/2 and 4I13/2 spin-orbit levels of Er3+, respectively. When the fiber tip is in rigid contact with the chip37, the optical cavity achieves the smallest cavity length of (3/2)λ (Methods) with measured quality factors ranging from 130,000 to 170,000. A niobium co-planar superconducting microwave resonator, specifically designed with low-impedance to concentrate the magnetic field inside an inductor loop, is patterned on the Y2O3 layer. This enables coupling to the microwave electron spin transitions between the Zeeman doublets of the Z1 optical ground state. The microwave resonator operates at a frequency of 5.81 GHz and achieves a single Er3+ spin coupling strength ≥100 Hz. This integrated optical-microwave setup enables spin and optical spectroscopy, as well as coherent control of the Er3+ qubits. Combined with the dual symmetry sites of the Er3+, this platform makes possible a comprehensive study of decoherence mechanisms in the epitaxial film matrix by comparing the optical and spin coherence across the two sites to elucidate the underlying electric and magnetic noise.
Er3+ spin anisotropy and coherence lifetimes
The intricate interplay between the magnetic anisotropy and the spin coherence for Er spins requires microwave addressing of the spins in a specific symmetry sub-site. To probe the magnetic anisotropy of the Er3+ spins, we sweep the magnetic field intensity and the in-plane (XY) field angle θ while detecting the electron spin resonance (ESR) in a sample with Er3+ doping at a few parts per million level. Substitutional Er3+ ions in the C2 site occupy six orientationally inequivalent sub-sites with pairs of sub-sites sharing a symmetry axis (principal axis of the g-tensor) along the crystallographic [1,0,0], [0,1,0] and [0,0,1] directions (cuboids in Fig. 2(a)). One sub-site of the C3i site has rotational symmetry in the plane of the film (cylinder in Fig. 2(a)). Coupling of Er3+ spins in each sub-site results in an absorptive broadening of the resonator linewidth δκ and a dispersive frequency shift δf by38
$$\delta \kappa={\Omega }^{2}{\gamma }_{s}/\left({\gamma }_{s}^{2}+{\Delta }^{2}\right)$$
(1)
and
$$\delta f=-{\Omega }^{2}\Delta /\left({\gamma }_{s}^{2}+{\Delta }^{2}\right),$$
(2)
where δκ is the increase in resonator linewidth, δf is the dispersive resonator frequency shift, Ω is the spin ensemble coupling strength, γs is the spin inhomogeneous half-width, and Δ = gμB(B − B0)/ℏ where B0 is the resonance field.
Fig. 2: Er3+ spin anisotropy and coherence lifetimes in single-crystal Y2O3 thin films.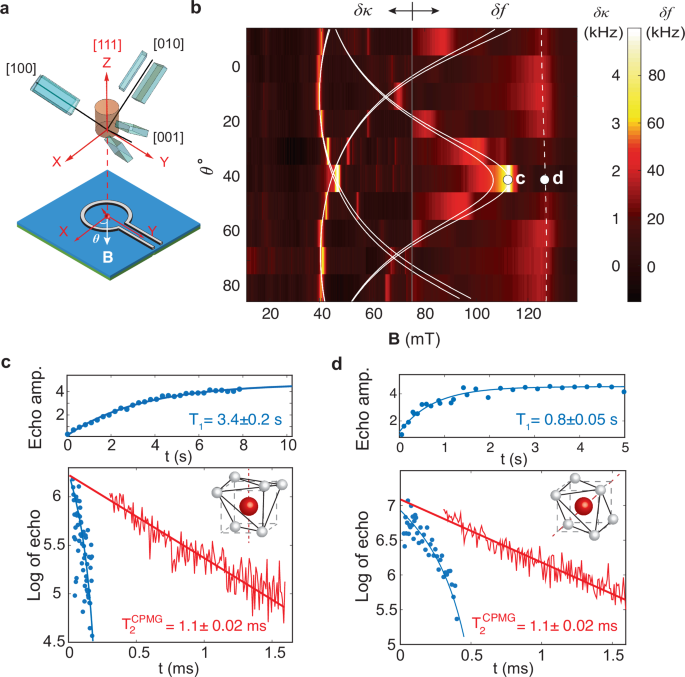
a Magnetic g-tensor axial orientation and anisotropy of six sub-sites of the C2 symmetry group are represented by cuboids, while one sub-site of the C3i group is represented as a cylinder, with Z axis aligned to the crystallographic [111] direction of Y2O3. b Scanning the B field in the plane of the chip (XY plane) reveals anisotropic (absorptive signal for B <75 mT and dispersive signal for B >75 mT are stitched) coupling of Er3+ in distinct sub-sites to the microwave resonator. White solid and dashed curves are theoretical models for all C2 and C3i sub-sites. The grey line indicates B = 75 mT, where the dispersive and absorptive signals in high and low field ranges are stitched. c Spin lifetime (T1 =3.4 s) (top) and coherence times (bottom) measured with Hahn echo (\({T}_{2}^{{{{\rm{Hahn}}}}}\)=0.18 ms, blue) and Carr-Purcell-Meiboom-Gill (CPMG) sequence (\({T}_{2}^{{{{\rm{CPMG}}}}}\)= 1.11 ms, red) for the C2 site g = 3.6 transition. d Spin lifetime (T1=0.8 s) (top) and coherence times (bottom) measured with Hahn echo (\({T}_{2}^{{{{\rm{Hahn}}}}}\)=0.38 ms, blue) and CPMG sequence (\({T}_{2}^{{{{\rm{CPMG}}}}}\)= 1.1 ms, red) for the C3i site g = 3.2 transition. The microwave frequency used for these measurements is 5.81 GHz.
Figure 2(b) plots the absorptive ESR signal for B < 75 mT combined with the dispersive signal for B ≥75 mT at different in-plane angles θ. Stitching of the two signals is for improved visibility of spin transitions in both field ranges. The full-range data for either absorptive or dispersive signal is presented in Supplementary Fig. 7. We resolve three sets of the C2 site spin transitions with strong angular dependence and a C3i site transition with nearly no angular dependence. These features are in reasonable agreement with simulated resonance fields (white solid and dashed curves) calculated from the g-tensors of Er3+ in Y2O339, confirming the coupling of Er3+ spins. More importantly, the signature anisotropy of all symmetry sites proves the single crystallinity of the Y2O3 film over the device area of 50 × 50 μm2. Slight discrepancies in Fig. 2(b) can be attributed to strain-induced perturbation to the g-factors (SI Section 1.3). Fitting the ESR signal gives a spin inhomogeneous linewidth of 68 MHz, which is much broader than that in Er3+:CaWO412 and is found to be strongly field-angle dependent (SI Section 1.3). Furthermore, we estimate from the dispersive ESR signal a total number of ≈ 6 × 10⁸ spins in either sub-site that are coupled to the resonator (SI Section 1.2), and a density of Er3+ spins of 3.4 parts per million (ppm) for each C2 sub-site and 3.1 ppm for each C3i sub-site (SI Section 1.2).
Resolved Er3+ sub-sites with distinct anisotropy enable us to enhance the qubit coherence times by operating at optimal field configurations. Specifically, spin transitions with lower g-factors, thus less noise sensitivity and strongly suppressed noise by a higher field, are preferred13. Fixing the magnetic field at θ= 40° (Fig. 2(b)), we choose a C2 sub-site with g = 3.6 spin transition at 113 mT (circle c), and a C3i sub-site with g = 3.2 transition at 130 mT (circle d), as the target spin qubits. At the calibrated spin temperature < 43.5 mT, the spins in both sites are polarized (SI Section 1.6). The C2 spins measured a two-pulse Hahn echo spin coherence time \({T}_{2}^{{{{\rm{Hahn}}}}}\) of 0.18 ± 0.01 ms following a stretched exponential decay \({e}^{-{(2t/{T}_{2})}^{n}}\) with a stretch factor n = 1.18 ± 0.02. This indicates spectral diffusion as a source of decoherence40. We applied the Carr-Purcell-Meiboom-Gill (CPMG) dynamical decoupling sequence with N = 500 π pulses and a pulse separation 2τ = 8μs to suppress the spectral diffusion and obtain a \({T}_{2}^{{{{\rm{CPMG}}}}}\) of 1.1 ± 0.02 ms, which is limited by Er-Er spin interactions41 (SI Section 1.8). Using the more robust XY8 sequence, we obtained a comparable result of \({T}_{2}^{{{{\rm{XY8}}}}}=\) 0.9 ± 0.1 ms (SI Section 1.8). The C3i spins measured a longer Hahn echo spin coherence time \({T}_{2}^{{{{\rm{Hahn}}}}}\) of 0.38 ± 0.03 ms with a stretch factor n = 2.11 ± 0.02 and \({T}_{2}^{{{{\rm{CPMG}}}}}\) of 1.1 ± 0.02 ms. Temperature dependence of the spin T2 is also investigated (SI Section 1.6), which reveals the presence of a paramagnetic spin bath contributing to Er3+ decoherence at temperatures above ~ 100 mK. It is worth noting that for Er3+ in the C3i site, the ensemble of C2 site Er3+ spins plays the role of a paramagnetic spin bath if they are not polarized.
Long spin relaxation times T1 = 3.4 ± 0.2 s for the C2 and 0.8 ± 0.05 s for the C3i sites were measured using saturation recovery sequences, which used a π pulse to first invert the spin population, followed by a Hahn echo measurement. T1 in both sites shows weak dependence on temperature and spin-cavity frequency detuning, indicating that spin relaxations are not limited by the Purcell effect but dominated by the direct-phonon process with a small contribution from spin flip-flops (SI Section 1.4). In addition, we performed three-pulse stimulated spin echo measurements to reveal spectral diffusion dynamics. The result for Er3+ spins in the C3i sub-site indicates a maximum spin linewidth of 2.9 ± 0.5 kHz on a 10 ms timescale (SI Section 1.7).
Using Er3+ spins in the C3i site as a probe, we subsequently measure spin relaxation and coherence of multiple sample chips across a Er3+: Y2O3 wafer (SI section 1.8). We find a clear trend of increasing spin T2 lifetimes with decreasing spin spectral density. The longest T1= 1.3 ± 0.4 s and Hahn echo T2= 0.47 ± 0.06 ms are measured for sample chips near the edge of the wafer, despite a broadened spin inhomogeneous linewdith and thus an increased disorder in the thin film. The corresponding \({T}_{2}^{{{{\rm{CPMG}}}}}\) is 1.72 ± 0.02 ms. These measurements inform that spin T2 is expected to be enhanced by lowering the Er3+ doping density.
Dual Er3+ telecom spin-photon interfaces
A quantum spin-photon interface requires a spin-selective, coherent optical transition. Informed by the coherence-optimized magnetic field configurations in the previous ESR measurements, here we demonstrate the optical addressing of individual Er3+ spins coupled to a fiber Fabry-Perot cavity (Methods) under identical magnetic field conditions as in Fig. 2(b) points c (B= 113 mT) and d (B = 130mT). In this experiment, we use a nominally undoped Y2O3 epitaxial film, with an estimated Er3+ trace concentration of < 50 parts per billion. Figure 3(a) plots typical photoluminescence excitation (PLE) spectra of single Er3+ ions in two symmetry sites as the cavity resonance frequency is tuned over the telecom C-band. An ion at 1535.73 nm is found near the center of the C2 site inhomogeneous line (1535.6 nm), showing a full-width at half-maximum (FWHM) linewidth of 0.4 ± 0.02 MHz. The g(2)(τ) auto-correlation measurement on this peak confirms single photon emission with g(2)(0) = 0.025 ± 0.01 (right inset) without subtraction of detector dark counts. The non-zero g(2)(0) is attributed to weakly coupled background ions. The optical lifetime of this emitter in the C2 site was shortened from 8.5 ms to 58 ± 3 μs (Fig. 3(c) inset), giving cavity QED parameters {g0, κ, γ} = 2π × {1 MHz, 1.4 GHz, 18.7 Hz} and a Purcell enhancement of 147 fold (SI Section 2.2). Tuning the cavity to 1545.5 nm, another ion near the center of the C3i site inhomogeneous line (1545.6 nm) shows a significantly narrower PLE linewidth of 71 ± 2 kHz. Due to a weaker coupling strength (g0 = 2π × 0.51 MHz) from a pure magnetic dipole allowed transition (Methods and SI Section 2.2), this Er3+ emitter in the C3i site shows a lifetime reduction from 14.6 ms in a bare film to T1 = 190 ± 10 μs in the cavity. The different Purcell enhancement factors for both sites can be explained by a spatial offset between the cavity electric and magnetic field anti-nodes. Thus, the ions in two sites are unlikely to have the same overlap with either the cavity electric (for C2) or magnetic (for C3i) field maxima. Importantly, the stark contrast in two ions’ optical linewidths reveals a significant role of symmetry in their optical coherence: while both emitters experience dephasing by coupling to a common magnetic noise bath, the C3i emitter is protected from first-order coupling to electric noise due to a quenched permanent electric dipole.
Fig. 3: Dual Er3+ spin-photon interfaces and optical coherence.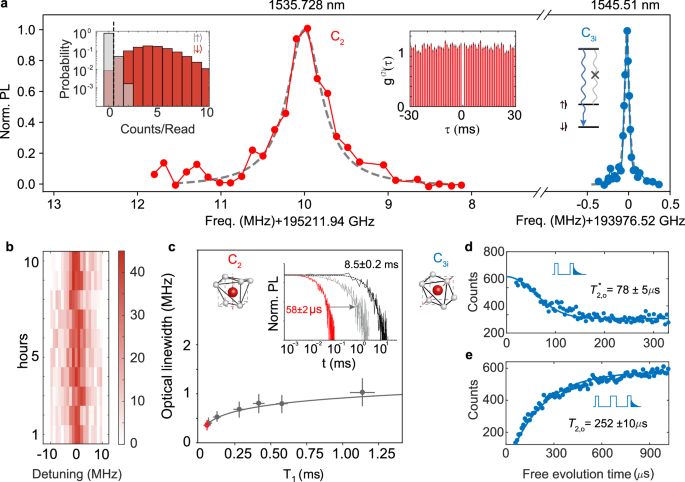
a Narrow photoluminescence excitation spectrum is observed from single Er3+ ions in the C2 (B = 113 mT) and C3i (B = 130 mT) sites of Y2O3. (Right inset) g(2) auto-correlation measurement for an Er3+ ion in the C2 site shows g(2)(0)= 0.025. (Left inset) Histogram of photon counts during a 100-pulse readout for an ion in the C2 site. b Long-term spectral stability of an Er3+ emitter in the C2 site. c Short-term optical spectral diffusion of Er3+ in the C2 site as optical T1 lifetime is tuned. Inset shows the tuning of Purcell enhancement. Grey line indicates the fit to a spectral diffusion model with a dominant logarithmic component. d Optical Ramsey (π/2 − π/2) measurement for an Er3+ ion in the C3i site. e. Optical T2 measured by (π/2 − π − π/2) photon echo for the same ion in (d). Results for additional optical measurements on the single Er3+ ion in the C2 site are presented in the Supplementary Fig. 1 and Supplementary Fig. 2.
Furthermore, a high system photon detection efficiency of 6.4% (3.9%) for the Er3+ emission in the C2 (C3i) sites (SI Section 2.1) enables single-shot optical readout of both qubits. First, we verify that these ions have the desired spin frequencies by screening their optical frequency shifts with B field strength to extract ∣ge − gg∣, and by confirming their ground-state gg factors from spin Rabi oscillations using a microwave drive (Supplementary Fig. 3). The branching ratios and cyclicities of the respective Er3+ optical transitions are measured to be ~480 and > 1000 for the C2 and C3i sub-sites, respectively (SI Section 2.4). At the calibrated spin temperature (SI Section 1.6), both Er3+ spins are thermally initialized to the \(\left\vert \downarrow \right\rangle\) state with near unit spin polarization, and we used optical pumping to initialize the C2 site Er3+ to the \(\left\vert \uparrow \right\rangle\) spin state. For the C3i site Er3+, optical pumping is difficult due to the very high cyclicity. Hence, we used a microwave π pulse to invert the spin to \(\left\vert \uparrow \right\rangle\) for characterizing the readout fidelity. A histogram of photon counts during the readout using 100 optical pulses each with a 0.3 ms-interval for the Er3+ qubit in the C2 site, is shown in the left inset of Fig. 3(a). The average photon number is 6.2 (0.05) for the \(\left\vert \downarrow \right\rangle\) (\(\left\vert \uparrow \right\rangle\)) state. This leads to an average readout fidelity of 97.0 ± 0.5 % using 1 photon threshold. The average readout fidelity for the C3i Er3+ ion is 91.8 ± 0.5 % (Supplementary Fig. 1). The lower fidelity in the latter is primarily due to a faster spin relaxation (T1 = 1.6 s) during the repeated readout pulses for the C3i site.
Probing optical coherence of ions in two symmetry sites within a common lattice elucidates crucial dynamics of optical spectral diffusion. We first focus on the C2 site emitter. For long-term spectral stability, we repeated PLE scans for an Er3+ ion over ≈ 10 hours (Fig. 3(b)). The central peak of the PLE spectrum shows a root-mean-square (rms) variation ≪ 1 MHz, attesting to the absence of a significant long-term drift. Nevertheless, the sub-MHz-wide PLE indicates a broadening mechanism occuring on a much shorter timescale. Typically, three-pulse photon echo technique is used to measure the spectral diffusion dynamics on the time scale of the emitter’s optical lifetime. Here, by taking advantage of in-situ tuning of the Purcell factor (SI Section 2.3), we probe the similar dynamics by sweeping the cavity-emitter detuning to reveal a broadening of the Er3+ PLE linewidth over a millisecond temporal window. Without an applied magnetic field, the PLE linewidth is ≈ 1 MHz. A modest B field (≥110 mT) freezes the magnetic noise, leading to a reduced linewidth of 0.4 MHz, which then noticeably increases as the emitter T1 lifetime is slowed from 58 μs to 1.1 ms (gray data in Fig. 3(c)). This temporal evolution of optical spectral diffusion can be modeled based on frozen paramagnetic spin baths14 plus a fast (≪50 μs) spectral diffusion process by non-magnetic noise (grey curve in Fig. 3(c)) (SI Section 2.5). The latter is likely related to fluctuating electric-dipoles from tunneling two-level-systems (TLS) that are evidenced in separate ESR measurements (SI Section 1.9). We then measured the optical T2,o coherence time of this emitter in the C2 site using a π/2-π-π/2 photon echo sequence, as shown in Supplementary Fig. 2. A single exponential fit gives T2,o = 67 ± 3 μs, corresponding to a homogeneous linewidth of 1/πT2,o = 4.8 ± 0.2 kHz. This linewidth is about two orders of magnitude narrower than the PLE linewidth, indicating that most dephasing is rephased by the echo sequence and providing further evidence for fast fluctuating noise on a short timescale.
Next, we turn to the inversion-symmetric C3i site. With the magnetic field configured as in point d in Fig. 2(b), the excited (ge ≈ 0) and ground state (gg=3.2) g-factors of Er3+ result in a correlated spin and optical coherence that is primarily limited by the magnetic noise. We find that the measured PLE linewidth in the C3i site, while already narrow (71 kHz in Fig. 3(a)), is strongly dependent on the optical Rabi frequency used to excite the ion42, and thus does not inform accurately the intrinsic optical linewidth of the emitter. To obtain the optical coherence, we performed optical Ramsey measurement on the Er3+ ion, using two optical π/2 pulses with an optical Rabi frequency of 2π × 50 kHz (corresponding to a cavity mean photon number of 0.01). The measured \({T}_{2,o}^{*}\) using a stretched exponential fit is 78 ± 5 μs with a stretch factor of 2.1 ± 0.1, leading to a pure optical dephasing rate of 3.2 ± 0.3 kHz after subtracting the radiative rate of 1/2πT1 = 0.83 kHz. This is in good agreement with the magnetic-noise limited spin spectral diffusion linewidth discussed previously (and SI Section 1.7), thus indicating an effective inversion-symmetry protection against fluctuating electric noise, inferring a minimally distorted lattice site. It is worth noting that such a long optical coherence is only observed with a weak Rabi drive frequency. Ramsey measurement with higher (> 2π × 1 MHz) Rabi frequency resulted in diminished optical coherence, indicating instantaneous spectral diffusion or spurious excitation of other lattice defects in the Y2O3 thin film. Additionally, we measured the optical T2,o = 252 ± 10 μs using photon echo sequence and a single exponential fit (Fig. 3(e)). This value approaches the long optical coherence times observed in bulk Er3+:Y2O3 polycrystals at a similar temperature15.
Last, we apply microwave control and optical readout to the C3i Er3+ spin-photon interface. The microwave drive is tuned to the exact spin resonance frequency (5.8 GHz) and the optimal pulse length (Method). Spin T1 was measured to be 1.6 ± 0.1 s using an inversion pulse followed by delayed optical readout. Ramsey sequence measured a \({T}_{2,s}^{*}\) = 102 ± 5 μs with a stretch factor of 2.1, further substantiating the kHz spin linewidth. Spin coherence by Hahn echo, XY8 and CPMG dynamical decoupling sequences are plotted in Fig. 4(c). A Hahn echo T2,s = 0.85 ± 0.5 ms was obtained, which is longer than that in the ESR ensemble measurement in the sample with a higher doping concentration. This improvement of spin coherence is attributed to the significantly reduced spin density, which results in a weaker Er-Er dipolar interaction and a possibly reduced paramagnetic spin bath. An XY8 dynamical decoupling sequence allowed coherence to be extended to 15 ± 1 ms. Meanwhile, CPMG sequence with a fixed π pulse interval of 8 μs led to a coherence time up to 24 ± 1 ms with increasing number of π pulses. Both XY8 and CPMG sequences demonstrate single spin coherence times that are over 10-fold longer than those observed in higher density spin ensembles (Fig. 2(d)). This affirms that Er–Er dipolar interactions are the primary limitation of spin coherence in the previous ensemble measurements, and likely remain so in the measured single spin coherence.
Fig. 4: Er3+ spin qubit coherence in the C3i site.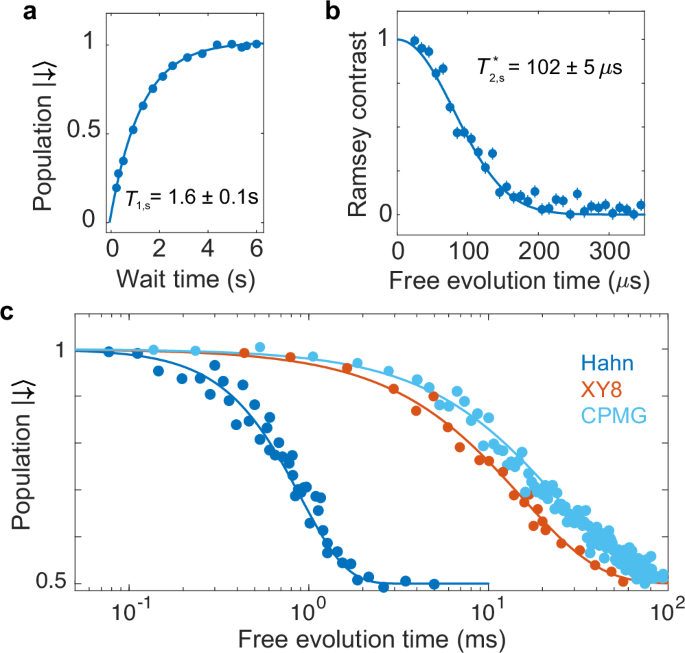
a Spin lifetime measured by a π inversion pulse followed by delayed optical readout. b Spin Ramsey coherence. The fringe contrast is extracted from the normalized readout signal difference when alternating between a 0 and π phase of the second π/2 pulse. A fit to \({{{{\rm{e}}}}}^{-{(t/{T}_{2,s}^{*})}^{n}}\) yields a \({T}_{2,s}^{*}\) = 102 ± 5 μs with n = 2.1 ± 0.1. The error bars represent one standard deviation. c Hahn echo T2,s, XY8 and CPMG dynamically decoupled spin coherence for the Er3+ ion in the C3i site. For the CPMG measurement, the π pulse separation is fixed at 8 μs. The plot shows the CPMG readout with increasing number of refocusing pulses. The applied magnetic field is 130 mT.