
Questionnaire
To assess the psychometric variables associated with problematic gaming, we used the CIAS [7], IGDS [8], and IGTS [10]. The 26-item CIAS has been widely used to evaluate Internet addiction and IGD in an East Asian population [20]. The responses are rated on a 4-point Likert scale with endpoints ranging from 1 (strongly disagree) to 4 (strongly agree). This scale is used to assess five factors of the CIAS: compulsive behavior, withdrawal symptoms, tolerance-related time conditions, health problems, and time management problems. The score for the CIAS was higher than 63, which classified participants as having an Internet addiction [48]. The internal reliability of the CIAS was 0.931 in this study.
The 9-item IGDS is commonly used to assess IGD symptoms [8]. The responses are rated on a dichotomous scale, with the responses being no (0 point) and yes (1 point). The score of the IGDS was higher than 4, categorizing participants as having the IGD. The Cronbach’s α of the IGDS was 0.750 in this study.
The 12-item IGTS is used to evaluate IGD tolerance-related motivators [10]. Scores on the IGTS offer insights into the three factors measured: achievement, inadequacy, and wealth. The responses are rated on a dichotomous scale, with the responses being no (0 point) and yes (1 point). Higher scores on the IGTS indicated greater severity of IGD tolerance symptoms. The internal reliability of the IGTS in this study was 0.591, which falls below the commonly recommended threshold of 0.70 [49]. This reduced reliability may be partly attributable to the dichotomous response format and the limited number of items, both of which can restrict score variability and lower reliability estimates. Although Guttman’s λ6 reached 0.709 for the IGTS, suggesting that the scale may achieve marginally acceptable reliability under optimal conditions, the overall results indicate limited internal consistency. Therefore, findings involving the IGTS should be interpreted with caution, and future research should refine the measurement, for example, by adopting a Likert-type response format and recruiting larger sample sizes.
To evaluate the degree of immersion in online games, we used the Challenge-Skill Scale [50] and the Flow Short Scale [51]. The 2-item Challenge-Skill Scale evaluates a game’s challenge level and a user’s skills. Responses are rated on a 5-point Likert scale with end points ranging from 1 (extremely low) to 5 (extremely high). The 10-item Flow Short Scale is used to evaluate the level of immersion in gaming activities. The responses are rated on a 7-point Likert scale with end points ranging from 1 (not at all) to 7 (very much). Higher scores on the Flow Short Scale indicated a greater flow experienced by gamers.
The emotional responses, gaming experiences, and basic characteristics (age and sex) of the study participants were recorded. A 2-item emotion assessment scale was used to measure emotional valence and arousal. Emotional valence was assessed using a 9-point Likert-type scale with end points ranging from 1 (strongly negative emotion) to 9 (strongly positive emotion), and 5 measured neutral emotion. Emotional arousal was also evaluated using a 9-point Likert-type scale, with end points ranging from 1 (extremely low intensity) to 9 (extremely high intensity).
Participants
Participants were recruited from a university in Hsinchu, Taiwan. To assess IGD symptoms, all participants completed the CIAS and the IGDS. Based on their scores, participants were assigned to one of two groups: those who scored above 63 on the CIAS and above 4 on the IGDS were classified as the IGD group, whereas those who scored 63 or below on the CIAS and 4 or below on the IGDS were categorized as the HC group. Inclusion criteria for both groups included: (1) being between 20 and 40 years of age, and (2) frequent engagement in online multiplayer role-playing games. Exclusion criterion for both groups was having received a diagnosis of a mental disorder within the past 6 months. Informed consent was obtained from all participants.
Physiological signal
Pulse wave signals were measured using a continuous arterial blood pressure monitor (CNAP Monitor 500; CNSystems Medizintechnik, Graz, Austria). Signals were recorded at a sampling rate of 200 Hz by DAQCard (USB 6255, 16-bit resolution, NI, Austin, TX, USA).
Game with two levels
Crazy Racing Kart Rider is an online multiplayer racing game [52]. Gamers play the speed model with seven other gamers or robots and can select the game difficulty level ranging from 1 (very easy) to 5 (very difficult). To investigate the influence of different challenge levels in games on gamers’ psychophysiological responses, three researchers selected levels 2 and 4 of Crazy Racing Kart Rider as the G1 and G2 game stages to stimulate participants, respectively. These researchers were familiar with Crazy Racing Kart Rider.
Experimental procedure
Before the experiment, the participants were instructed to avoid consuming caffeinated foods and drinks to ensure consistent cardiovascular responses at baseline. They also completed the IGTS, ensuring that tolerance-related motivational components were measured independently of in-game experiences. The experimental procedure then comprised four sequential stages: baseline, G1, G2, and recovery. During the baseline of 6 min, the participants gazed at a gray picture with a black circle in the center. During the G1 and G2 stages (each 7 min), the participants played Crazy Racing Kart Rider of levels 2 and 4, respectively. After each game stage, the participants completed three questionnaires—the emotion assessment scale, the Challenge-Skill Scale, and the Flow Short Scale—to assess their psychological responses. Finally, at the recovery stage of 6 min, the participants again gazed at the gray picture with a black circle in the center. The participants’ pulse wave signals were measured during these four stages to evaluate the peripheral autonomic activity.
Signal processing
Pulse wave signal was analyzed using a framework of nonlinear signal processing [30], which included preprocessing, decomposition, transformation, and classification. Figure 3 shows the signal processing.
Fig. 3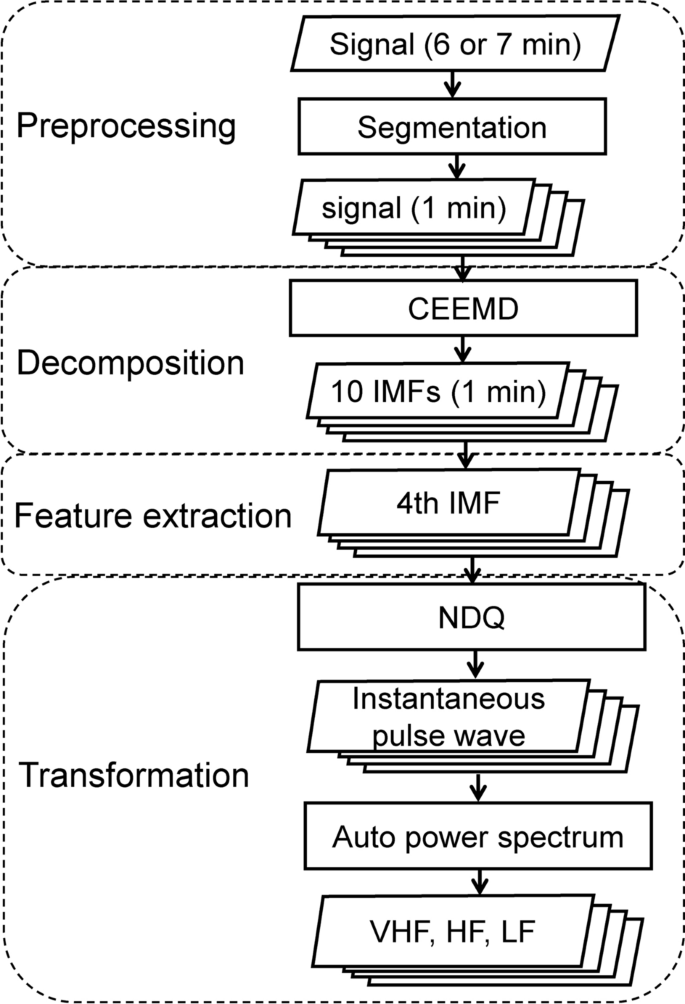
Signal processing. CEEMD, complementary ensemble empirical mode decomposition; IMFs, intrinsic mode functions; NDQ, normalized direct quadrature; HF, high-frequency; LF, low-frequency; VHF, very high-frequency
In the preprocessing step, the 6 min signals recorded during the baseline and recovery stages and the 7 min signals recorded during the G1 and G2 stages were segmented into 1-min signals to observe very short-term peripheral autonomic responses. This choice was based on a prior study that observed HRV during mental stress using electrocardiography signals shorter than 1-min [53], providing both temporal resolution and signal stability. Subsequently, all 1-min signals were downsampled from 200 to 50 Hz to reduce the decomposition time.
In the decomposition step, each signal was decomposed into 10 different fluctuations (intrinsic mode functions; from high to low frequencies) by using the complementary ensemble empirical mode decomposition method [54], which is an adaptive filter method. Next, the pulse rate component was extracted as the fourth intrinsic mode function based on relevant studies [30, 55, 56].
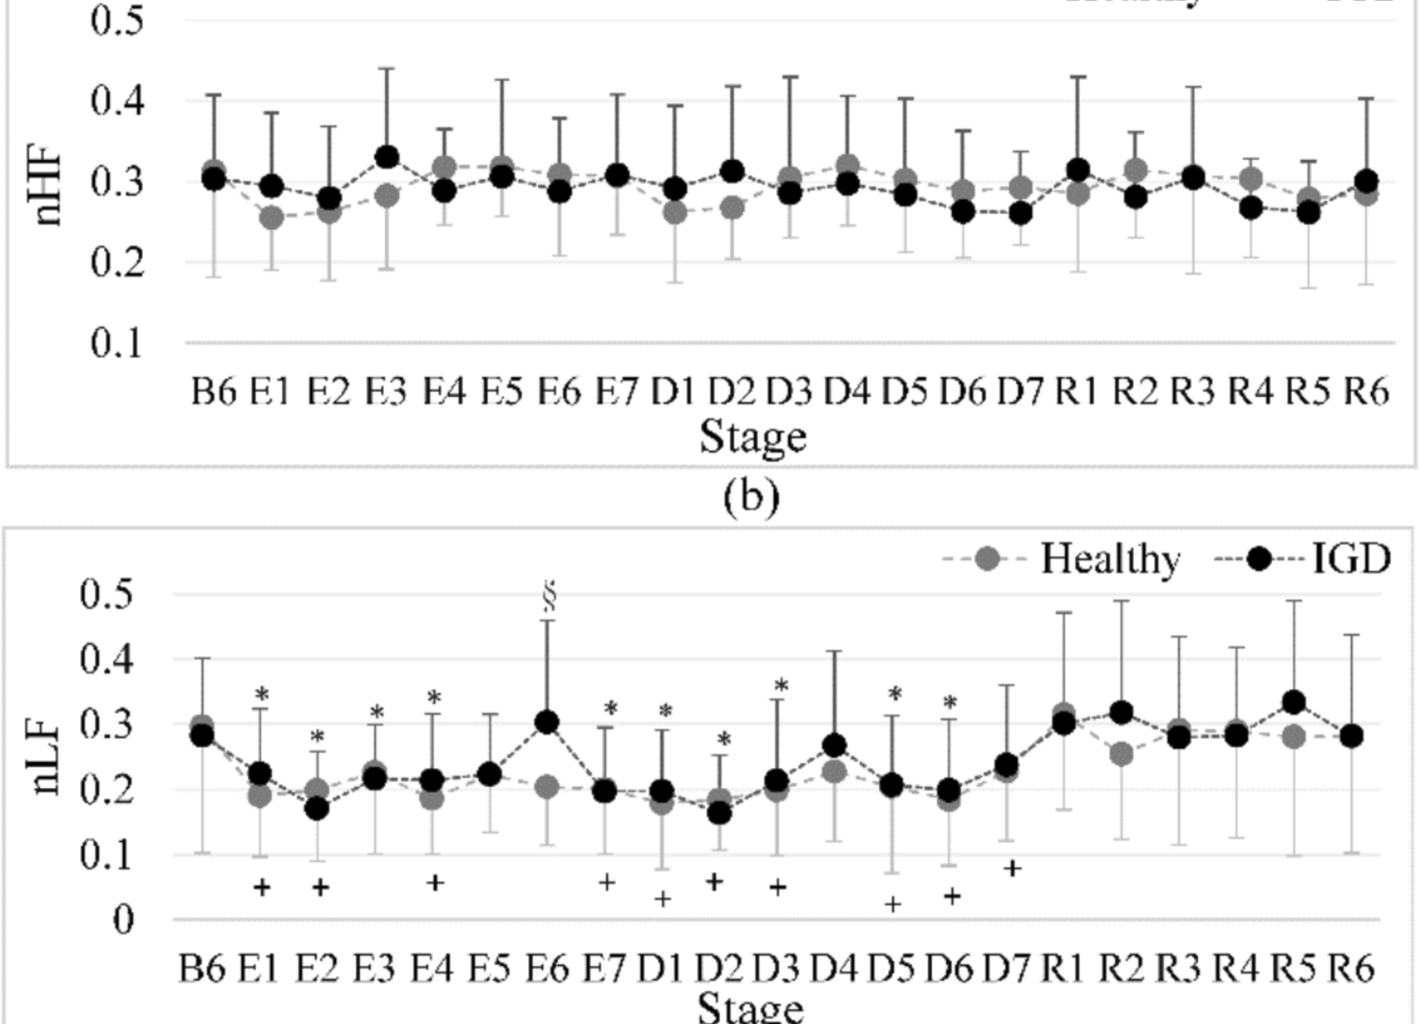
In the transformation step, the fourth intrinsic mode function was transformed into the corresponding instantaneous pulse wave by using the normalized direct quadrature method [57]. From the instantaneous pulse rate, iPRV was calculated using the auto power spectrum method, which involved the power calculation of LF (0.04‒015 Hz; sympathetic and parasympathetic nervous system activities), HF (0.15‒0.4 Hz; parasympathetic nervous system activity) [58], and very HF (VHF, 0.4‒0.9 Hz; peripheral vascular responses and respiration-linked modulation) [55]. The iPRV was used to observe the sympathovagal balance and peripheral autonomic responses during baseline and rest stages [28,29,30]. To minimize intergroup differences, the LF, HF, and VHF were normalized by dividing each by the sum of all bands (LF + HF + VHF), resulting in the nLF, nHF, and nVHF variables, respectively. Signal processing, from preprocessing to transformation steps, was conducted using LabVIEW software (version 2021, National Instruments, Austin, TX, USA).
Statistical analysis
A mixed-design repeated-measures ANOVA was conducted with group (HC and IGD) as the between-subjects factor and stage (the sixth minute of the baseline, seven G1 intervals, seven G2 intervals, and six recovery intervals) as the within-subjects factor to examine changes in iPRV over time. Given the small sample size and potential deviations from normality, the Mann–Whitney U (MWU) test was used to analyze the intergroup differences in questionnaire scores and iPRV. The association between IGD risk and tolerance-related motivational components was investigated using the chi-square test. The Wilcoxon signed-rank test was used to conduct intragroup comparisons of questionnaire scores and iPRV at the baseline stage and after exposure to game stimuli; at the baseline and recovery stages. The correlations between the scores on the different questionnaires were investigated through Spearman correlation analysis. In addition, the correlations between the questionnaire scores (CIAS, CIAS factors, IGDS, IGTS, and IGTS components) and iPRV during each 1-min period were also evaluated using Spearman correlation analysis. All statistical analyses were performed using SPSS (version 22; IBM Corporation, Armonk, NY, USA) and used a two-tailed and alpha level of 0.05.