
As Britain’s coastlines face growing pressure from heavier rainfall, rising sea levels and increasingly dynamic shorelines, Ordnance Survey’s new continuous tidelines dataset offers a timely tool for understanding where land meets sea – and how that boundary is changing. By providing a consistent, up-to-date view of the coastline, the dataset has the potential to support more informed approaches to managing coastal erosion and flood risk across Great Britain.
Earlier this year, the Environment Agency updated its national flood risk assessment (NaFRA), incorporating climate-related changes in flood risk for the first time. The assessment highlighted that a substantial share of homes and businesses in England are already located in areas vulnerable to flooding, with that exposure expected to increase over the coming decades. Alongside this, updated national coastal erosion risk mapping indicates that thousands of properties could be affected by coastal change within a single generation.
Accurate coastal change monitoring
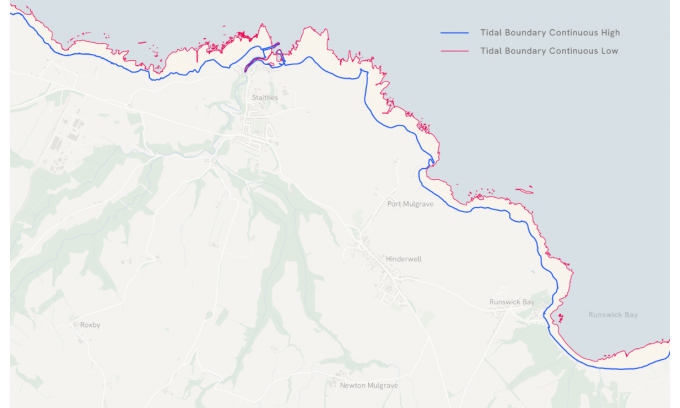
The current OS National Geographic Database (OS NGD) Tidal Boundary line features have been automatically aggregated with the source features dissolved into continuous lines which form two new feature types within OS NGD Water – Tidal Boundary Continuous High and Tidal Boundary Continuous Low. The new dataset can also be used as overlay layers in the Tiles API, offering a clean, intuitive visual experience. They complement the NGD base layer and provide added value for contextual mapping and macro analysis.
The dataset will support environmental monitoring & regulation including:
Coastal erosion modelling – to understand impacts on people, property and infrastructure, enabling better risk management and strategic planning;
Coastal flooding modelling – to enhance preparedness and response;
Updating boundary features – to align with coastal change, enabling accurate and effective environmental monitoring and regulation, and better management of natural resources;
Climate change assessments – to identify and evaluate the impact of climate change, enabling informed decision-making and effective adaptation strategies; and
Understanding the foreshore – to identify areas that provide natural flooding defences, essential for implementing flood risk management.
William Russell, senior coastal process scientist at the Wales Coastal Monitoring Centre, welcomed the new dataset. He said: “One of our core values is ‘data, not opinions’. When information is missing, we seek out or collect the data needed to support sound decision-making. The OS Continuous Tidal Boundaries dataset is a great example: it removes uncertainty from our strategic monitoring programme and gives us clearer insight into intertidal extents, delivering cost savings and efficiencies for our survey contractors.”
The new tidelines data is a valuable asset for those customers in environmental policy and regulation, and supporting evidence-based decisions relating to water discharge for example, whether from a regulatory or flooding perspective. Understanding where tidelines are helps in defining the intertidal zone, which provides a natural line of defence against coastal erosion and flooding. This in turn provides essential protection for coastal communities and ecosystems. Intertidal data has also been enhanced in the Land feature of the OS NGD. Adding data around obscured areas delivers a more complete and accurate coastal dataset across GB.
Changing size of riverbanks
Lily Brown, product manager at Ordnance Survey, said: “The digital master map of Britain – the OS National Geographic Database – contains trusted, accurate features that support a wide range of public and private sectors, from climate resilience and infrastructure planning to coastal management. This wealth of data delivers critical insights and by incorporating authoritative tideline data, we are enabling evidence-based decisions which will protect and monitor the nation’s evolving coastlines.”
Following the release of the continuous tidelines dataset, OS has ranked all ceremonial counties in GB by their percentage change in size between high and low tide. Merseyside comes out top, much higher than the others, with a nearly 17% difference in high and low tidelines. Orkney has the second highest difference of 7%. Interestingly, counties considered to be landlocked, like Nottinghamshire and South Yorkshire, have rivers which are tidal for a long way upstream (the Trent and the Don respectively), so the changing size of the riverbanks causes a significant change in the size of the counties.
The new datasets can also be overlaid with other information to enable essential location-based insights. Combining the tidelines data with UPRNs in ceremonial counties shows that Greater London has by far the highest number of commercial and residential properties within 15 metres of high tides – around 5,500. Cornwall ranks second, with just over 3,000 properties, followed by Devon with 2,400. [See table below]
The new location data has been released as part of the Public Sector Geospatial Agreement (PSGA). The PSGA is a contract between Government Digital Service, managed on behalf of the UK Government, and OS for the provision of geospatial data and services to the emergency services and wider public sector organisations.
To access all of OS’s location data visit the OS Data Hub – which provides access to the data through both APIs and downloads.
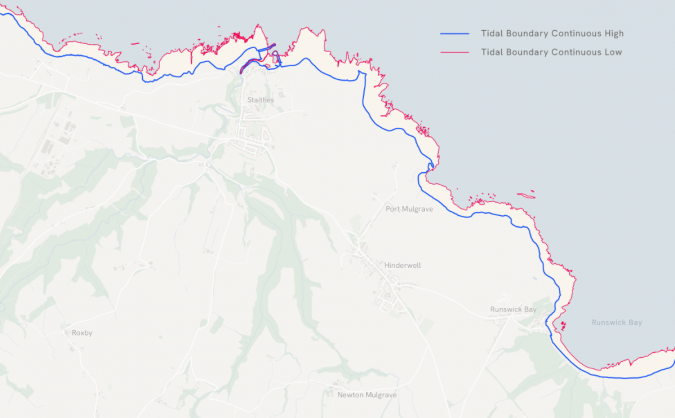
Continuous high (blue) and low (red) tidal boundaries derived from Ordnance Survey data, illustrating shoreline variability along the North Yorkshire coast. (Image courtesy: Ordnance Survey)