
 Was buying a home always as difficult as it is today? The data indicates things are ‘significantly worse’ than they once were. (Source: Newswire/Getty)
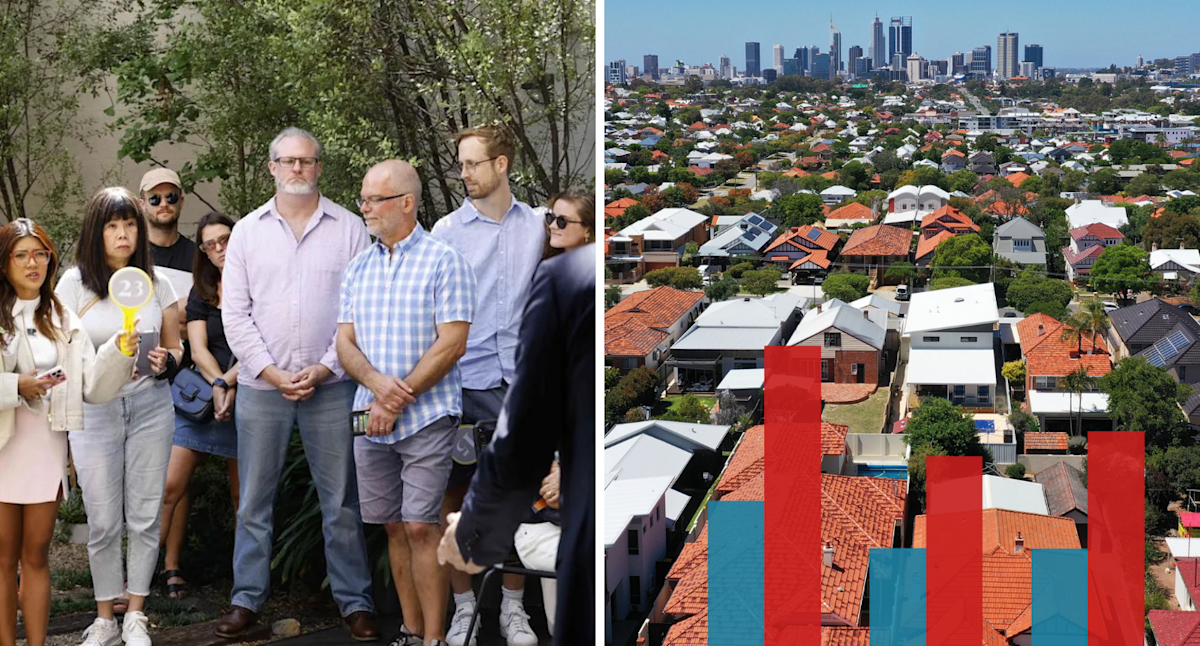
In the debate surrounding housing and, in particular, housing affordability taking place around BBQ’s and parliaments alike, there is a common thread, the idea that it was always hard to buy a home.
This is something that often divides Australians by their generation and their locale, as inflation and the evolution of property markets over time can make finding a common point of comparison challenging at a glance.
It’s certainly true that in days gone by, putting together a 20 per cent deposit and servicing a loan could be a deeply challenging task, but was it always as difficult as it is today? Particularly in regional areas?
RELATED
Today, we will seek to provide some snapshots by which the challenge of buying a home over the last 26 years can be quantified.
Our story begins 26 years ago at the conclusion of the 20th century.
While 1999 marked the end of the second millennium, for Australians, it represented something else, something significantly more important in our day-to-day lives, the conclusion of what could be considered broad-based, affordable housing.
According to an analysis from research firm PropTrack, at this time, a median earning household could afford to purchase 57 per cent of homes nationally and service that mortgage with 30 per cent of their gross income, assuming they had the funds for a 20 per cent deposit.
At the lower end of things, a household with an income at the 30th percentile (earning less than 70 per cent of households) could afford to purchase 24 per cent of homes nationally.
Today, a median earning household can afford just 15 per cent of homes nationally, with our household in the 30th percentile by income being able to afford just 3 per cent of homes.
The share of homes a household with a median income can afford has dropped to just 15 per cent. (Source: Tarric Brooker)
Like the PropTrack analysis, we will be assuming that a household has a 20 per cent deposit, funds for the required transaction costs and is paying the prevailing payable mortgage rate.
In terms of income, the assumption is that a household is earning 1.25 times the median full-time earnings for each locale.
In 1999, the largest mortgage burden was held by Sydney, where a mortgage on the median house consumed 37.2 per cent of our hypothetical household’s income.
At the other end of the spectrum are Adelaide and Perth, where a mortgage on a median house consumed 19.6 per cent and 20.2 per cent of the household’s income, respectively.
Story Continues
Heres’ a snapshot of capital city housing affordability in 1999. (Source: Tarric Brooker)
Fast forward to the present day, Sydney still commands a large premium, with a mortgage on a median-priced house consuming 76.1 per cent of household income.
At the other end of the spectrum, the cheapest major capital city market by a fair margin is Perth, with servicing a mortgage in this scenario consuming 42.3 per cent of household income.
Here’s a comparison of capital city housing affordability in 1999 versus 2025. (Source: Tarric Brooker)
It’s worth noting that what is today the nation’s cheapest capital, Perth, has a significantly larger mortgage burden than the most expensive capital, Sydney, did back in 1999.
While broad-based housing affordability at the median for the nation’s capital cities faded away quite a while ago, in regional areas it remained until relatively recently in the grand scheme of things.
According to data from Cotality (formerly known as Corelogic), the best affordability in regional Australia in the past 19 years (excluding the period of the 2020 lockdowns) was immediately prior to the pandemic.
At that point, servicing a mortgage on a median dwelling in regional Australia across the various states consumed an average of 21.2 per cent of median household income in those areas.
The most expensive state was regional New South Wales, where it consumed 27.9 per cent of household income.
At the other end of the spectrum, the cheapest was regional Western Australia, consuming 15.4 per cent of household income.
Today, things could scarcely be more different, with the median home in regional Australia now more expensive relative to mortgage serviceability than Sydney was prior to the pandemic.
In terms of the most expensive market, the median home in regional NSW now consumes 49.6 per cent of household income.
The least expensive state is Western Australia, where a home in the regions consumes 35.0 per cent of household income.
And regional housing affordability in 2019 vs 2025. (Source: Tarric Brooker)
While buying a home has always been one of the most difficult tasks most Australians will undertake in their lives, in relative terms, it has become significantly more challenging in the last quarter of a century.
Where once there was broad-based affordability, if only for a time, there is now a set of circumstances where the bottom 50 per cent of households are theoretically competing for just 15 per cent of homes.
The last 25 years have also delivered inherently higher household incomes due to higher levels of female workforce participation and greater levels of households having two full-time wage earners.
Yet despite households working that much more hours, they are significantly worse off than where they were when the world was partying like it was 1999.
It is said that the first step in solving a major issue is admitting you have a problem to begin with.
And if the nation’s housing affordability issues are to be solved, a defining majority of Australians need to admit we have a problem.
Get the latest Yahoo Finance news – follow us on Facebook, LinkedIn and Instagram.