

As the slug line suggests, we’ll be talking walks in this one. From a thousand-foot view, walks have not become especially more or less common in MLB to the degree that other outcomes such as home runs and flyballs have over the past couple of decades. The league-average walk rate was just under 10% at the turn of the century before hanging out between 8.5% and 9% for most of the 2000s. In the early-mid-2010s, free passes became slightly more scarce before rebounding to that 8.5% neighborhood as three-true-outcomes baseball took center stage, still sitting comfortably there in the mid-2020s.
From the highest single-season average walk rate in 2000 (9.6%) to the lowest in 2014 (7.6%), there hasn’t been a dramatic change over this quarter-century. A 2% fluctuation is rather meaningful when we’re talking about the entire league, but there have certainly been more prominent alterations to the way hitting has been taught during that timespan.
To walk on a regular basis, a hitter must not chase all that often. Right? Right! Kind of.
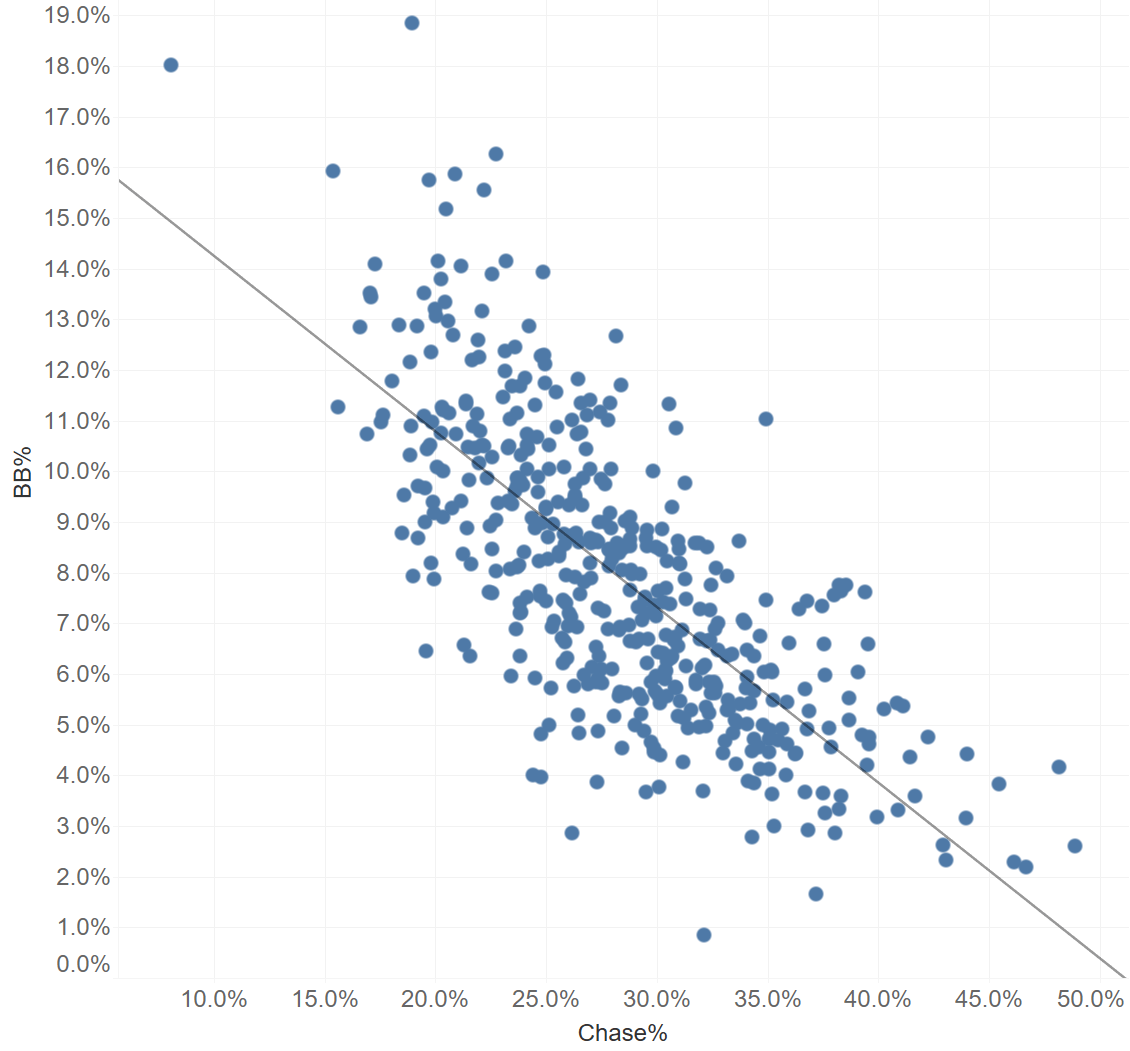
BB% and Chase%, 2025 (every MLB hitter with at least 100 PA)
In 2025, the R^2 value between BB% and chase% at the hitter level (min. 100 PA) was 0.54. That is, roughly 54% of the variance in BB% could be explained by chase%. There’s definitely a relationship there, but while I’m not sure exactly what I should’ve expected the R^2 to be, I thought it’d be higher. There are more hitters who don’t chase and don’t walk relative to the rest of the league, just as there are more hitters who do chase and still manage to frequently walk, than logic might dictate.
That second point especially warrants further explanation. How can a hitter walk a lot while chasing a lot? Longtime Pitcher List readers have probably clued in by now that this question is based on the Westburg Paradox, proposed by former PL writer Tanner McGrath two years ago in one of my all-time favorite pieces I’ve ever read on this site. The gist of it is parallel to what I’ll be investigating here, except it deals with hitters who maintain a low strikeout rate despite frequently swinging and missing, such as Orioles infielder Jordan Westburg. I’m not going to spoil Tanner’s findings here, but he did find a handful of very acute and repeatable skills associated with maintaining higher-than-average strikeout and whiff rates, and wouldn’t you know it: The same applies to the chase-walk conundrum. So, which players manage both high walk rates and high chase rates? How do they do it? How could they continue to do it in the future?
The Namesake
Bryce Harper’s Walk and Chase Rates, 2024-25
This whole phenomenon is named after Bryce Harper, and all you need to know about why is within the table above. In each of the past two seasons, he has posted a walk rate 2.5-3% above league average and a chase rate 4-6.5% above average. What gives?
In 2025, he saw, by a long shot, a lower rate of pitches in the strike zone than any other with at least 200 plate appearances. That is an ingredient crucial to being able to walk a line like this. A mid-30s chase rate isn’t as detrimental to a hitter if they see an inflated amount of non-competitive pitches to begin with. Harper gets pitched like this because he’s one of the most feared left-handed sluggers in baseball: Opponents would rather walk him than give him anything near the zone once he takes control of the count. Sometimes, they don’t even think about it, which is why he once went 0-0 with 6 walks and a hit-by-pitch during a game. Seriously! This is all for good reason. He’s a perennial 30-homer guy when healthy, and, when considered alongside how aggressive he is when he does get good pitches to hit, his relative lack of discipline outside the zone actually seems perfectly appropriate. Are there other Harper Paradoxers that also have a low zone rate, thereby leading to less detrimental chases and more room for a high walk rate?
Harper Paradox & Zone%, 2025
You bet there are. These five players all have, to varying extents, one thing in common: Raw power that pitchers are rightfully intimidated by. Naturally, Harper boasts the most extreme high-walk, high-chase combination of the group, but Raleigh has been an obvious runner-up to that title for the past two years, and for similar reasons. Nobody wants to give him anything to hit because he can pull, lift, and barrel from both sides of the plate, so he can be aggressive while still taking his fair share of free passes.
Anthony Santander clubbed 44 homers the year before last but has never had a single-season OBP higher than .318 and chases on the regular; pitchers, therefore, have little incentive to challenge him. Jasson Domínguez displayed merely half-decent game power in his first extended go-around in New York, but his reputation precedes him – he was talented enough to be given the nickname “The Martian” as a teenager. No reason for pitchers to tempt fate with him either. And then there’s Cruz, who can hit a ball harder than literally anyone but has non-competitive bat-to-ball skills. Throwing him something he can drive may as well be an occupational hazard.
A lower proportion of hittable pitches is a consistent thread with the most notable individual exceptions to the intuitive chase-goes-down, walks-go-up rule. It’s the most logical explanation we have so far, but if you plot chase rate and walk rate by hitter in 2025, you’ll see that it doesn’t address all the discrepancies by itself. Let’s see what else stands out.
Swing Decisions
When looking at the 2025 leaderboards for Decision Value, Pitcher List’s in-house metric for evaluating hitters’ swing decisions, I noticed that all five of the hitters in the above table received below-average grades from the model. Are there any counterintuitive patterns that come to the surface if we slice and dice their swing rates into contextual buckets, such as count states?
Harper Paradox & Swing Decisions, 2025