
This week we have yet another post on the Eye Test where I’m taking inspiration from some incredibly smart analytics people in other sports asking the right questions.
Late last year I saw a tremendous visual from Todd Whitehead of Sportradar detailing what happens before a shot in the NBA. It showed some clear insights like taking more passes to create a corner three point shot, or that mid-range shots were more likely to be taken off the dribble.
In his book, the Midrange Theory, Seth Partnow reminds us that “the map is not the territory”. Shot charts are abstractions of how a play ended, but they don’t tell the full story. Here’s what tends to happen *before* a shot, for shots made in different regions of the court. pic.twitter.com/vmegScOvSG
— Todd Whitehead (@CrumpledJumper) December 17, 2025
I’ve tried to apply the above to rugby league, looking at the metrics of what happens before a try. Knights fans might want to read this very thoroughly, as their team was apparently unaware that you are awarded four points for crossing the goal line with the ball in your possession.
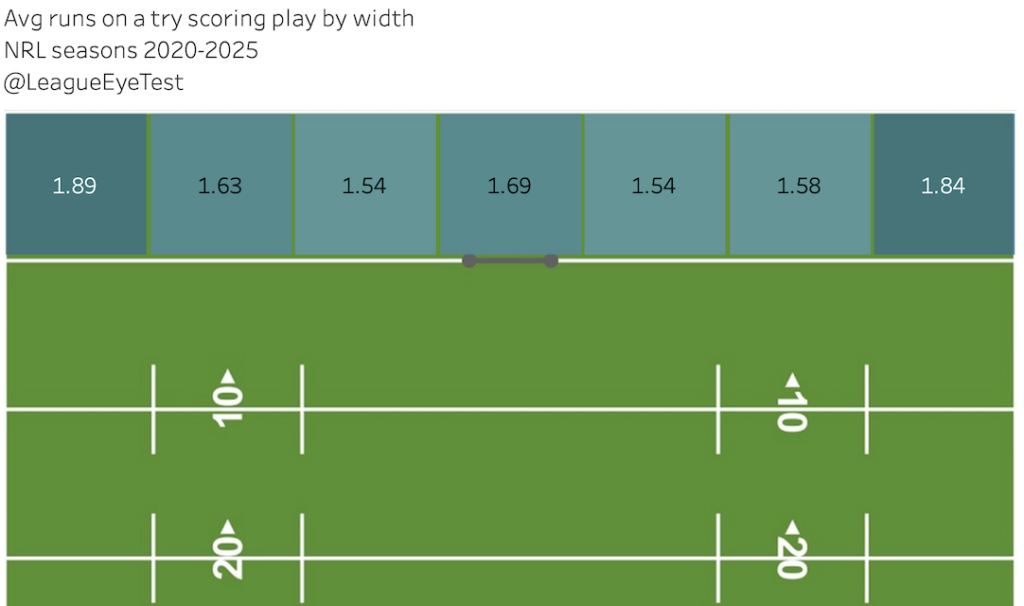
Now we don’t have the fantastic player tracking that the NBA has, but there are some things I can do with the data I do have available. And unlike basketball, we don’t have one single scoring zone measuring 46 centimetres in diameter. What we do have in our sport is a try line that spans 68 metres in width and up 11 metres in depth. Therefore, to provide some granularity for analysis, I’ve split up the attacking in goal area into seven equal channels of just under 10 metres – Right/Left wings, Right/Left edge, Right/Left middle and Centre of the field.
The end result is basically a 10m x 10m box on the field where a try is scored. As for what happens before a try, I’m looking at a number of metrics that occurred during the try scoring play. The average number of runs, passes, tackle breaks, line breaks, line engagements, offloads, support/decoy runs receipts/possessions, as well as how far away from the try line the play started. I’m also going to check the % of tries that included a kick and the % that included a line break before the try line.
The latter is a key indicator for me, as almost every try not from a kick is given a line break when a player crosses the line. It’s not a traditional line break, and if anything should be tracked differently (such as a goal line break?). What I’m trying to understand, purely from a data perspective, is what teams are doing with the ball on the lead up to crossing the line.
Thank you for reading The Rugby League Eye Test. Subscribe below to receive new posts in your inbox
Obviously, video analysis here is the still a key aspect, but I am interested to find out if there’s any numerical trends that might indicate a trend that isn’t immediately clear. This will let us see what (if any) differences there are in the lead up to a try depending on where it is scored, and are they different from what you’d expect?
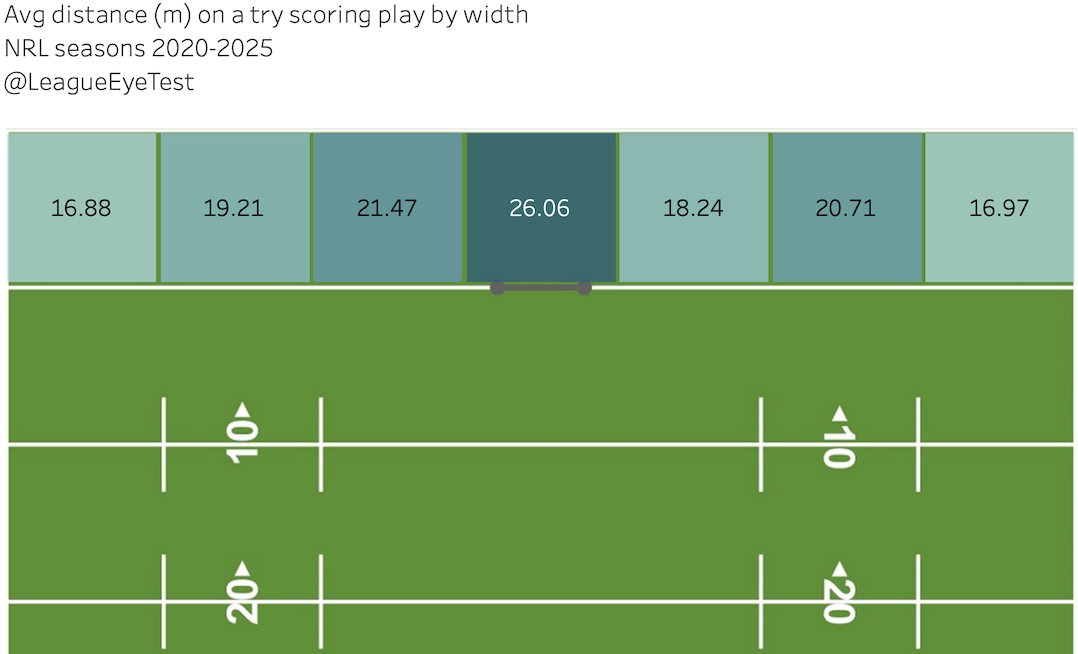
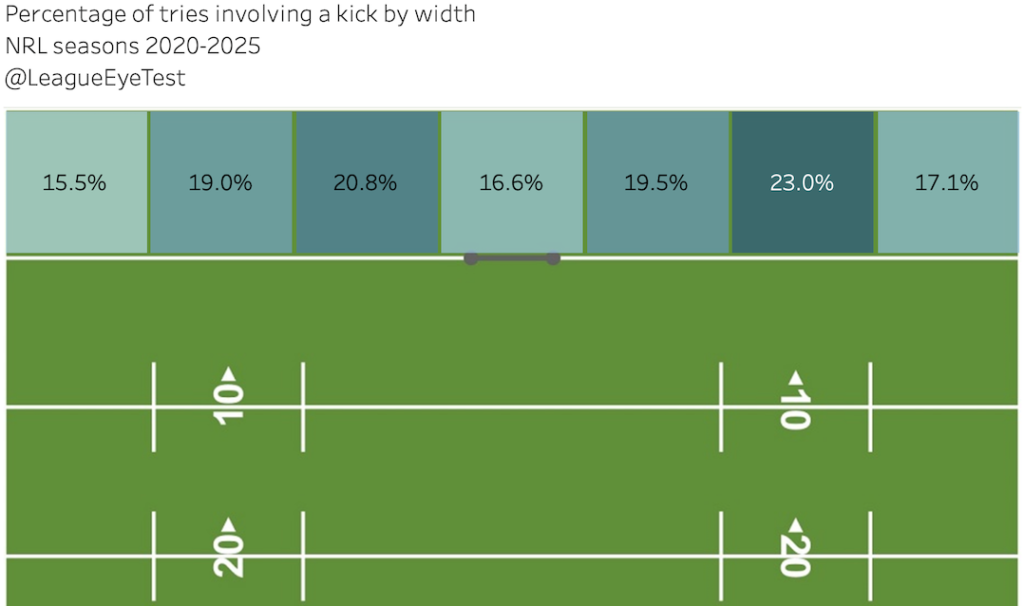
So, what can we tell from these numbers? Let’s start with tries with a kick during the scoring possession. As noted above, the squares on this chart represent a 10m x 10m square where the try was scored, and the shade of blue of the square gets darker as the number gets higher.
The percentage of tries with a kick involved on the final play is higher on the edges than the wings, only 15% on the left wing and 17% on the right, with the right edge the highest at 23.0%.
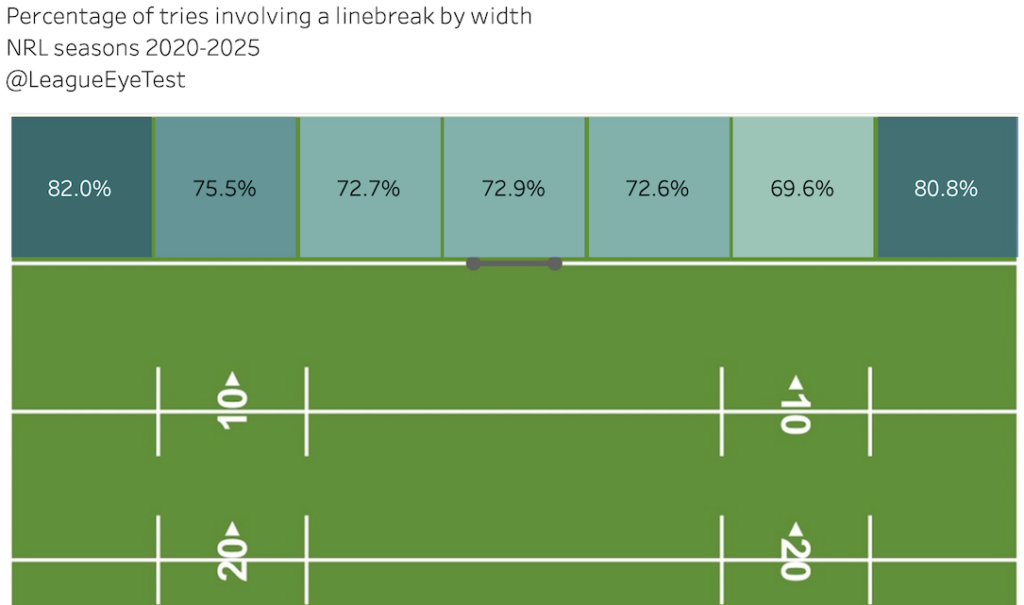
And as you’d expect, the percentage of tries involving a line break has the inverse relationship – a lower percentage in the middle but 80% or higher on the wings.
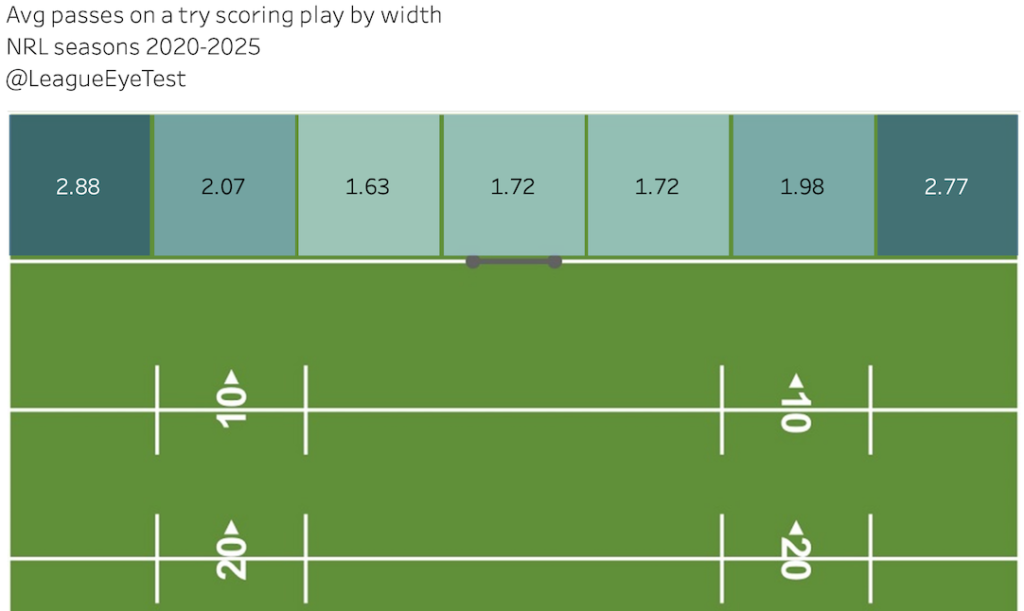
Similarly, the average number of passes, receipts and runs increases as the distance from the middle of the field also increases, although at a greater rate for passing than running.
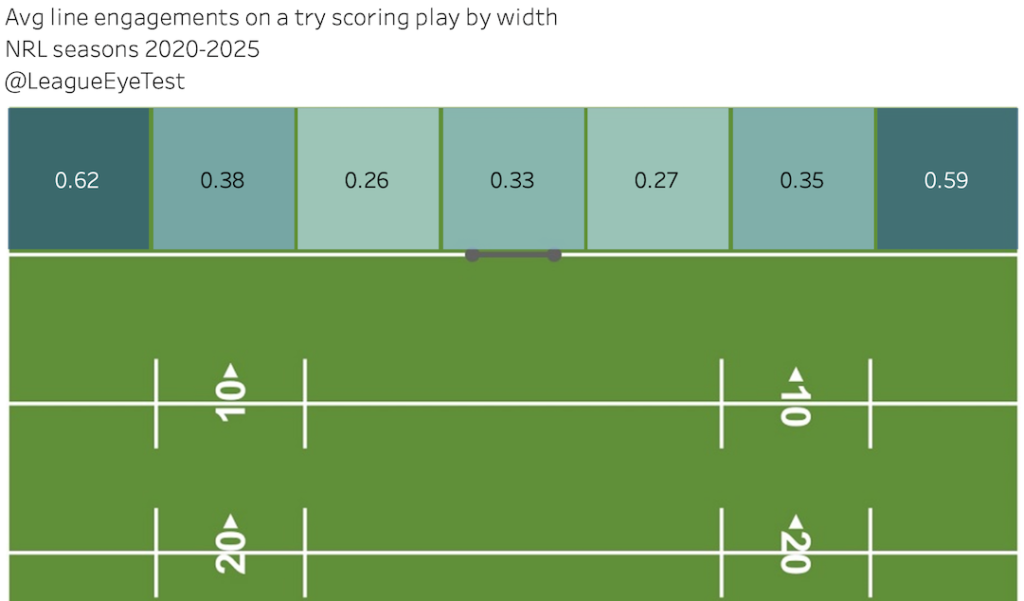
Line engaged runs also increases which makes perfect sense as you can’t create space on the edges without taking on the defensive line first and enticing them out of position.
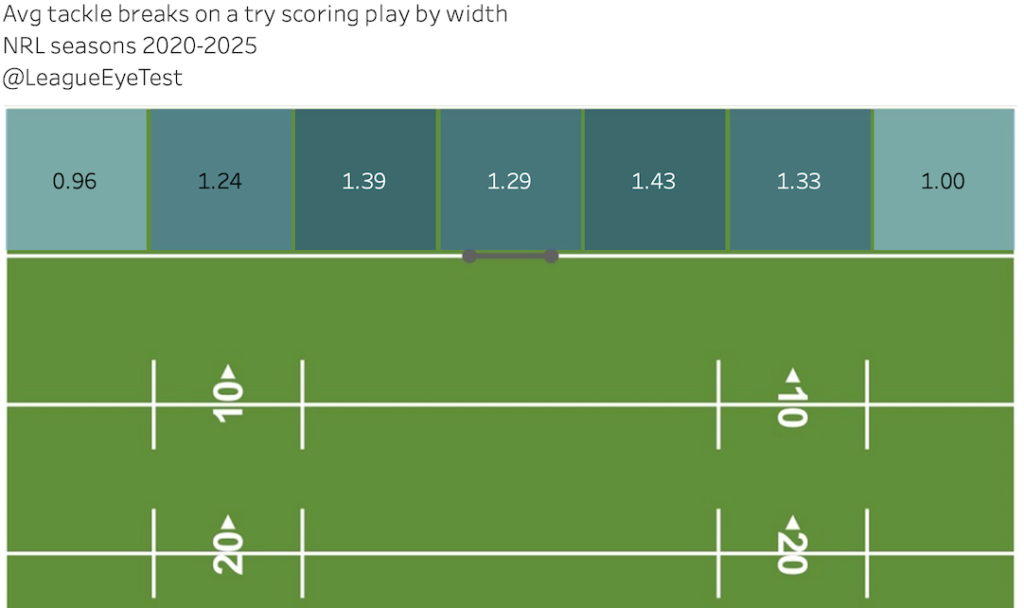
All these extra passes and runs are occurring with the intention of putting a player across the line. And as the ball is scored wider, the number of tackle breaks prior to a try drops as well. This would indicate that players are put into space out wide rather than breaking through the line, which would pass everyone’s eye tests.
The distance from the line the play starts also has a clear relationship with width. Tries in the middle of the field actually start from further out – over 26 metres – whilst those on the wings start almost 10 metres closer to the line at a shade under 17.

Keep in mind the distance to the try line is from the start of the play, so those from longer distances are likely clean breaks that can be easily put down between the posts, so I’d take that middle number with a grain of salt.
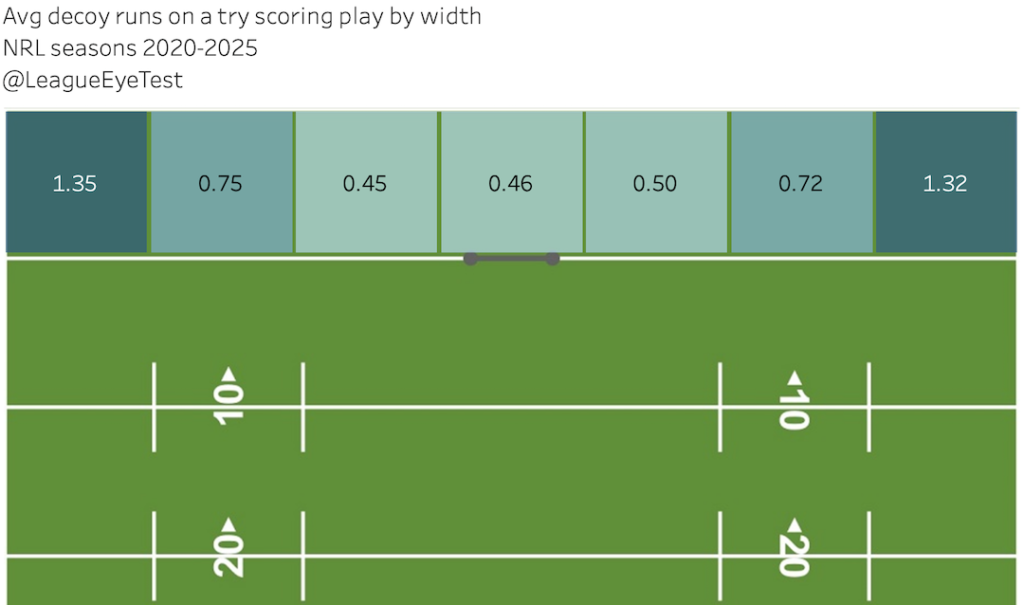
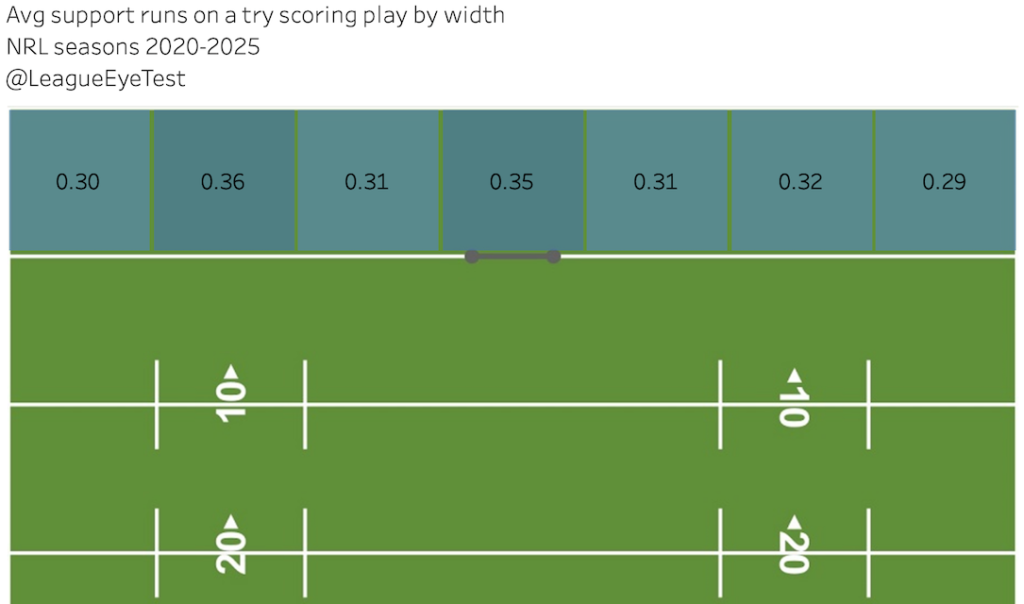
Decoy runs increase the wider the play finishes, but support runs do not.
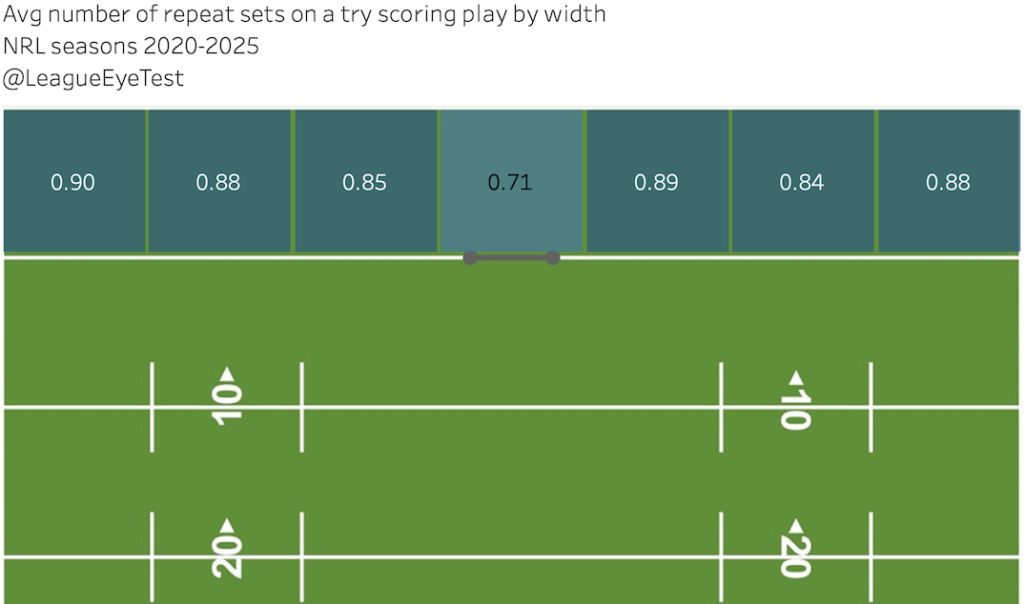
The last thing that has a relationship with width is the average number of repeat sets. 0.7 repeat sets are needed for a try in the middle of the field, which increases to over 0.8 on the edges and 0.9 repeat sets on the wings.
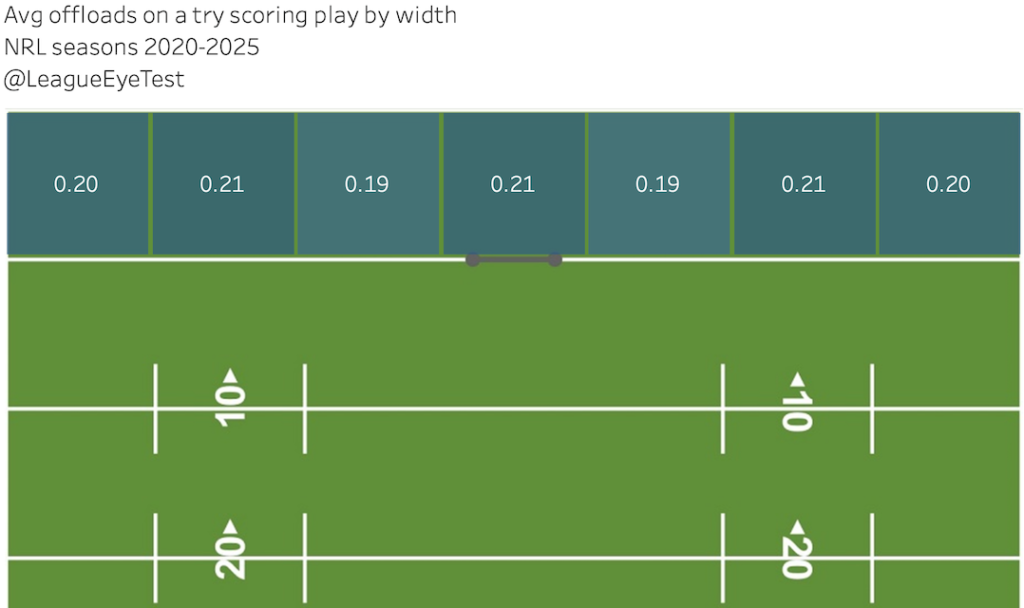
There’s a few metrics that don’t change with the width of a try. Offloads, for example, are pretty consistent across the field at approximately 0.2 per try.
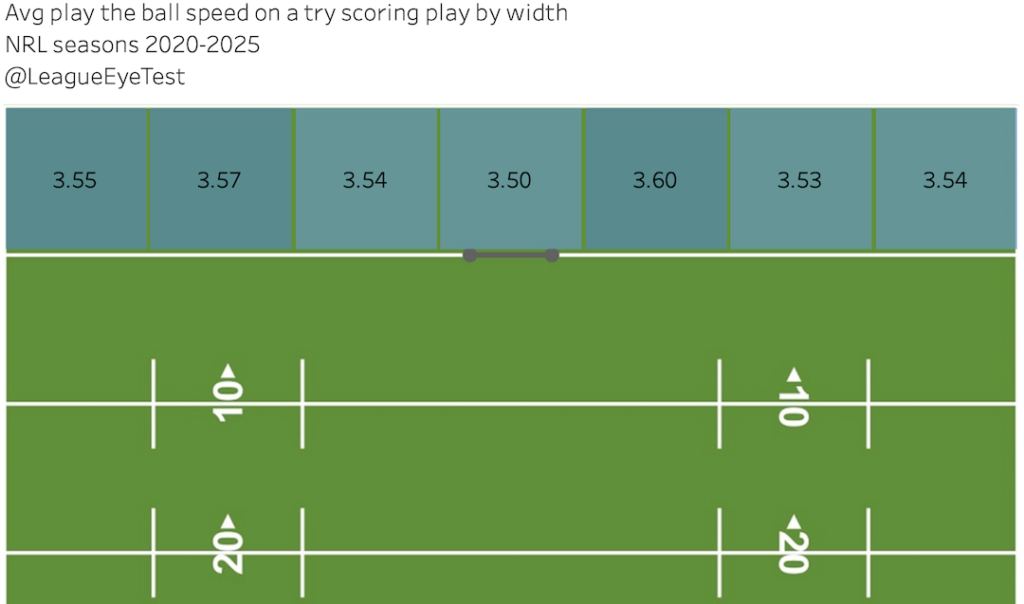
Play the ball speed, something routinely touted as meaningful is steady and somewhat slow across the board. Regular Eye Test readers will know that I don’t consider it a useful measure already, especially as you aggregate each instance.
Average tackle number ranges from 3.8 to 3.9 range with notable exception. As a try is scored closer to the middle of the field, the tackle number declines, from 3.92 on either wing to 3.7 in the middle.
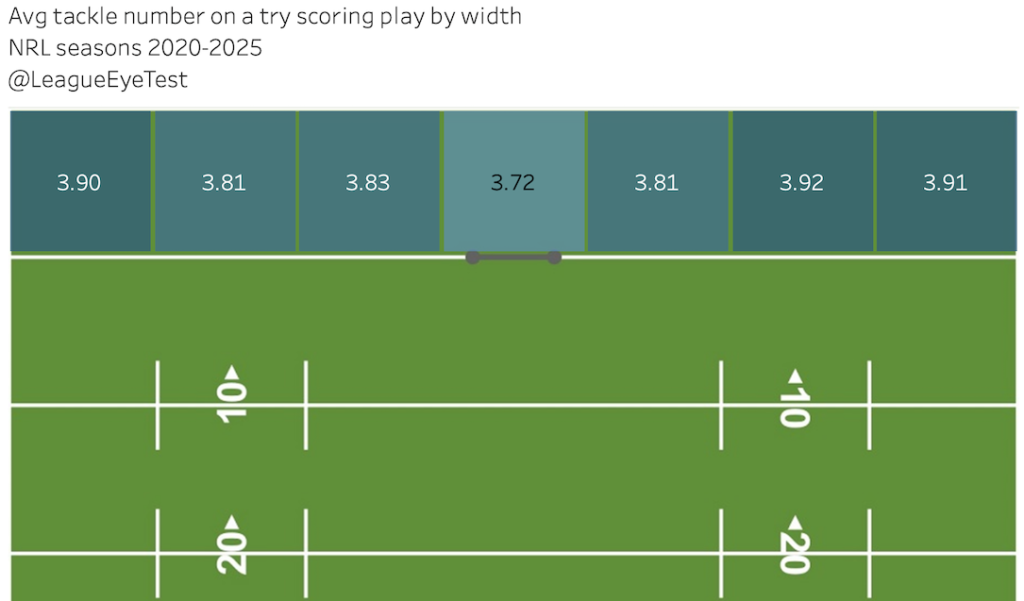
All of these numbers have stayed mostly steady across seasons since 2020. There have been slightly more passes (and in turn slightly more receipts), but also slightly shorter distances of the play the ball to the line.
Thus far, we’ve focused on the aggregate numbers here, and it’s mostly telling is what we’d expect to see. The art of being less wrong in effect again.
What if we split these down by team and opponent though? Is there something hidden here that’s being masked by the aggregation?
It turns out there’s a lot more variation across teams by these numbers and some clear indications of how these teams are attacking, and to finish this post I’m going to delve into some team specific charts. One thing to note is that I’m not going to split them into scoring zones here for two reasons.
The first is that for smaller time periods at a team level, the try scoring zones can have very low numbers that aren’t statistically significant. Aggregated at a season level is fine, but team specific by zone and season can be treading into misleading numbers. And the second is that for the zones that are statistically significant enough, I don’t want to give everything away for free at once.
To keep things relevant, I’m just looking at 2024 and the half of 2025 season, and first up is the percentage of tries scored that involved a kick.
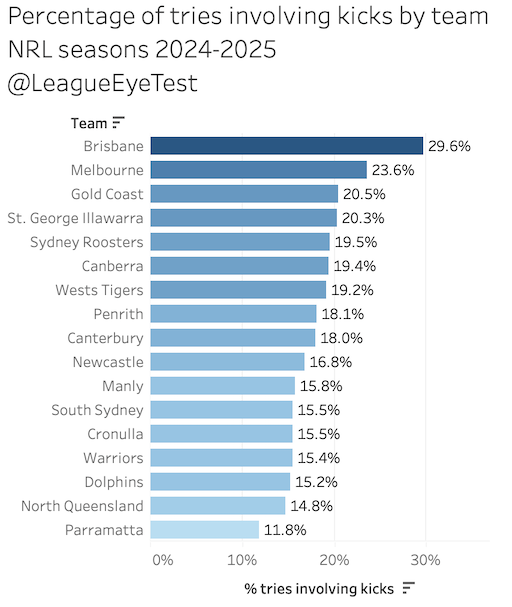
Brisbane and Melbourne lead the way at 30% and 24% respectively, both ahead of 21% for the Titans. The Cowboys and Eels are scoring tries involving kicks at half the rate of the Storm since of 2024.
Line breaks per try is somewhat flipped here, with the Eels last at 0.84 line breaks per try, ahead of the Warriors (0.81) and the Rabbitohs (also 0.81).
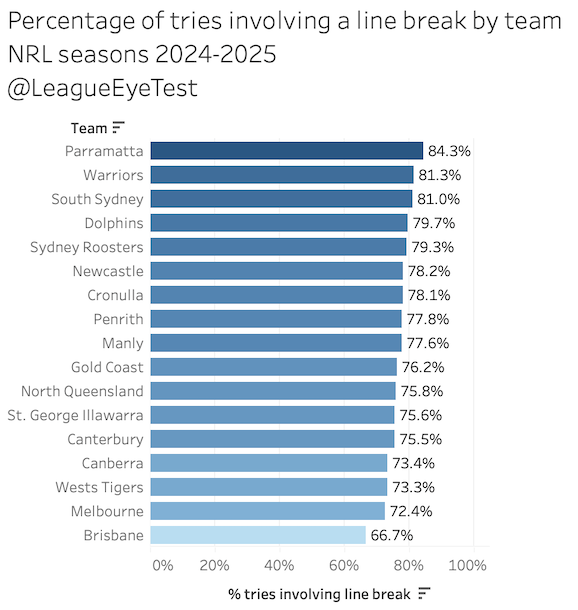
Brisbane and Melbourne rank 17th and 16th respectively at 67% and 72% which is influenced by the volume of kicking they do on their try scoring possessions as we noted above.
The Storm also rank last for line engagements per try scoring play, at just 0.34, slightly ahead of the Raiders (0.36) and Warriors (0.37).
Whilst the Storm ranked highly for kicking attempts, which affected their running and line engagements, neither the Raiders nor Warriors attempted a lot of kicks when they scored. Their low line engagement indicates they’re trying to create space almost by brute force, rather than by confusing defenders and creating space for them.
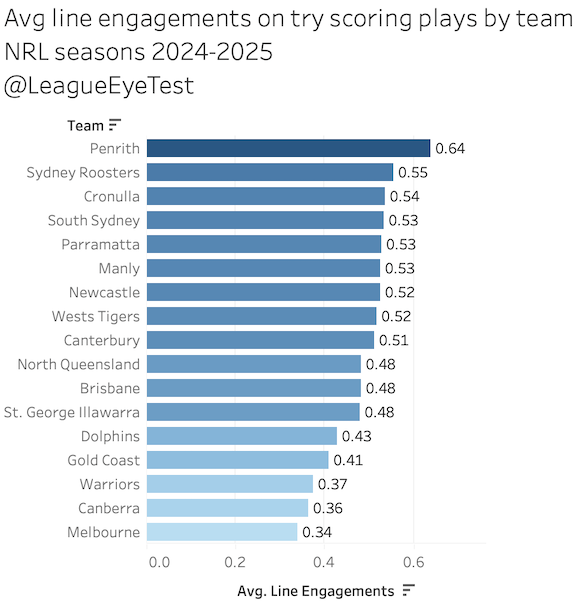
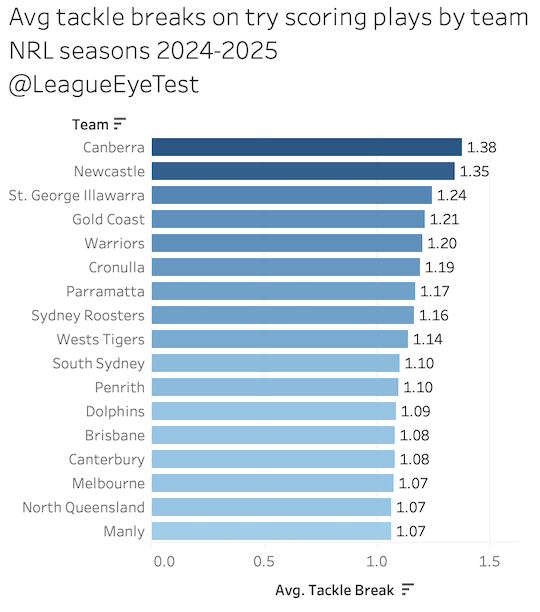
And why do I say that? Because the Raiders break the most tackles on a try scoring play at 1.38, ahead of Newcastle at 1.35, with the Warriors 5th at 1.20. Melbourne, on account again of their incessant kicking rank low, along with North Queensland and Manly at just 1.07 tackle breaks, the latter of which does an exceedingly good job of spreading the ball wide and early.
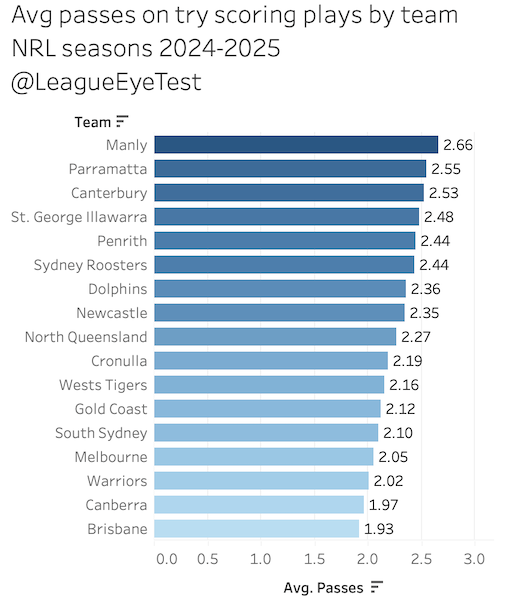
The way the Sea Eagles score can be seen from their average passes per try scoring play, at 2.66 which is first in the NRL over this period. The Eels and Bulldogs also sit above 2.5 passes per try, with the Raiders and Broncos languishing at the tail end of this list with under two passes per try scoring play.
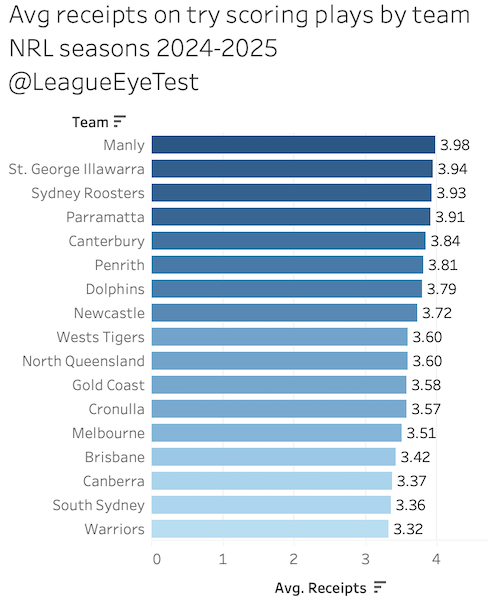
You can start to build a trend of how tries are scored by each team from these numbers, with Manly ranking highly for passes (1st) receipts (1st, see below) and line engagements (6th), whilst ranking 7th for runs and 9th for line breaks.
Along with their last place for tackle breaks per try, they’re clearly able to put players into clear space more often. Which they do more often than most teams, having the second highest distance from the line per try scored at 24.2 metres, only trailing THE Dolphins at 25.8m, who have the ability to score from almost anywhere on the field.
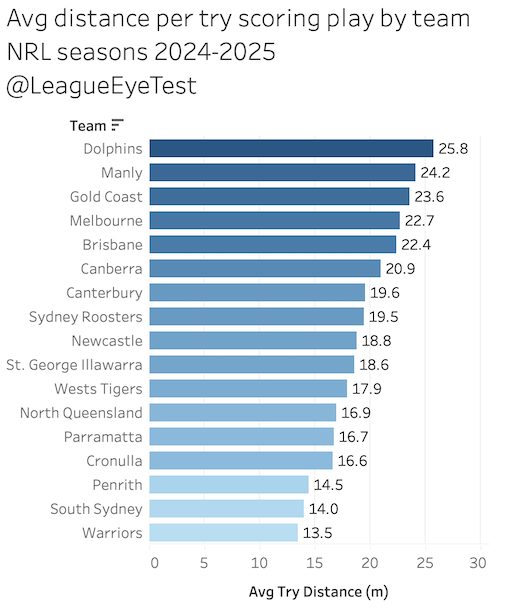
As you can see above, the Warriors rank dead last by metres per try at just 13.5 metres from the line for the start of their try scoring play. When you combine that with the above numbers, as well as ranking 17th for average tackle number when scoring (4.1, the Roosters are first at 3.6), it points to a more predictable attacking system from Andrew Webster that requires positioning close to the line to set up a late set attack, rather than spreading the ball wide and early like Brisbane or Manly to chase early gaps in the line.
Contrast Manly’s style with the Raiders, who despite ranking 1st for tackle breaks per try, rank 14th for runs per try scoring play, 14th for line breaks, 16th for line engagements, 15th for receipts and 16th for passes.

Their strategy from these numbers appears to be short passing plays trying to push strong ball runners over the line rather than expansive passing movements designed to create space out wide. It will be interesting to watch how (or if) this changes with Jamal Fogarty playing at Brookvale and the Raiders likely to be using the law firm of Ethan & Ethan in the halves.
We can also look at these numbers by opponent to see where certain lead ups to a try might be causing them problems.
The Rabbitohs saw 26% of tries conceded containing a kick during that play, which was first in the NRL. The Dragons were not much better at 23.3% of tries involving a kick.
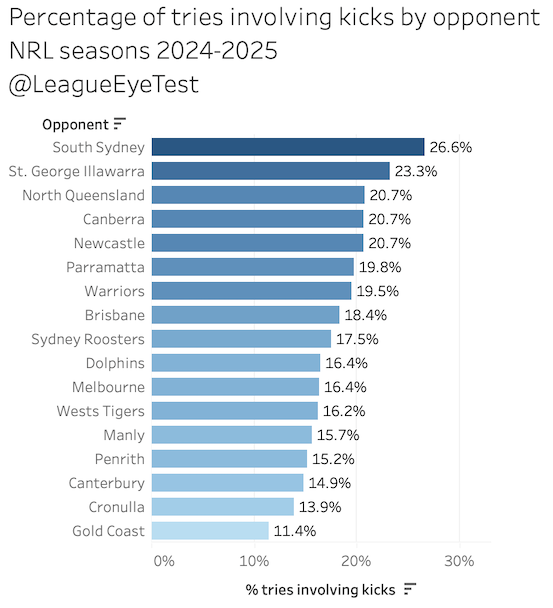
Interestingly the Titans were the best team in the league at just 11% of tries involving a kick (0.11 per try). That is most likely because they allowed teams to stroll into their end zone without the need for any of that fancy modern kicking stuff.
The Gold Coast allowed an eye watering 83.5% of tries involving a line break. If there’s one thing that new coach Josh Hannay could fix to improve their chances, this would be it.
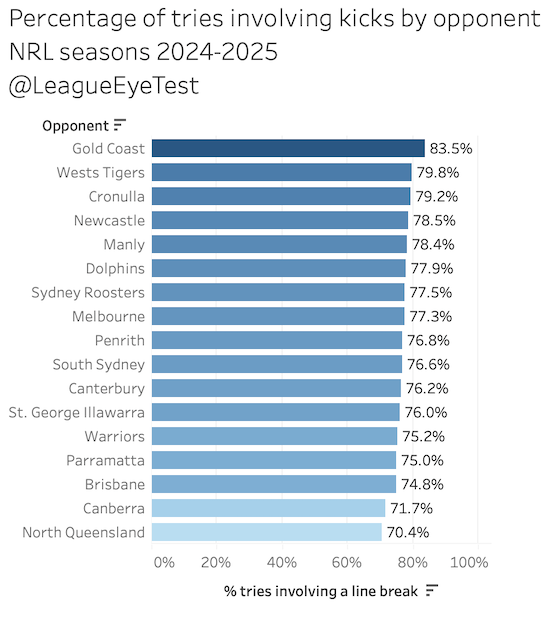
They were the only team above 80% during this time period, with the Wests Tigers the next worst at 79.5%. Interestingly the Sharks ranked third worst at 79.2% of tries involving a line break, with just 13.9% of tries conceded involving a kick. They also concede the shortest average tries in the NRL, at just 15.4 metres.
Cronulla were also second in the league for tackle breaks allowed per try at 1.25, only trailing the Bulldogs who were worst in the league by a considerable amount here at 1.50.
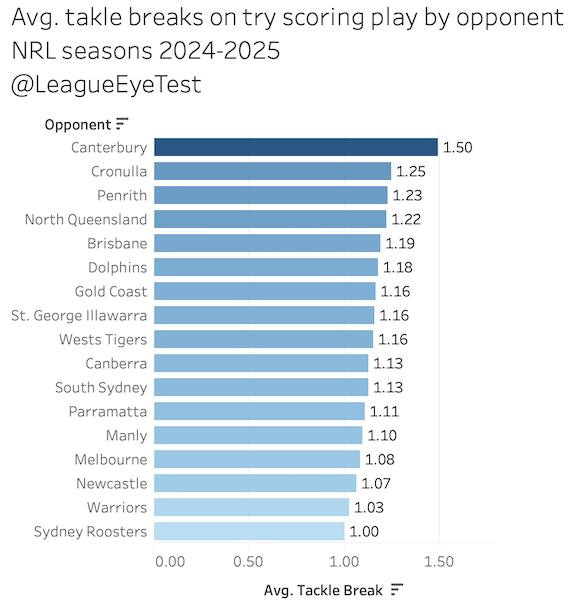
Given how strong the Bulldogs defense has been under Cameron Ciraldo, it points more to a lack of focus than overwhelming systemic issues. When they’re on their game and focused, the Dogs line is tough to crack. But on the rare occasion they do get rattled, the breaks wide open and they give up the fifth longest tries at 20.9m.
Hopefully you can see there’s some interesting numbers that we can extract from this data. At an aggregated level, it shows exactly what you’d expect from using the eye test (not this one). More passes and touches for tries scored out wide, kick attempts mostly aimed towards the edges than the extreme wings, and less movement when the ball crosses the line near the posts.
The even greater use though is breaking it down at a team level to understand how they’re scoring tries or allowing them. It’s clear to see which teams favour kicking for points, which ones struggle to defend them, who is trying to create space and who is trying to power through the line. Like last week’s post about cup stats predicting NRL performance, data and analytics aren’t an all in one solution, but part of a blended method with video analysis playing a major role.
—
Thanks for reading this post. Quality independent, ad-free rugby league content doesn’t exist without support from readers and the community. The Rugby League Eye Test operates under a value for value model. A tremendous amount of time and energy goes into producing content for the site, both of which are hard to find.
If you’ve enjoyed this post, and are in a position to do so, then you can donate an amount of your choice through the PayPal link below, the Kofi page, or through the support page on the site’s menu. You can decide the level of contribution based on the value you believe the Eye Test provides to you.
Support The Rugby League Eye Test
For those of you in areas (such as New Zealand) where there’s issues with PayPal donations for some reason, I’ve set up a Kofi page as well for donations.
If you’re not in a position to donate financially, you can still support the site by sharing this post with others who might enjoy it. Don’t let your favourite content disappear.