
Rivers are never still. They rise with rain, drop in dry spells, and shift with snowmelt, dams, and heat. But a new year-long look from space suggests those ups and downs may be smaller than scientists once believed.
Rivers do more than carry water downhill. They shape farms, cities, shipping routes, floodplains, and drinking water supplies.

For a long time, researchers had to piece together river changes from models, scattered gauges, and bits of satellite data. Now they can watch much of the world’s surface water with far more detail.
Global river measurement
A new study based on data from the Surface Water and Ocean Topography, or SWOT, mission examined how river volumes changed around the world.
The researchers found that rivers gained and lost almost 83 trillion gallons (313 cubic kilometers) of water between October 2023 and September 2024. That was about 28% less variation than the lowest earlier estimates.
The mission is a joint effort led by NASA and the French space agency CNES, and the research team behind this analysis works at NASA’s Jet Propulsion Laboratory in Southern California.
The result comes with a big caveat. The Amazon basin went through a record drought during that stretch, and that likely pulled the global total down.
Even so, the data offers one of the clearest looks yet at how rivers expand and contract over time, and it also opens up a new way to study the hidden shape of river channels.
What the satellite saw
SWOT launched in 2022 and stands apart from earlier missions because it can track not just the ocean, but also nearly all of the world’s lakes and rivers with very high precision.
The satellite does not measure a river’s absolute volume directly. Instead, it tracks changes in width, surface height, and slope.
That is a big step forward. In the past, hydrologists often had to estimate river storage by combining one system’s measurement of water height with another system’s estimate of width, or by leaning heavily on computer models.
SWOT does both measurements at the same time with its Ka-band Radar Interferometer, called KaRIn, which bounces microwaves off the water’s surface and times how long the signal takes to return.
A year of rises and falls
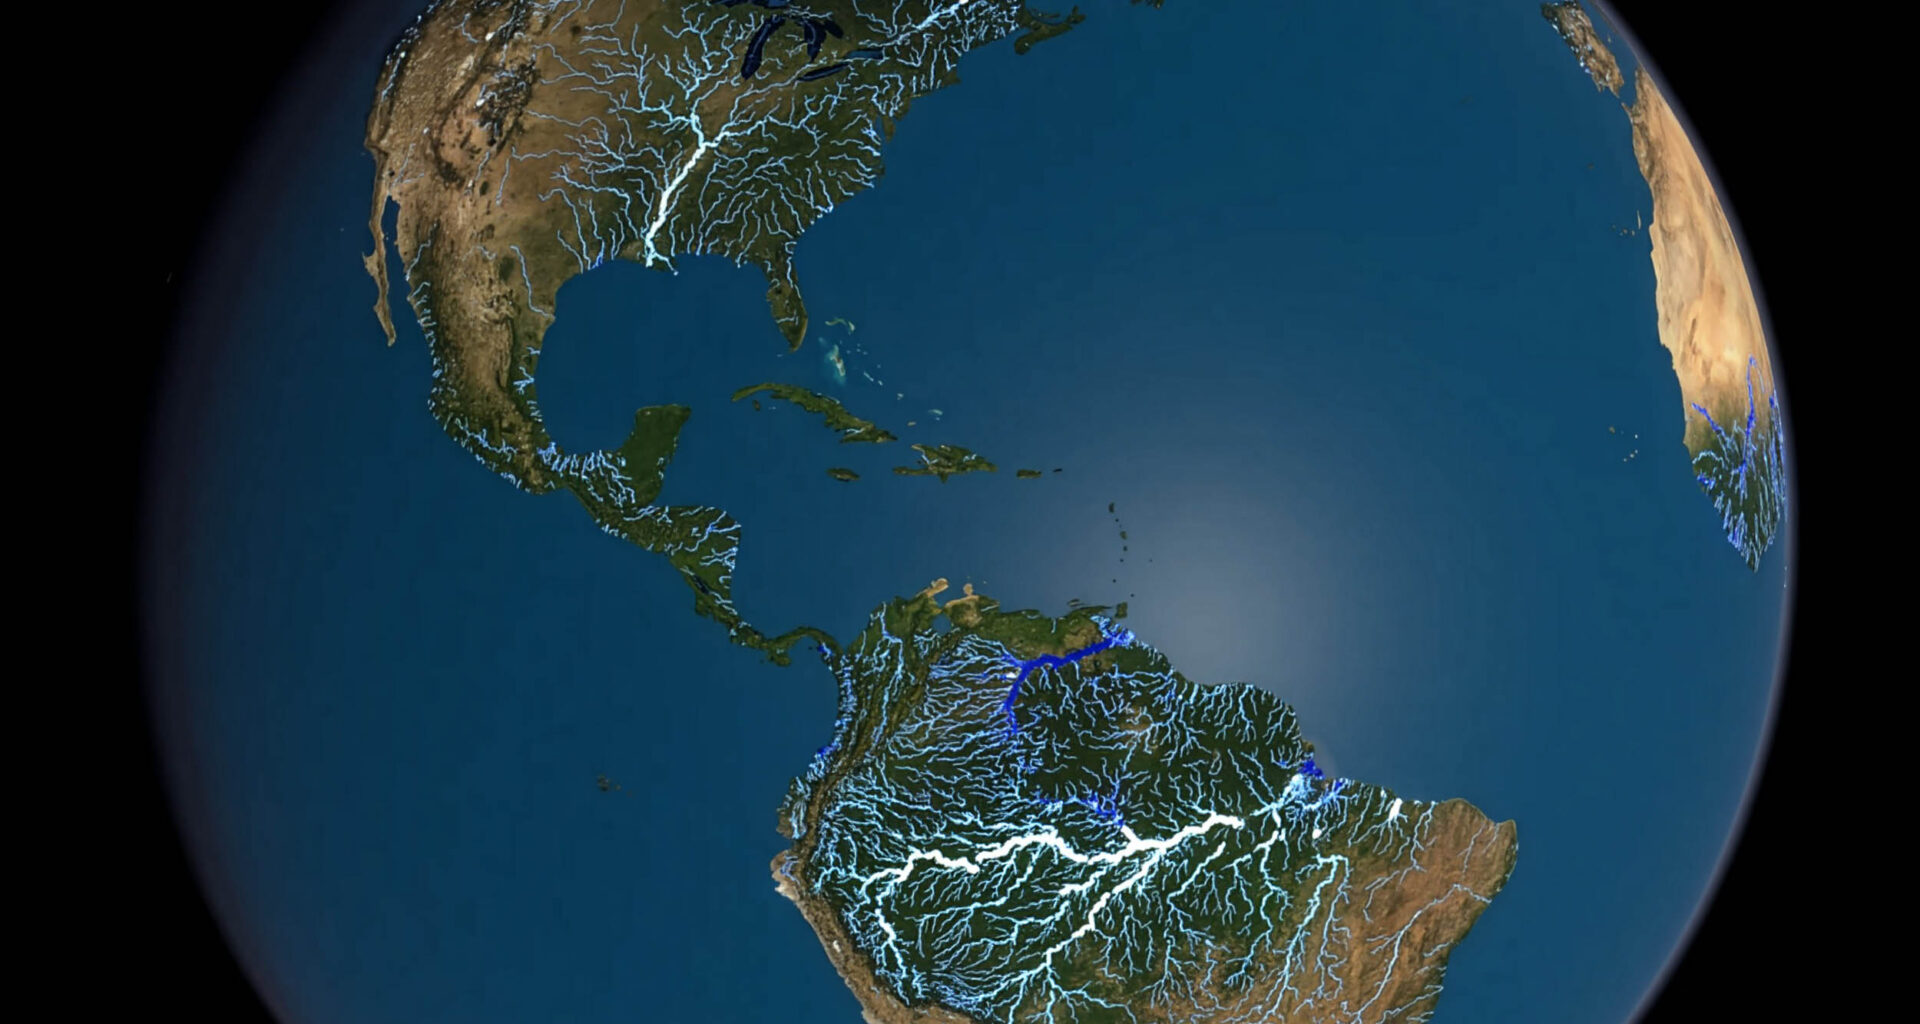
The study drew on nearly 1.6 million observations and followed about 127,000 river segments over 12 months.
The Amazon showed the biggest swings of all, gaining and losing more than 45 trillion gallons (172 cubic kilometers) across the year.
That is enough water to cover the entire state of California in more than a foot (0.3 meters) of water.
The Nile told a very different story. Although it is the world’s longest river, it varied far less than expected, with changes of only 2.2 trillion gallons (8.5 cubic kilometers).
Researchers say several factors may help explain that, including upstream damming, severe drought, and the fact that scientists are still learning how best to work with a new instrument.
Seeing riverbeds from space
The data is doing more than tracking seasonal change. It is also helping researchers map the shape of riverbanks and riverbeds, which is surprisingly hard to do on the ground.
Many rivers are remote. In some places, gauges are rare and boat surveys are difficult or impossible.
That has left major gaps in basic knowledge about how fast rivers flow and how rainfall and snowmelt move into them.
Those missing details affect real-world decisions. The shape of a river channel can influence flooding, navigation, erosion, and how water spreads across a floodplain.
With the new observations, scientists can begin to see channels that are concave or convex, steep or gentle, stable or highly variable.
Rivers with extreme swings
In the Amazon, Mississippi, Orinoco, Yangtze, Ganges, Mekong, and Yenisei rivers, observed water levels differed by more than 32 feet (9.7 meters) from peak to trough.
That kind of rise and fall reveals how water moves through large river systems and how those systems interact with nearby land.
It also shows why a global view matters. Rivers do not behave the same way from one continent to another.
Climate, upstream engineering, floodplain size, and local geography all shape what happens over the course of a year.
The future of river monitoring
Scientists have wanted this kind of accounting for years because rivers sit at the center of the water cycle. They connect rain, snow, groundwater, wetlands, agriculture, ecosystems, and the sea.
Better measurements from satellite river data can improve flood forecasting, water management, and climate research. They can also help places with little ground monitoring finally get consistent data.
“We’re starting to untangle some of the really tough questions SWOT was built for. This is just the beginning,” said Cedric David, who leads the SWOT research team that carried out the work.
“The implications go far beyond hydrology and will help us understand how water moves through the global Earth system,” said Arnaud Cerbelaud, a postdoctoral research fellow at JPL who co-led the study.
The information was obtained from a NASA Jet Propulsion Laboratory (JPL) press release.
—–
Like what you read? Subscribe to our newsletter for engaging articles, exclusive content, and the latest updates.
Check us out on EarthSnap, a free app brought to you by Eric Ralls and Earth.com.
—–