
The extent of land use by renewable energy projects is a recurring source of contention.
But it is really a non-starter: Every proper analysis I’ve seen shows that wind and solar projects will take up only a tiny fraction of land, even if opponents of clean energy would have you mistakenly believe otherwise. (I wrote a Fact Check on the issue when I was at the Clean Energy Council).
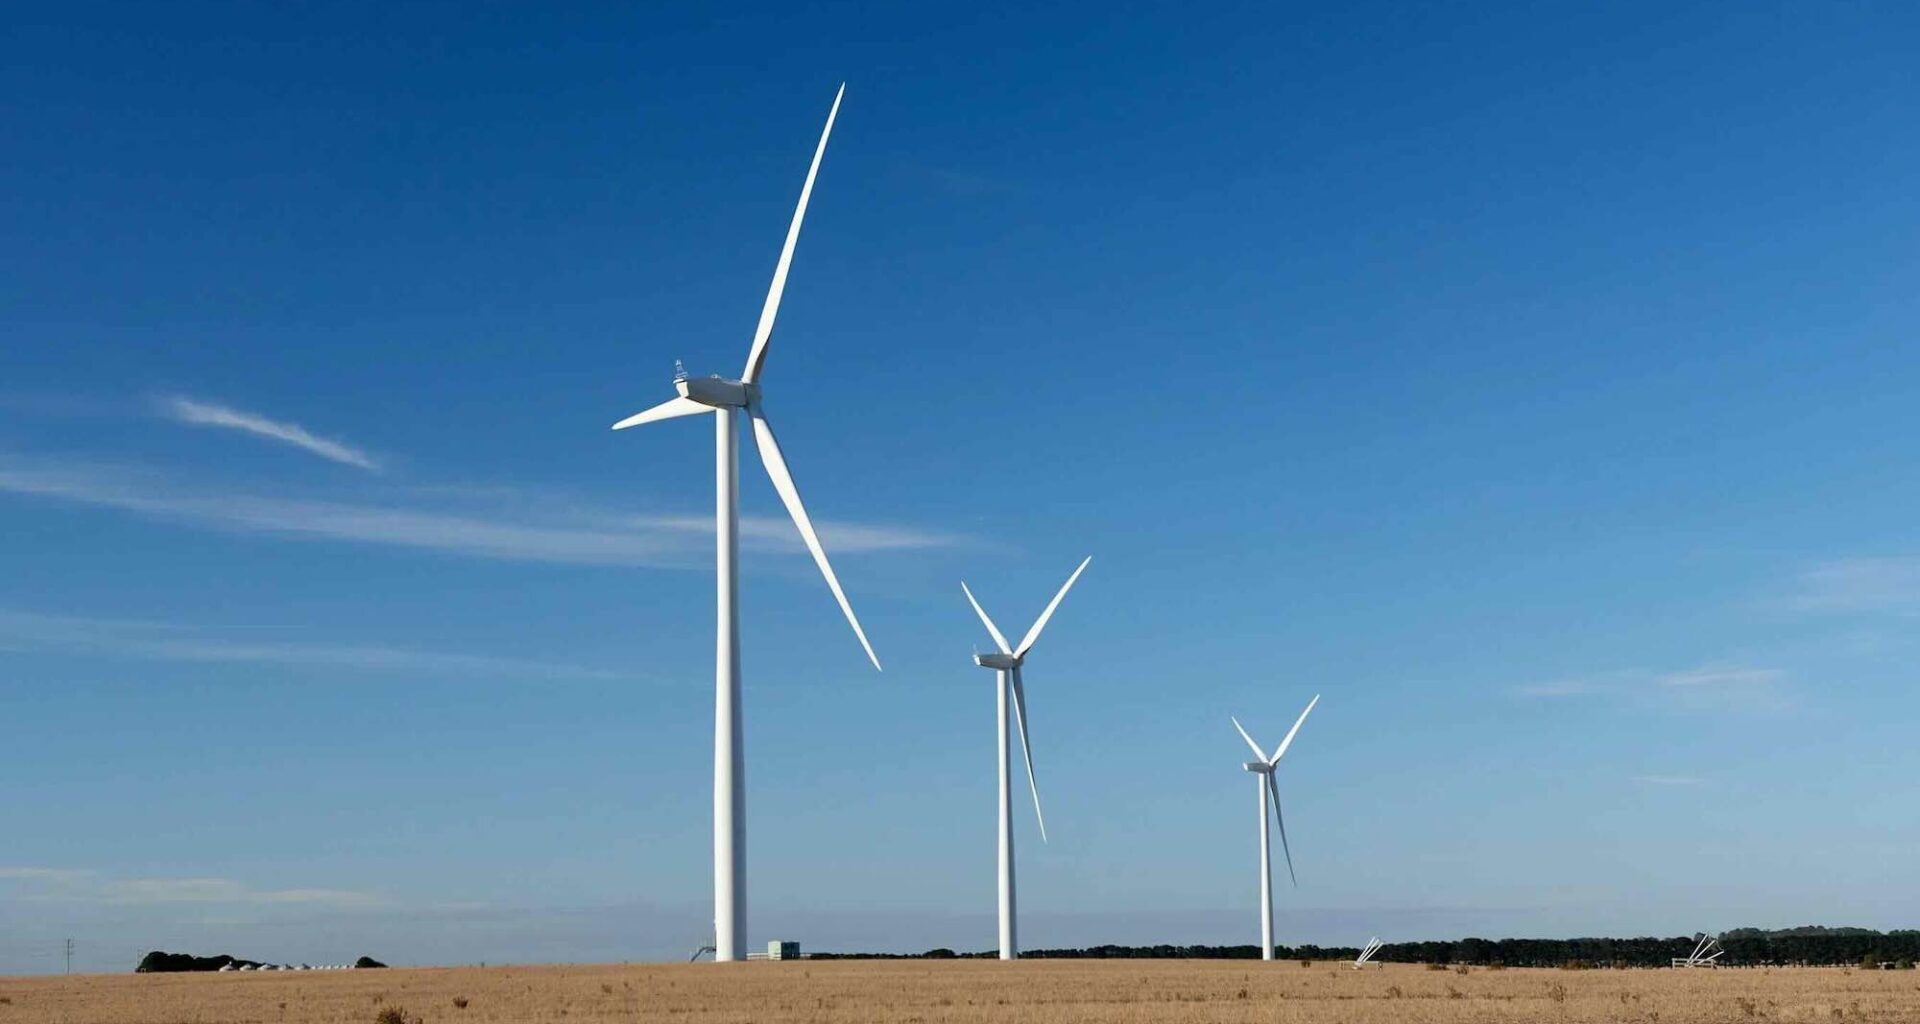
Another significant concern amongst regional communities is visual impact. My view, pardon the pun, is that community concern about visual impact isn’t limited to renewables and regions: it is exactly the same as an urban citizenry opposing a new high-rise apartment development.
In both cases, the question is ultimately whether the change to the skyline is reasonable. (And FWIW, I’m as OK with high-rise apartment buildings near my house as I am with wind turbines in the regions – I recognise it is for the greater good, so just do it responsibly and I expect planning assessors to run the ruler over it).
State government assessment teams have also been exploring how cumulative impacts are taken into account, and contemplating this got me thinking: how does the density of wind turbines in Australia compare to other countries?
I’m aware that local visual impact is not the same as overall jurisdictional-scale density of turbines, but I think it is an interesting metric in the context of how many turbines can be added to a broader landscape before communities feel like enough is enough.
The data set
I couldn’t find a single source that had the number of turbines per country. What I could find is each country’s installed megawatt (MW) capacity (onshore) – in the Global Wind Energy Council’s Global Wind Report.
The first obvious thing to note from this is the extraordinary amount of wind energy in China – nearly 500 GW. That’s hundreds of MacIntyre or Golden Plains sized wind farms.

Note that the GWEC data clumps a bunch of countries into groups like “Other Europe” and “Other APAC”. The purpose of my exercise is illustrative, rather than to produce a definitive ranking, so I have left those “other” countries out.
Worth noting though that this “other” list includes Denmark, which has ~5 GW of onshore wind in a land mass less than a quarter the size of Victoria, so, spoiler alert, that is going to have a way higher turbine density. Similarly for Belgium (and possibly many others – I didn’t look into this any further).
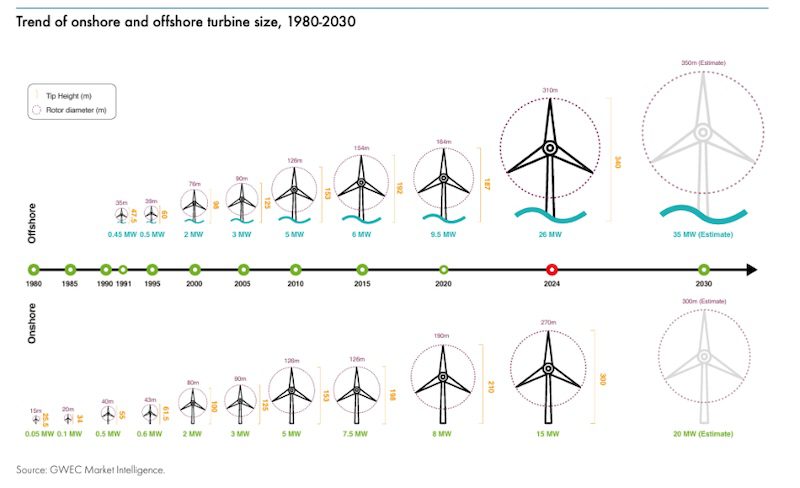
To convert MW capacity into number of turbines, I had to account for the fact that wind turbines have grown much larger over time. 50 MW installed today requires a lot fewer turbines than 50 MW installed in 2010.
(Those older turbines were also a lot smaller, but my analysis isn’t trying to come up with a 3D picture of turbine density, so I’m ignoring that, sorry).
I have assumed each turbine installed in a given year aligns with the MW capacity in the GWEC chart below. Pre-2001 turbines are assumed to be 2 MW, which I know is not true, but in the grander scheme of things it is not shifting the needle on the outputs (and those way smaller old turbines will have much less visual impact, which is what the analysis is exploring anyway).
The other workaround is that I wasn’t going to dig up each country’s year-by-year trajectory for installations.
So I used the global trajectory in MW growth, calculated each year’s contribution to the current total and used the average turbine size for that year to extrapolate into a data set that has number of turbines installed per year in each country, which aggregates into the total number of turbines in the jurisdiction at present (or, end of 2024, which is the GWEC dataset).
The findings
Here is the basic plot of the number of wind turbines per 1000 km2 in each country. (Remember this is leaving out the countries in each continent with lower total installed capacities, like Denmark, even if they might be more turbine-dense.)
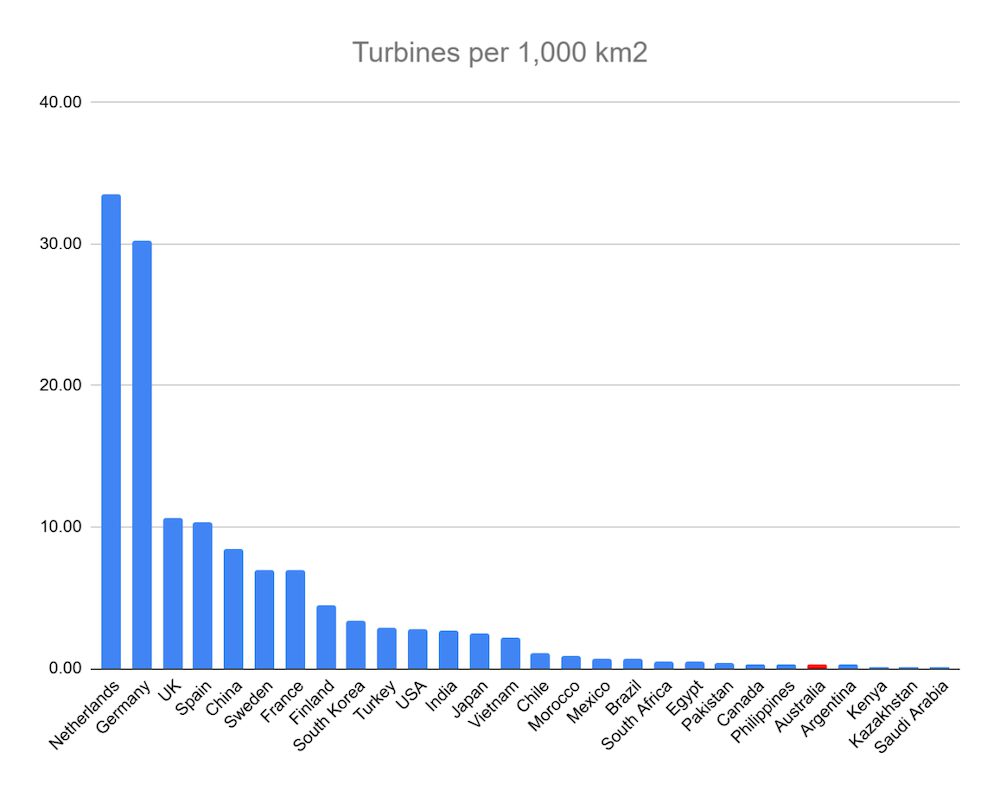
Unsurprisingly, our vast land mass means that our middle-of-the-pack MW capacity converts into very low average turbine density.
Of course, this is a somewhat unfair comparison, given the lack of population and major energy networks in most of Western Australia and the Northern Territory. So, recalculating average turbine density for the NEM states, using 2024 ISP capacities…

As you can see, even Australia’s most “wind-turbine-dense” state, Victoria, has about 10% of the turbine-density of the Netherlands and Germany, and comfortably behind the other western and northern European countries that we tend to use as a yardstick on all sorts of other international comparisons.
Victoria is also alongside other advanced economies like the US, Japan and South Korea. Other mainland NEM states are in the long tail of very low turbine density.
I contemplated extending the analysis to the REZ-scale, but opted against it for two reasons:
– 1. The whole point of REZs is to create a geographic concentration of renewable energy projects. Of course these areas will become quite high density. This has been part of the problem with ideas around a “cumulative visual impact” test – governments are telling developers to focus on these areas (and in some cases creating financial disincentives to not be in a REZ), so they cannot then penalise projects for cumulative impacts. From a community perspective, yes, this increases the impact on them (but also increases the benefits) – just like clustering high-rise apartments to suburban activity centres does, rather than spreading them out evenly across a city.
– 2. Comparing turbine density in an Australian REZ to turbine density in the entirety of another country is apples and oranges. You would be ignoring any clustering of projects (or no-go zones) in those other countries. For example, French wind farms might be heavily skewed towards the Atlantic coast where winds might be higher (don’t know this for sure – just a guess). Large parts of Brazil are jungle, so why should we ignore non-REZ land in, say, NSW but include the inaccessible Amazon in area calculations?
The conclusion is: Australia is very much middle-of-the-pack when it comes to how many wind turbines we have for the land we have available.
None of this is to say that we should put wind turbines willy-nilly about the place. As I flagged above, all development should be done responsibly and will be subjected to rigorous planning and environment assessments for its suitability. But also, let’s get on with it.
Dr Nick Aberle is a consultant at Strategy Partner Advisory. Previously, Aberle was at the Clean Energy Council as general manager of strategy, campaigns and engagement and policy director for energy generation and storage.
This article was originally published on LinkedIn, here. Republished here with permission.
![]()