
Construction of Liriodendron linear pangenome
A total of 24 accessions were used to construct the Liriodendron pangenome: 22 were from second-generation resequencing data, one was the previously released chromosome-level genome of L. chinense, and L. tulipifera was used as the reference genome. Sequencing data and depth information for the 22 accessions are presented in Table S2. De novo assembly of these 22 accessions yielded a total of 23.55 Gb of contigs, with an average assembly size of 1.12 Gb and an average contig N50 of 4,125 bp (Table S3). After decontamination and redundancy removal, 27.9 Mb of non-reference sequences were obtained, comprising 23,121 contigs. Additionally, alignment of L. chinense to the L. tulipifera genome identified 88 Mb of non-reference sequences and 439 non-reference genes. By merging the reference genome with these non-reference sequences, a combined genome of 1.61 Gb was constructed, including 116 Mb of non-reference sequence space in Liriodendron. Gene structure prediction on the non-reference sequences identified 3,119 protein-coding genes with an average length of 895 bp, which is notably shorter than the average gene length in the reference genome (12,382 bp), suggesting that the second-generation assemblies were more fragmented, resulting in partial or fragmented genes. In summary, this study assembled a Liriodendron pangenome totaling approximately 1.61 Gb and encompassing 32,773 genes (Table 1).
Table 1 Summary statistics of linear pangenome features in LiriodendronPAV analysis
To assess the distribution of annotated genes across different accessions, we employed a ‘map-to-pan’ strategy to identify PAV genes. The read coverage across the gene regions reached 80% and CDS region covered from read depth exceeding two-fold were classified as ‘present’ in an accession; otherwise, they were classified as ‘absent’. The results indicate that, similar to some previous research findings, the constructed Liriodendron pangenome appears to be closed-loop, with most genes included when the random sample size reaches 50 (Fig. 1). Based on gene presence frequencies across accessions, genes were categorized into core genes (13,779, 43.08%), present in all accessions, and dispensable genes (18,179, 56.84%). Dispensable genes were further subdivided into 5,354 softcore genes (present in more than 99% of accessions), 12,724 shell genes (present in 1–99% of accessions), and 101 cloud genes (present in less than 1% of accessions) (Fig. 2). Additionally, the dispensable genes—including softcore, shell, and cloud genes—were all considered PAVs. The proportion of core genes aligns with findings from previous pangenome studies in soybean [38], tomato [10] and pigeon pea [39].
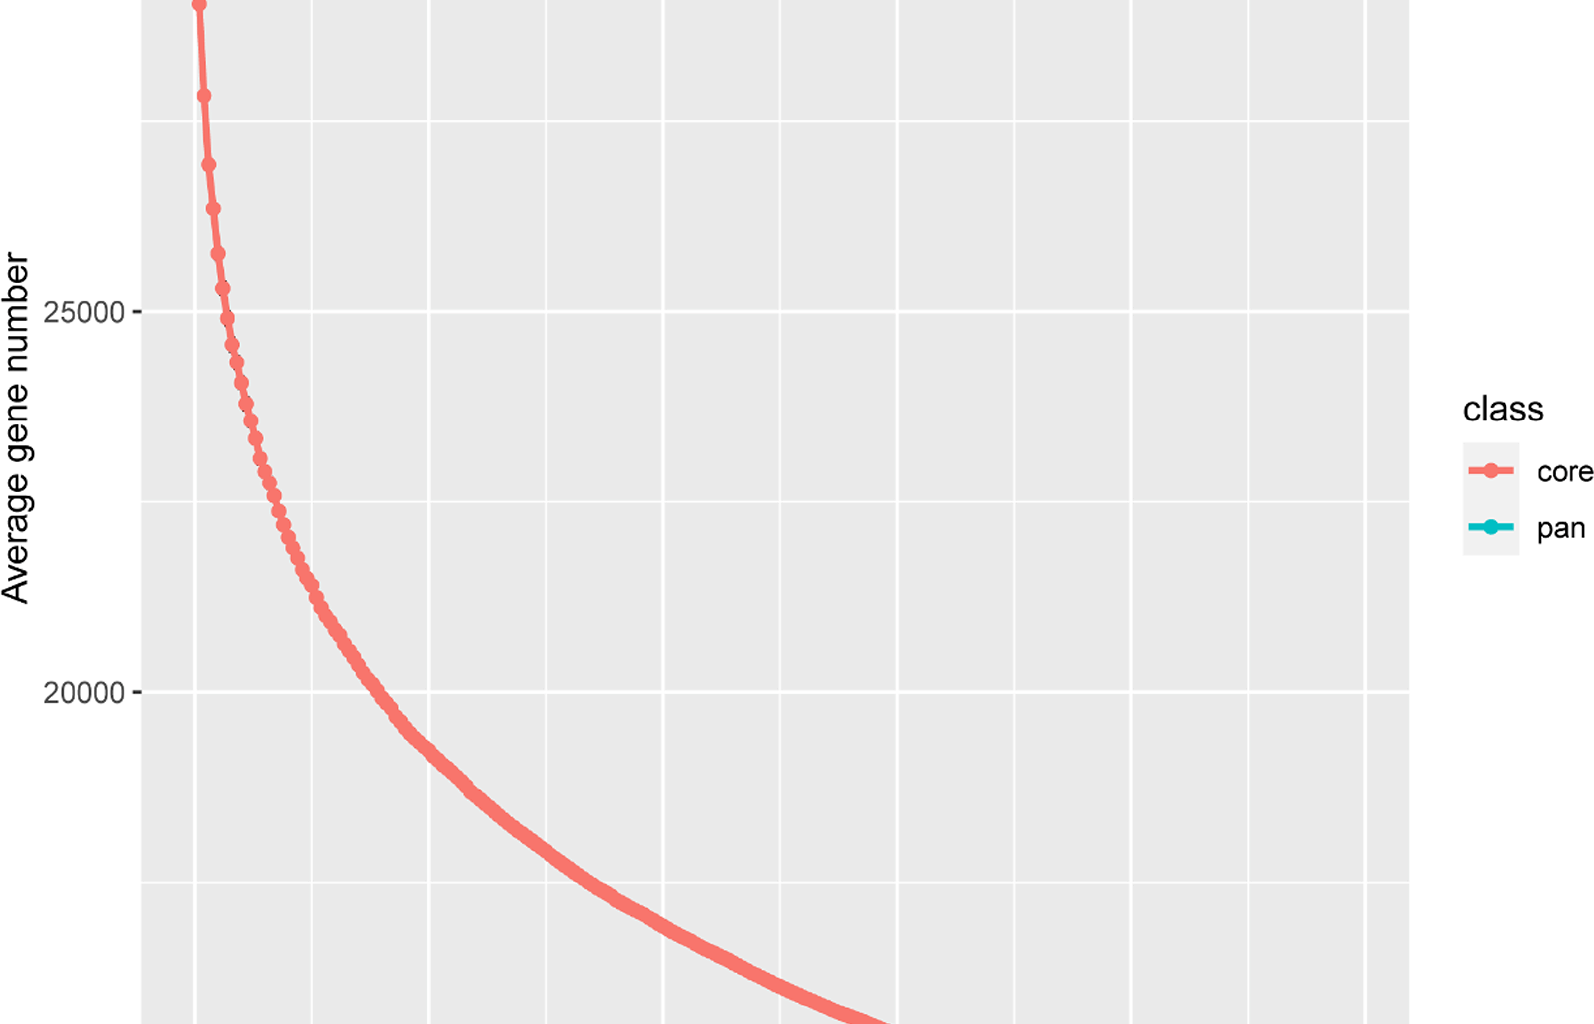
Fig. 1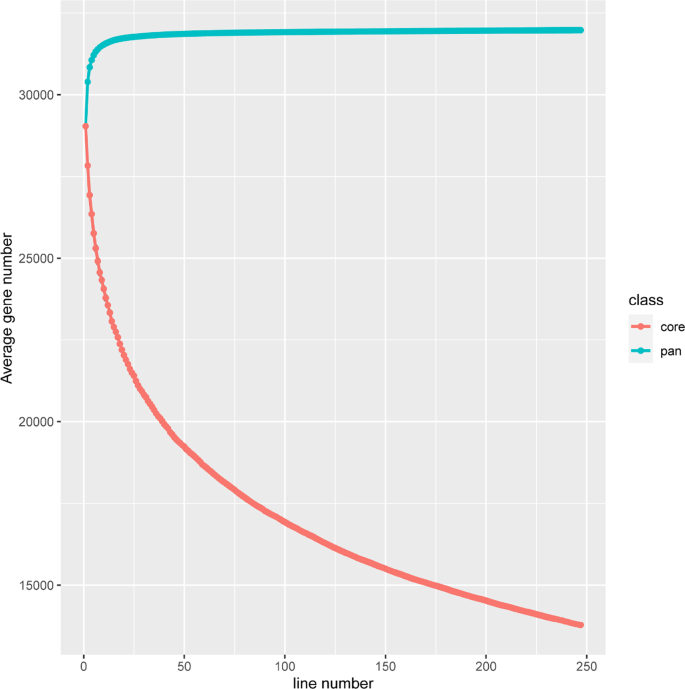
Simulation of the increase of the pangenome size and the decrease of the core genome size by iterative randomly sampling accessions in Liriodendron linear pangenome
Fig. 2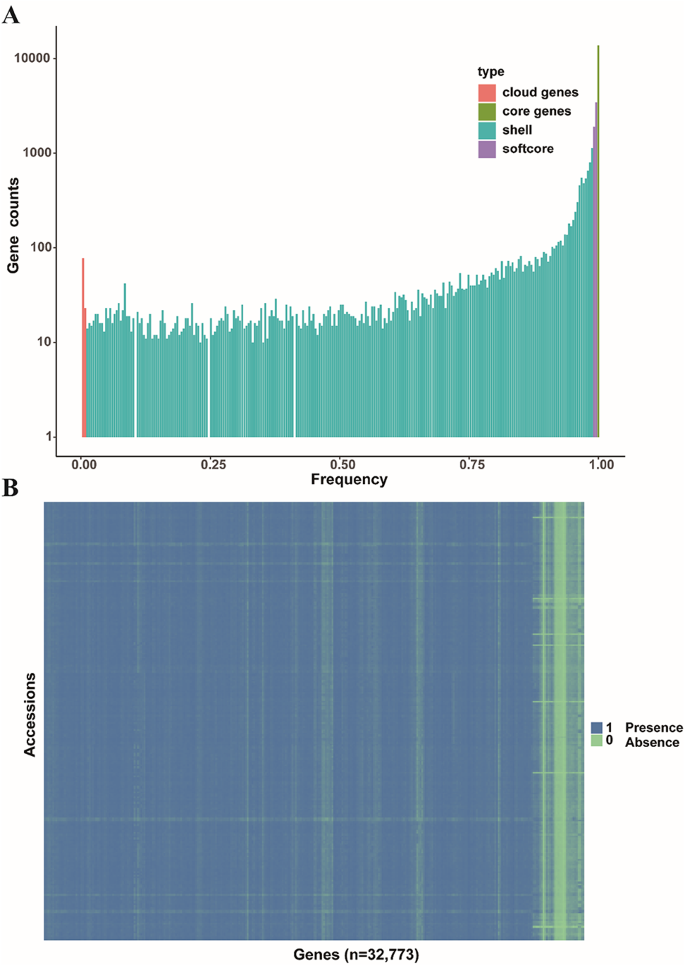
Genome-wide PAVs of Liriodendron. (A) Composition of Liriodendron linear pangenome. (B) The heatmap of variable genes in the linear pangenome; “1” indicates that the gene in the linear pangenome is present in this genotype from hybrid Liriodendron, while “0” signifies its absence
Expression analysis of PAV genes
Additionally, we performed RNA-seq analysis based on previous studies [5, 40] across various tissues to examine gene expression in the Liriodendron pangenome. Results revealed that 21,018 genes in the reference genome and 96 genes in the non-reference genome (Table S4) showed expression levels above 1 TPM in at least one of seven tissues: bracts (BR), leaves (LE), petals (PE), pistils (PI), shoot apices (SA), sepals (SE), and stamens (ST). We also observed that non-reference genes generally exhibited significantly lower expression levels than reference genome genes. To further investigate species-specific PAV genes in L. chinense and L. tulipifera populations and explore their potential connection to unique biological characteristics, we identified a total of 999 L. chinense population-specific genes (Lchi-PAV) (Table S5) and 916 L. tulipifera population-specific genes (Ltu-PAV) (Table S6). Among these, the L. chinense population includes 731 non-reference genes, while the L. tulipifera population has only 11, suggesting that the majority of Lchi-PAV genes derive from non-reference genome assemblies. This finding further highlights the high accuracy of the pangenome and PAV variation map constructed in this study. Furthermore, we found that only 239 and 381 genes within Lchi-PAV and Ltu-PAV, respectively, had expression levels above 1 TPM (Table S5; Table S6). In addition, we randomly selected some Ltu-PAV genes for PCR amplification to verify the accuracy of Ltu-PAV genes identification in L. tulipifera and L. chinense accessions (Fig. 3). This suggests that many of these species-specific genes may not be highly expressed under most conditions but may play crucial roles in certain unique biological functions specific to each species.
Fig. 3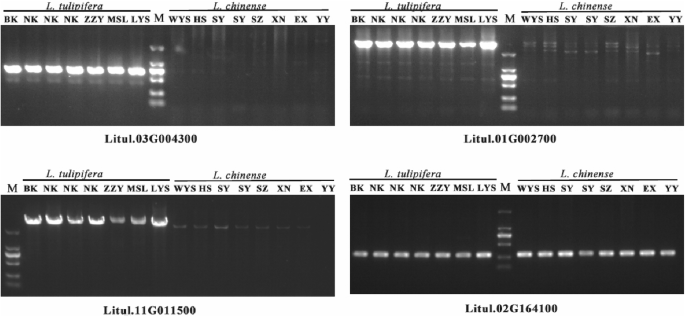
PCR amplification verification of Ltu-PAV genes. The lengths of the marker from top to bottom are 2000 bp, 1000 bp, 750 bp, 500 bp, 250 bp, and 100 bp, respectively
PAV-GWAS analysis of growth traits in hybrid Liriodendron population
In this study, the PAV gene variation map was used as genotype data, while growth trait measurements—including H, DBH, CBH, and CLR—were used as phenotype data for PAV-GWAS analysis. To enhance candidate gene localization accuracy, GWAS was conducted using growth trait data from hybrid Liriodendron offspring collected over three consecutive years. Results identified 4, 8, 2, and 2 significant loci associated with DBH, H, CLR, and CBH, respectively (Table S7). Notably, three significant genes for DBH were consistently identified across all three years of GWAS analysis, and two candidate loci were co-located in two consecutive years. For tree height, a total of eight significant candidate genes were identified, though these loci were derived solely from the 2023 GWAS analysis (Fig. 4). In contrast, the 2021 and 2022 GWAS analyses yielded no significant loci associated with tree height, likely due to challenges in obtaining stable and reliable phenotypic measurements for this trait. In CBH and RCL, two significant candidate genes were consistently co-located, which greatly enhances the precision of gene localization.
Fig. 4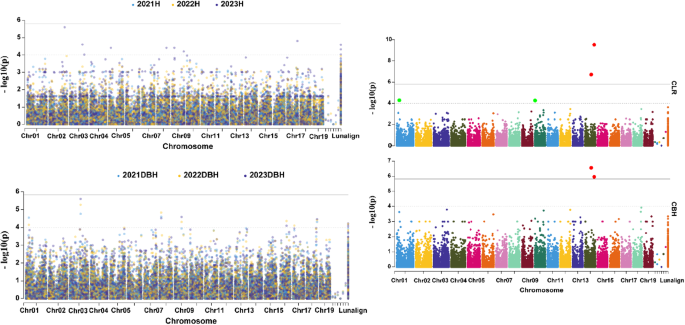
Genomic loci associated with Tree Height, Diameter at Breast Height, Clear Bole Height, and Crown Length Ratio traits based on PAV genes. In the Manhattan plot, the solid black line represents the GWAS significance threshold -log10(1/32,773) and the dashed line represents a self-defined minimum threshold -log10(1e-4)
To further investigate key candidate genes significantly associated with growth traits, we focused on notable candidate genes highlighted in the significance analysis. For DBH, the candidate gene Litul.08G029000, which encodes a zinc finger BED domain-containing protein (WRKY 117), was associated with DBH-related signals over two consecutive years. This gene, which is present only in L. tulipifera and absent in L. chinense, may be involved in DBH growth. Interestingly, the DBH of L. tulipifera was significantly higher than that of L. chinense, aligning with L. tulipifera’s status as a fast-growing, highly adaptable pioneer species in North America. For H, eight significant loci were identified. Among them, Litul.02G164100 encodes an auxin-responsive protein, directly linked to growth and development processes, and is present in all Liriodendron genotypes (Fig. 3), indicating its involvement throughout hybrid Liriodendron’s growth. In RCL and CBH, two significant loci, Litul.14G076500 and Litul.14G123900, were consistently co-located. These genes encode a putative transcription factor/chromatin remodeling BED-type (Zn) family protein and an F-box protein with interaction domains, respectively (Table S7). Further, Litul.14G076500 was absent only in the MSL accession of Liriodendron, while Litul.14G121900 was present only in the BK accession (Table S6). These apparently species-specific genes may be linked to unique biological traits, potentially playing crucial roles in the growth and development of Liriodendron.
Mining candidate genes related to growth traits in hybrid Liriodendron
To further elucidate the role of candidate genes in the growth and development of hybrid Liriodendron, we examined their expression levels to assess potential links to growth. Based on previous research, we selected one strong and one weak heterotic combination from the Liriodendron population for heterosis analysis. Leaf, shoot, and phloem tissues were collected from each combination and their parent trees for transcriptome sequencing. To explore tissue-specific expression of PAV genes in different hybrid combinations and their relationship with growth vigor, we conducted differential expression analysis (DEG) on offspring from both strong and weak heterotic combinations across different tissues. In leaf tissue, we identified 1,030 DEGs in both combinations, with GO enrichment predominantly in “cell cycle process”, “nuclear division”, “DNA replication” and “mitotic cell cycle process”, suggesting a strong link between these DEGs and growth processes. In shoot tissue, 431 DEGs were identified in both combinations, with GO enrichment in “secondary metabolic process”, “farnesyl diphosphate metabolic process” and “regulation of signaling receptor activity”. In phloem tissue, we found 893 DEGs between the strong and weak heterotic combinations, with GO terms primarily enriched in “plant-type secondary cell wall biogenesis”, “photosynthesis, light harvesting”, “meristem maintenance” and “lignin biosynthetic process” (Fig. 5C and D; Table S8). Interestingly, the number of DEGs in shoot tissue was significantly lower than in leaf and phloem tissues, suggesting that PAV genes associated with growth vigor may play a particularly prominent role in the growth and development of leaf and phloem tissues, thereby contributing to the growth vigor observed in hybrid Liriodendron.
Fig. 5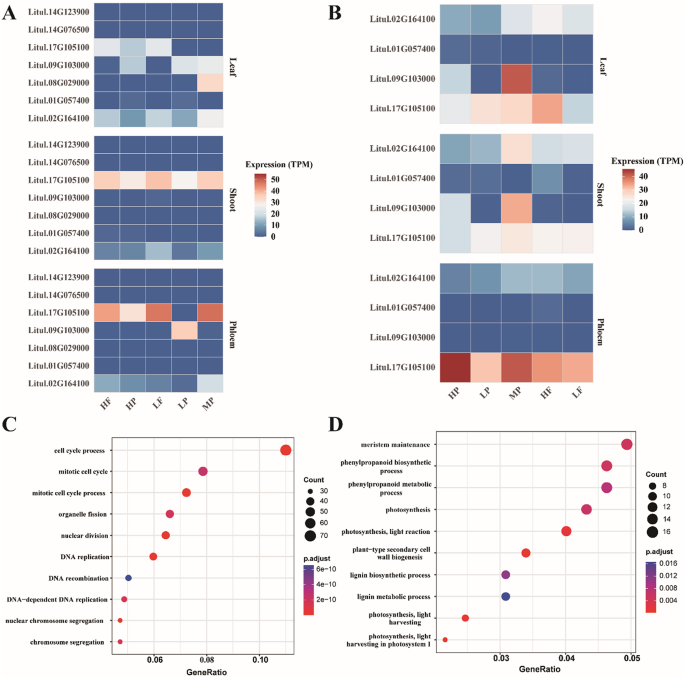
DEGs and PAV-GWAS candidate genes on the expression levels of offspring from dominant and non-dominant combination in different tissues. (A-B) Expression heatmap of genes related to hybrid vigor in growth traits; Note: HP, advantage male parent; LP, non-advantage male parent; MP, female parent; HF, advantage combination offspring; LF, non-advantage combination offspring. (C) The top 10 items with the most significant GO enrichment analysis results for DEGs between strong and weak heterotic combinations in leaf tissue. (D) The top 10 items with the most significant GO enrichment analysis results for DEGs between strong and weak heterotic combinations in phloem tissue
Our previous research [2, 3] suggests that non-additive expression patterns play a key role in the growth of hybrid Liriodendron. To further investigate the dominant and over-dominant expression of PAV genes in leaf, shoot, and phloem tissues, we classified these expression levels into four dominant patterns and six over-dominant patterns. Dominant expression patterns included high-parent expression (III and IV; Hybrid expression levels biased toward the more highly expressed parent) and low-parent expression (V and VI; Hybrid expression levels biased toward the less highly expressed parent). Over-dominant expression patterns included expressions above the low-parent (VII, VIII and IX; Hybrid expression levels significantly lower than those of both parents) and above the high-parent (X, XI and XII; Hybrid expression levels significantly higher than those of both parents). In leaf tissue, dominant expression genes in weak heterotic combinations were notably higher than in strong heterotic combinations, whereas no significant differences were observed in the other two tissues (Table S9). This suggests that, in leaf tissue, PAV genes linked to growth vigor may negatively regulate growth-related genes through increased dominant expression in weak heterotic combinations, allowing strong heterotic combinations to exhibit greater heterosis in growth traits. Additionally, leaf tissue exhibited significantly more over-dominant expression genes compared to shoot and phloem tissues. This finding further indicates that growth vigor may be closely linked to the photosynthetic processes in leaf tissues, where over-dominant expression may play an essential role in growth and development (Table S9).
To investigate candidate genes associated with growth vigor and their roles in heterosis via gene expression changes, we analyzed expression patterns of GWAS-identified candidate genes. Notably, Litul.02G164100 and Litul.01G057400 (encode terpene synthase) exhibited high-parent dominant expression in the strong heterotic combinations of leaf and shoot tissues, respectively, thereby contributing to growth vigor. Furthermore, Litul.01G057400 displayed differential expression levels in dominant versus non-dominant shoot tissue combinations, suggesting that these genes may play critical roles in growth vigor of hybrid Liriodendron (Fig. 5A and B). These findings underscore the significance of non-additive expression patterns of PAV genes, especially in dominant gene expression, in the development of growth vigor in hybrid Liriodendron.