
Different techniques that were used to generate orthogonal information for analysis by AI are described below.
Triboelectric current generation
The triboelectric effect, which involves contact electrification between surfaces, provides a useful method for studying the electrical behavior of polymeric materials28. A custom-built triboelectric system in a parallel plate geometry, as shown in Fig. 2a, was used to analyze the triboelectric voltage behavior of plastics with varying amounts of recycled content. Here, the top electrode moves cyclically at a controllable speed against the stationary bottom electrode with the plastic sample. The measured triboelectric voltage characteristics for plastics with different recycled content are shown in Fig. 2b. To characterize the triboelectric voltage behavior, the response was modeled as exponential with a response time as shown in Fig. S1. PET samples with varying recycled plastic content were tested, and the response time constant was plotted as a function of recycled plastic percentage (Fig. 2c). The data shows that the time constant increases as a function of the percentage of recycled content, indicating slower charge dissipation.
Fig. 2: Triboelectric response of PET with varying recycled content.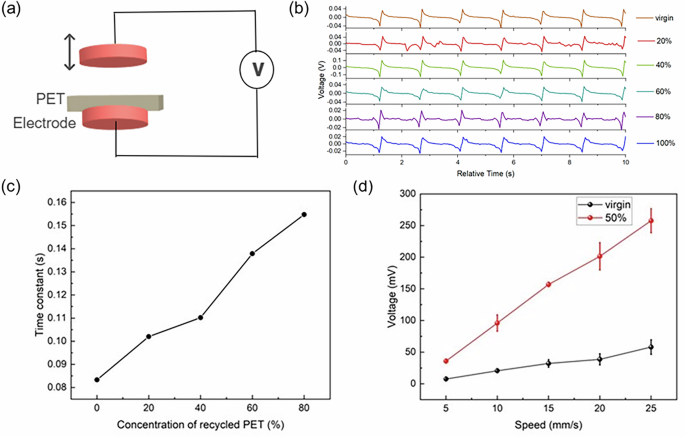
a Schematics of the custom-built triboelectric system. b Calculated discharge time constant of PET containing various percentages of recycled components. c Corresponding charging and discharging curves of PET containing various percentages of recycled components. d The response of virgin PET (top) and PET containing 50% recycled content at varying speeds. Error bars represent the mean ± standard deviation (s.d.) from five independent repeated measurements at each speed (n = 5).
Further experiments were conducted to examine the influence of electrode movement speed on triboelectric signal response. Virgin PET and PET containing 50% recycled content were tested at varying speeds to evaluate signal stability and amplitude, as shown in Fig. 2d. As the movement speed increased, the output signal intensity also increased; however, greater fluctuations were observed, indicating variability in the contact electrification dynamics. Based on these results, an optimal movement speed of 15 mm/s was selected for subsequent experiments to balance signal strength and stability. Triboelectric response of plastics provides the first multi-modal data component for determining the percentage of recycled content.
Dielectric/impedance analysis
Dielectric spectroscopy is a widely used technique for material characterization, particularly for assessing the electrical polarization, energy storage capability, and loss mechanisms in polymeric materials29. The dielectric constant, a complex quantity, provides insight into the material’s interaction with an applied electric field30. It is expressed as \(\varepsilon =\varepsilon {\prime} -j\varepsilon {\prime\prime}\), where \(\varepsilon\) represents the material’s ability to store and remit energy in response to an alternating electric field, and \(\varepsilon {\prime} {\prime}\) describes the energy dissipation as heat within the material, which corresponds to dielectric loss. The ratio of the imaginary to real component defines the loss tangent \(\delta\), which quantifies the energy lost relative to the stored energy in the material31 \(\tan \delta =\frac{\varepsilon {\prime} {\prime} }{\varepsilon {\prime} }\). A higher loss tangent indicates increased energy dissipation under an applied field, making it a crucial parameter for evaluating the electrical behavior of recycled plastics. Higher dielectric loss is seen as undesirable for insulating materials, however, here it provides a measurable signature of recycled plastic defects32.
Recycled polymers contain inherent electrically active defects such as chain scissions, broken bonds, oxidation-induced impurities, and residual fillers from previous processing33,34. These structural modifications introduce localized dipoles that differ from conventional free-electron hopping mechanisms observed in conductive materials35,36,37. Unlike freely moving charge carriers, defect-induced dipoles are bound within the polymer matrix and respond to the external electric field by realigning or relaxing over time. This behavior results in a modified permittivity and dielectric loss, making dielectric spectroscopy a valuable tool for characterizing the degree of recycling in plastics.
To investigate the dielectric properties of recycled plastics, PET samples with varying proportions of recycled content were analyzed using an impedance analyzer (Keysight E4990A) operating in the 20 Hz–100 kHz range. The experimental setup consisted of two fixed capacitor plates mounted on an adjustable stage to maintain a consistent inter-electrode distance during testing. The impedance measurements were conducted using a linear frequency sweep mode from 1 kHz to 100 kHz with a precision setting of five. Before initiating the experiments, the impedance analyzer was calibrated using standard Open-Short compensation. The absolute impedance \(\left|Z\right|\) and phase angle \(\theta\) were recorded directly from the analyzer.
PET samples with different recycled content were analyzed, and the variations in their dielectric responses across the frequency spectrum were collected and presented in Fig. S2. Figure 3a–c shows the correlation between the recycled content and dielectric properties obtained at a fixed frequency of 30 kHz as a function of the percentage of recycled components. As shown in Fig. 3a, b, both the real (ε‘) and imaginary (ε“) parts of the dielectric constant decrease as the recycled plastic content increases. This trend suggests a reduction in the polarization ability of the material, which is indicative of diminished charge separation and lower energy storage efficiency in the presence of an electric field38. The decrease in the real part (Fig. 3a) and the imaginary part (Fig. 3b) of the dielectric constant with higher recycled content can be attributed to defects and impurities that disrupt long-range dipolar interactions, leading to lower permittivity. The reduction in charge separation suggests that the samples exhibit improved energy storage efficiency with minimal heat dissipation, which may have implications for applications requiring stable dielectric properties37.
Fig. 3: Dielectric/impedance analysis of PET with various percentages of recycled components.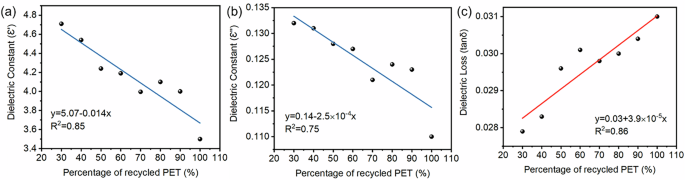
a Real part of the dielectric constant of PET with various recycled components at a fixed frequency of 30 kHz. b Imaginary part of the dielectric constant of PET with various recycled components at a fixed frequency of 30 kHz. c Dielectric loss of PET with various recycled components at a fixed frequency of 30 kHz.
An increase in dielectric loss was observed with higher percentages of recycled plastic as shown in Fig. 3c, suggesting a significant phase difference between the applied electric field and the polarization response. This trend indicates that recycled plastics exhibit enhanced energy dissipation due to structural changes introduced during recycling. The increase in dielectric loss may be attributed to the presence of impurities, chain scissions, and oxidation-induced defects, which introduce additional relaxation processes within the polymer matrix. These defects disrupt the homogeneity of the dielectric response, leading to greater energy dissipation when the material is subjected to an alternating electric field. The observed reduction in permittivity and increase in dielectric loss with increasing recycled content are due to defect polarization and charge trapping in polymers. The dielectric response of plastics provides the second multi-modal data component for determining the percentage of recycled content.
Capacitance analysis for recycled plastic characterization
Capacitance analysis is an effective means of evaluating the dielectric properties of materials by examining the charging and discharging behavior of a capacitor. The charging and discharging rate of a capacitor in a series resistor-capacitor (RC) network is characterized by its RC time constant, \(\tau\), provides the dielectric response of the material within the capacitor. The RC time constant is defined as \(\tau =R\cdot C\), where \(R\) is the resistance in the circuit and \(C\) is the capacitance. The capacitance of a system is directly influenced by the dielectric properties of the material placed between the capacitor plates. By applying a square wave voltage and monitoring the capacitor’s response, the charging and discharging curves can be analyzed to extract \(\tau\), providing a quantitative metric for assessing the dielectric behavior of materials with varying recycled content. In a capacitor, the charging process occurs when an applied voltage causes charge accumulation on the plates, while the discharging process involves the release of stored charge39. The rate at which these processes occur depends on the dielectric constant of the material, with materials of higher dielectric constant exhibiting longer charge retention times. Recycled plastics contain structural modifications such as polymer chain scission, oxidation-induced defects, and residual additives, all of which can influence the material’s permittivity and, consequently, its capacitance. Since capacitance plays a fundamental role in determining the RC time constant, this analysis serves as a sensitive approach to detecting variations in plastic composition due to recycling.
To investigate the relationship between recycled content and dielectric properties, capacitors were constructed using plastic samples as the dielectric material. A function generator supplied a 1 kHz square wave voltage, and the capacitor’s response was recorded using an oscilloscope. The experimental setup effectively functioned as a series RC circuit, enabling precise measurement of the RC time constant.
The experimental configuration ensured that the plastic samples were placed between two conductive plates, forming a parallel-plate capacitor where the permittivity of the plastic directly influenced the capacitance. The charging and discharging voltage profiles were recorded in real time, and the RC time constant was extracted by fitting the exponential decay of the discharge curve. \(V\left(t\right)={V}_{0}{e}^{-\frac{t}{\tau }}\,\), where \({V}_{0}\) is the initial voltage, \(V\left(t\right)\) is the voltage at time \(t\), and \(\tau\) is the characteristic time constant governing the rate of voltage decay. This relationship allowed for a direct comparison between different plastic compositions based on their capacitance-induced charge retention behavior.
The charging and discharging curve for the PET virgin sample is shown in Fig. 4. PET samples with varying percentages of recycled content exhibited distinct variations in their RC time constants, as shown in the supplementary information. The calculated RC time constant for virgin PET was 13 µs, with comparable variations observed across the tested samples. These differences underscore the sensitivity of capacitance analysis in detecting subtle changes in material composition. The variation suggests that recycled plastics, with their increased defect density, display weakened charge storage efficiency, leading to various discharge rates in the RC circuit. The results demonstrate that capacitance analysis provides a non-destructive and quantitative method for assessing the dielectric properties of recycled plastics. The observed variations in RC time constant offer valuable insight into the structural and electrical differences introduced by recycling. The capacitance analysis of plastics provides the third multi-modal data component for determining the percentage of recycled content.
Fig. 4: Charging-discharging response of the virgin PET sample in capacitance measurement.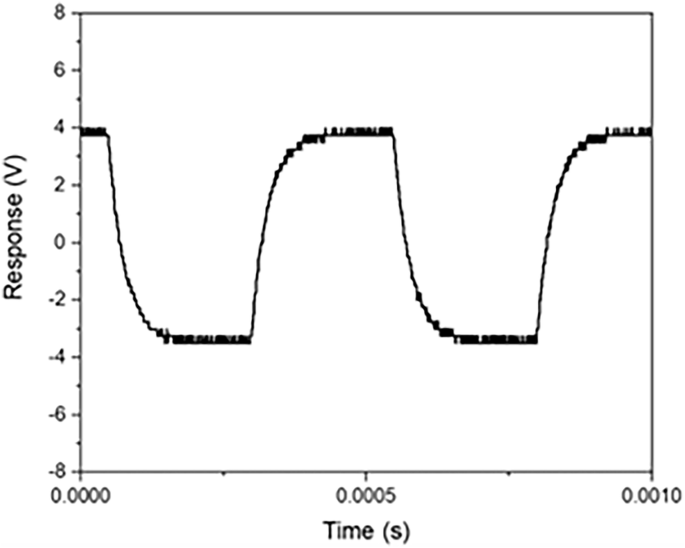
Voltage response of the PET virgin sample as a function of time during cyclic charging and discharging. The periodic voltage change reflects the capacitive behavior of the sample under alternating electrical excitation.
Investigation of the spectroscopic signature of plastics with recycled components
Infrared spectroscopy is an excellent tool for the molecular and chemical composition of recycled plastics. Fourier transform infrared (FTIR) spectroscopy is used for the characterization of waste plastics40, crystallinity of material41, and changes after recycling20. The FTIR technique is well established to characterize polymers, and its ability to detect subtle degradation makes it useful for analyzing recycled plastics.
Attenuated total reflectance Fourier transform infrared (ATR-FTIR) spectroscopy was carried out on the PET films using a diamond prism with 5 scans and a resolution of 2 cm−1. ATR-FTIR spectra of virgin PET and recycled PET are shown in are shown in Fig. 5a–d. No difference was seen between the spectra of both sides of virgin PET and recycled PET. They represent a general PET structure. However, as shown in Fig. 5a-c, absorption bands in virgin PET at 844, 973, 1470 cm−1, are significantly weaker in recycled PET, corresponding to trans CH2 rocking, O–CH2 or C( = O)–O and CH2 bending42. More specifically, they are associated with a structure derived from ethylene glycol.
Fig. 5: ATR-FTIR spectra of virgin PET and recycled PET samples in different wavenumber ranges.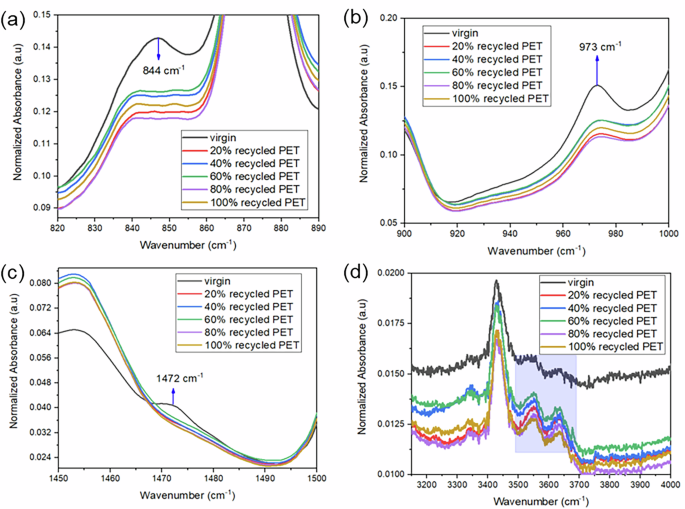
a 820–890 cm⁻¹, b 900–1000 cm⁻¹, c 1450–1500 cm⁻¹, and d 3200-4000 cm⁻¹.
It is known that the recycling process can induce degradation, including chain scission43. However, the change in the above absorption bands indicates the elimination or modification of ethylene glycol. It is suggested that the number of ethylene glycol groups as a terminal of the polymer chain has changed44. López et al. indicated that chain scission during PET recycling often generates polymer radicals with hydroxyl groups. However, as shown in Fig. 5d, the given recycled PET shows a lower intensity of the absorption band at 3430 cm−1, corresponding to the hydroxyl groups, than virgin PET, suggesting that the recycling process does not necessarily generate hydroxyl groups.
Furthermore, all these changes can be associated with changes in crystallinity45. In other words, the FTIR result also indicates that the degree of crystallinity of PET may be lowered after the recycling process. When the crystallinity is lowered, the ductility and processability of the polymer can be degraded46. The spectroscopic signature of plastics provides the fourth multi-modal data component for determining the percentage of recycled content.
Multi-modal deep learning classification using all modalities
The physical methods discussed in the previous section provide insight into the physical characteristics of the plastic object being tested. However, the composite information is high-dimensional, and the differences in the signals are nuanced. Further, due to experimental challenges like the (i) availability of high-quality recycled PET samples with the known recycled percentages and (ii) multi-modal measurement for each sample, the number of samples is limited, which makes the application of modern machine learning challenging for this task.
To address the challenges pertaining to high-dimensional information, we preprocess and encode each modality based on our understanding of the sensing mechanism and combine all four sensing modalities using modern machine learning (deep discriminator network) for the most accurate identification of the percentage of plastic in each sample. To address the challenge in data availability, we perform modality-specific data augmentation to allow us to employ data-driven approaches to classification.
In this section, we discuss the design, training, and evaluation of our deep discriminator network, trained as a single classification model over all eleven classes using all four modalities, as well as the data augmentation, pre-processing, and encoding required to successfully train our classifier. Finally, we discuss the contribution of each of the individual modalities in differentiating the various types of recycled plastic samples. The details of the learning-based analysis are discussed in the Supplementary Materials section.
Figure 6 and Table 1 detail the architecture of our deep classifier network with a convolutional neural network (CNN) encoding head for the FTIR modality. CNNs have been used in the past to classify different kinds of plastics46,47. We use 1D convolutional layers to encode the high-dimensional FTIR modality into a smaller embedding space. We then concatenate the encoded features of the other modalities (peaks from triboelectric charging and discharging response, dielectric constants from impedance analysis, and SEM features from capacitance response), indicated as VIC in Fig. 6, to the embeddings. These augmented features are then further reduced using a fully connected classification head. The 1D convolutional layers encode the high-dimensional FTIR modality into a vector encoding. For each of the other modalities, voltage, impedance, and capacitance, the feature extraction pre-processing step serves as the encoder.
Fig. 6: Proposed Deep Learning architecture.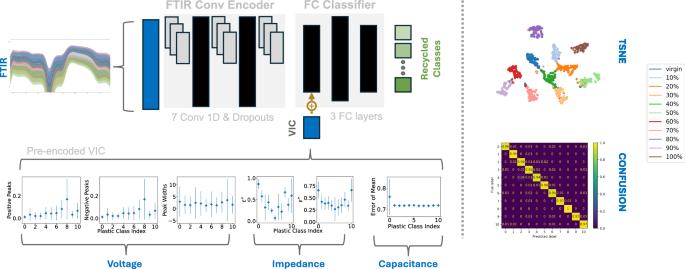
The model uses 1D convolutional layers to transform FTIR into a latent embedding and combines with voltage, impedance, and capacitance modalities for classification. tSNE embedding and confusion matrix show effective classification performance. Plots for voltage, impedance, and capa-citance indicate mean and standard deviation in measurements over samples.
Table 1 Proposed deep learning architectural details
FTIR spectra of materials have previously been modeled as a baseline spectrum, characterizing each material type, shifted by linear combinations of noise factors to account for aleatoric and epistemic uncertainties48. For example, the EMSC method49 models the spectra as:
$$A(\hat{v})=a+m(\hat{v})+b+{d}_{1}\hat{v}+{d}_{2}{\hat{v}}^{2}+\cdots +{d}_{n}{\hat{v}}^{n}$$
Where \(A\left(\hat{v}\right)\) is the measured spectrum, \(m\left(\hat{v}\right)\) is the reference spectrum, and \(a,b,{d}_{1},{d}_{2},\ldots ,{d}_{n}\) are the parameters for the baseline shift and multiplicative effect of higher order polynomials. In this work, we use a first order polynomial approximation for the data augmentation. For other modalities, we augment the extracted features like voltage peak heights and widths, impedance dielectric constants, etc. by fitting Gaussian distributions using sample statistics. Details of this feature extraction are discussed in the next section.
Our proposed model has an accuracy of 92% over the testing set with an F1 score of 0.95. We utilize a test set ratio of 0.3 over our augmented dataset of 22000 samples for all our experiments. We show the confusion matrix of the predictions in Fig. 6. We see that 0–50% and 100% plastics are almost perfectly classified. The network has confusion between 70 and 90% plastics. We note from previous sections that the FTIR is the most impactful modality, followed by the dielectric constants from the impedance analysis and the triboelectric charging and discharging responses. We study classification with each modality in isolation in the next section.
The ability to rapidly screen plastic products for recycled content has significant implications for regulatory compliance, material quality assurance, and sustainable manufacturing. Future research will focus on refining the methodology, expanding the applicability to different polymer types, and integrating real-time sensing capabilities into a portable diagnostic device for field applications. By developing an accessible and highly accurate technique for quantifying recycled content, this work contributes to the advancement of a circular economy by facilitating the reuse of recycled plastics and reducing environmental waste.
Classification with each sensing modality in isolation—A study
In the previous section, we demonstrated our proposed classification model that discriminates all eleven classes using a combination of all four modalities. In this section, we study classification with each modality in isolation by separately training individual classifiers for each modality50,51,52 and analyzing their performance on the various recycled plastics classes.
Modal 1—Investigating the impact of spectroscopic signature in classification
The FTIR modality is the most feature-rich and most impactful modality in terms of classification. Correspondingly, it is also the most popular in contemporary literature for deep learning-based classification of various materials like plastics, proteins, pharmaceuticals, etc. From qualitative observation, the signals are different in windows of wavenumbers for differing percentages of plastics. Wavenumber ranges of 800–900, 900–1000, and 1450–1500 are of particular interest. For our classification, we use the ranges 800–1000. For data augmentation, for each recycled plastic type (10%, 20%, etc.), we use the mean of the measured samples for the respective plastic type as the reference spectra and add a small amount of random positive or negative additive shift to the spectra within the range of its variation for the respective plastic type. Finally, we add a small white noise to the individual wave numbers for the purpose of regularization in deep learning. Using this data augmentation, we increase the number of samples from 220 to 22,000 samples. Unlike other modalities in the previous sections, we use a 1D Convolutional Neural Network instead of a Gaussian Process Classifier to handle the higher dimensionality in the classification process. Using only the FTIR data in this range, we obtain a classification accuracy of 65%. We attribute this performance to the successful classification of 10%, 30–70%, 90%, and 100% plastics, as shown in Fig. 7, which depicts the t-distributed stochastic neighborhood embedding (tSNE) that shows the separation of plastics of various percentages of recycled components after classification in the embedding space. In this visualization, tighter clustering of the same type of sample and better separation of these clusters indicates better classification.
Fig. 7: tSNE and confusion matrix of Gaussian Process classifiers trained on individual modalities to study their utility in isolation.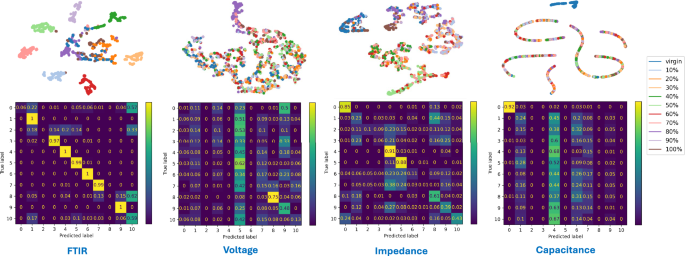
Results indicate that FTIR and Impedance are the most impactful modalities followed by voltage and capacitance.
Modal 2—Classification with dielectric/impedance in isolation
Performing a qualitative observation of the real and imaginary parts of the dielectric constants \({{\rm{\varepsilon }}}^{{\prime} }\) and \({\rm{\varepsilon }}{{\prime} }^{{\prime} }\), we see that there are clear variations of the dielectric constants for these plastic types, as shown in Fig. 6. We extract the real and imaginary parts of the dielectric constants for the deep learning discriminator network. We use sample statistics (mean and standard deviation in \({{\rm{\varepsilon }}}^{{\prime} }\) and \({\rm{\varepsilon }}{{\prime} }^{{\prime} }\)) to generate augmented samples to increase the data from 110 to 22,000 samples and enhance the training of our network. Using a Gaussian Process Classifier45 on these features, we find that plastics with 10%, 40%, 50% recycled components are the most differentiated while 80–100% classes are reasonably discriminated using this modality, as observed in the tSNE plot in Fig. 7.
Modal 3—classification with triboelectric charging and discharging in isolation
From qualitative observation of the non-normalized triboelectric charging and discharging curves, the peak heights and peak widths of the voltage for plastics with different percentages of recycled components are different, especially so for the 80% recycled plastic class. We extract the positive and negative peak heights and peak widths for the deep learning discriminator network. This serves as the encoding method for the voltage modality. We then use sample statistics (mean and standard deviation of peak heights and widths) to generate augmented samples to significantly increase the number of samples from 110 to 22,000 and make the data amenable to learning-based classification. Note, from Fig. 7, that plastics with 80% recycled components are the most differentiated using this modality.
Modal 4–classification with capacitance analysis in isolation
In observing the capacitance, the variation in the signal responses for different types of samples is within the noise range of the individual sample types. Therefore, we incorporate the cumulative standard error of the mean (SEM) statistic into our discriminator network to capture subtle and nuanced changes in these values. We use these sample statistics to generate augmented samples to increase the data from 110 to 22,000 and enhance the training of our network. The tSNE distribution in Fig. 7 for this modality after classification indicates that capacitance is useful to discriminate virgin plastics.
The techniques used in this study offer a range of spatial resolutions and depth sensitivities. While impedance and capacitance techniques provide bulk-averaged information across the sample thickness, ATR-FTIR is a surface-sensitive technique with a micrometer-scale penetration depth. The triboelectric measurements represent a mesoscale surface interaction. In real-world applications with potentially non-uniform recyclate distribution, measurements across multiple regions and depths may be required for representative assessment. Additionally, poor compounding may manifest as broadened or multimodal signals in dielectric and triboelectric responses
The current model was developed using mechanically recycled PET from a single, bottle-grade source. While this provides controlled data for model training, broader deployment will require expansion to PET from textiles, thermoforms, and other post-consumer sources. Future work will incorporate samples from diverse recycling streams and explore transfer learning strategies to improve generalizability across polymer types and feedstock heterogeneity.