

Fresh data from the Institute for Supply Management (ISM) showed on Monday the Services PMI easing a tad to 54 in March from 56.1, coming in short of expectations at 55 and signalling some loss of momentum in the sector.
Inflation pressures gathered traction, with the Prices Paid Index edging higher to 70.7 from 63. Hiring conditions are still soft, with the Employment Index falling to 45.2 from 51.8. Meanwhile, new business picked up some momentum, with the New Orders Index increasing to 60.6 from 58.6.
Market reaction
The Greenback remains well offered at the beginning of the week, motivating the US Dollar Index (DXY) to breach below the key 100.00 support to hit new two-day lows in the wake of the release.
US Dollar Price Today
The table below shows the percentage change of US Dollar (USD) against listed major currencies today. US Dollar was the strongest against the Japanese Yen.
USDEURGBPJPYCADAUDNZDCHFUSD-0.35%-0.40%-0.11%-0.24%-0.49%-0.47%-0.35%EUR0.35%-0.04%0.20%0.12%-0.16%-0.14%-0.02%GBP0.40%0.04%0.25%0.12%-0.12%-0.11%0.04%JPY0.11%-0.20%-0.25%-0.12%-0.40%-0.38%-0.25%CAD0.24%-0.12%-0.12%0.12%-0.25%-0.24%-0.11%AUD0.49%0.16%0.12%0.40%0.25%0.00%0.15%NZD0.47%0.14%0.11%0.38%0.24%-0.01%0.15%CHF0.35%0.02%-0.04%0.25%0.11%-0.15%-0.15%
The heat map shows percentage changes of major currencies against each other. The base currency is picked from the left column, while the quote currency is picked from the top row. For example, if you pick the US Dollar from the left column and move along the horizontal line to the Japanese Yen, the percentage change displayed in the box will represent USD (base)/JPY (quote).
This section below was published as a preview of the US ISM Services PMI report for March at 11:30 GMT.
US ISM Services PMI Preview
The United States (US) Institute of Supply Management (ISM) Services Purchasing Managers’ Index (PMI) data for March is scheduled to be published today at 14:00 GMT.
The ISM report is expected to show that the service sector activity expanded again, but at a moderate pace. The Services PMI is estimated to arrive at 55.0, lower than 56.1 in February. Investors will pay close attention to the Services PMI data as the related sector accounts for two-thirds of the US economy.
Apart from the Services PMI, investors will also focus on sub-components of data, such as Employment Index, New Orders Index, and Prices Paid.
Theoretically, weaker-than-projected US ISM Services PMI data boost dovish Federal Reserve (Fed) expectations in the near term. However, upbeat figures would do the opposite.
How could US ISM Services PMI data affect EUR/USD?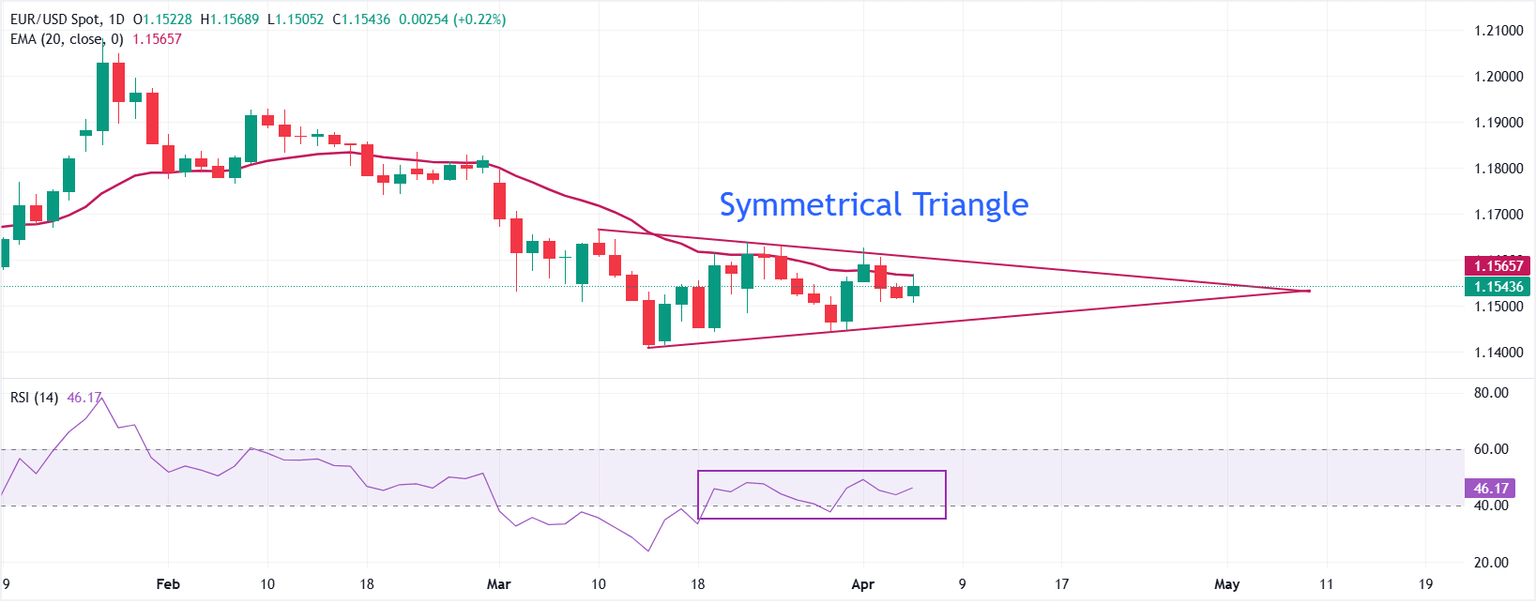
EUR/USD trades 0.25% at around 1.1544 during the late European trading session on Monday. In the daily chart, price holds between a descending resistance trend line from 1.1666 and an ascending support line from 1.1408, keeping the near-term bias neutral with a slight downside tilt as the pair trades just below the 20-day Exponential Moving Average (EMA) near 1.1566.
The 14-day Relative Strength Index (RSI) stays inside the 40.00-60.00 range, reflecting a contracting structure, which is typically followed by a volatility expansion.
Immediate resistance emerges at the 20-day EMA around 1.1566, with the descending trend line reinforcing a cap near 1.1600; a daily close above this zone would open the way toward the March 10 high at 1.1667. On the downside, initial support aligns with the rising trend line near 1.1500, and a break through this level would expose the price towards the March low at 1.1411.
(The technical analysis of this story was written with the help of an AI tool.)
GDP FAQs
A country’s Gross Domestic Product (GDP) measures the rate of growth of its economy over a given period of time, usually a quarter. The most reliable figures are those that compare GDP to the previous quarter e.g Q2 of 2023 vs Q1 of 2023, or to the same period in the previous year, e.g Q2 of 2023 vs Q2 of 2022.
Annualized quarterly GDP figures extrapolate the growth rate of the quarter as if it were constant for the rest of the year. These can be misleading, however, if temporary shocks impact growth in one quarter but are unlikely to last all year – such as happened in the first quarter of 2020 at the outbreak of the covid pandemic, when growth plummeted.
A higher GDP result is generally positive for a nation’s currency as it reflects a growing economy, which is more likely to produce goods and services that can be exported, as well as attracting higher foreign investment. By the same token, when GDP falls it is usually negative for the currency.
When an economy grows people tend to spend more, which leads to inflation. The country’s central bank then has to put up interest rates to combat the inflation with the side effect of attracting more capital inflows from global investors, thus helping the local currency appreciate.
When an economy grows and GDP is rising, people tend to spend more which leads to inflation. The country’s central bank then has to put up interest rates to combat the inflation. Higher interest rates are negative for Gold because they increase the opportunity-cost of holding Gold versus placing the money in a cash deposit account. Therefore, a higher GDP growth rate is usually a bearish factor for Gold price.