
This week is a post about set restarts but it’s not the usual set restart post. I’ve accepted our new normal for set restarts, so instead of demonising them I’d rather quantify their impact. They’re not changing this season.
Regular readers will know there’s nothing I love more than quantifying things, except maybe players wearing high socks or the increasing number of players wearing challenger boot brands.
With that in mind, this week I’m going to put a point value on receiving a set restart in during a set.
But before we get into that analysis, I’d first like to take somewhat of a victory lap.
About a month ago I wrote about how powerful consecutive play the balls were this season. Fast forward to Saturday evening’s broadcast of Melbourne versus THE Dolphins, and what do I see on Fox League?
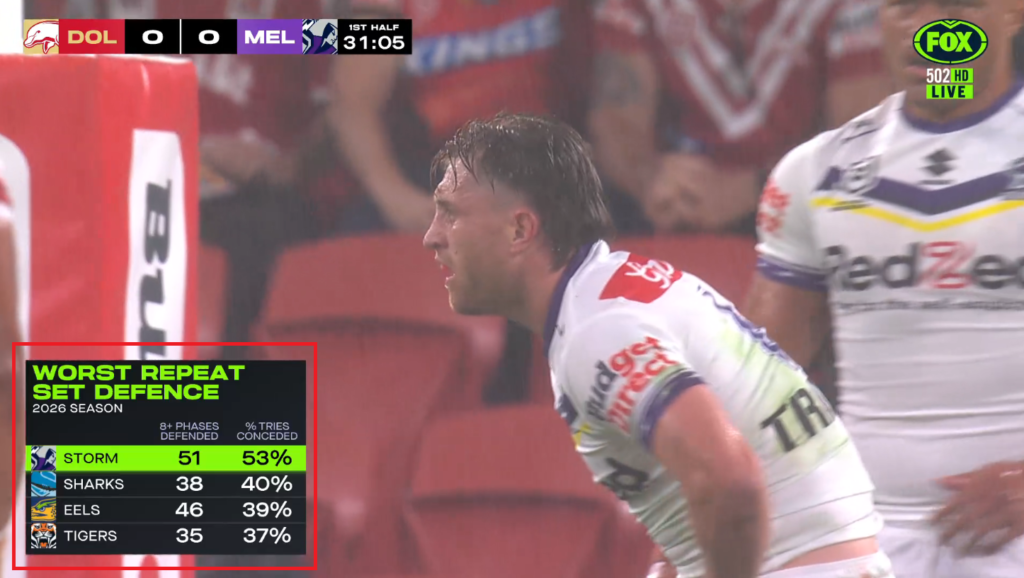
Of course, the first thing I did was fire up the Leo pointing meme on social media.
If I’m not on a future “Most influential NRL people” list, then I don’t know what more I can do.
My understanding of this is that the Fox Sports Lab (who don’t get nearly enough credit) came to this independent of my own usage of it, and were working on over the same time frame. In no way am I implying they’ve lifted my work. Great minds think alike etc. There are very few completely “new” ideas in analytics, mostly just new applications of existing ideas and most “new” stuff is enabled by technology.
Back on track, they’re tracking it slightly differently as well, but it’s coming up with similar conclusions. Eg Melbourne are terrible if you make them defend more than a traditional set worth of possession. Which as a regular reader, you’d have known for at least a month. But it’s wonderful to see the broadcast of the game moving forward like this.
Now I can’t survive alone on the inflation of my own ego by this sort of thing alone, so if you’re enjoying this type of content then feel free to drop a donation to the value of your choosing via PayPal or Ko-Fi (especially if you’re in New Zealand). There’s more links at the end of the article. Support independent rugby league anaylsis.
Which brings us to the topic of today’s post. On the back of the consecutive play the balls work I’d done, and years of delving into set restarts, I had also been thinking about an adjusted set metric. This wouldn’t be exactly the same as the just wrapping a set number around the consecutive play the balls number, or making a phased set count similar to the Fox Sports Lab number.
Instead, I undertook some rudimentary feature engineering and create an adjusted sets count that will let me do a few fun bits of analysis I’ve wanted to do for a while. Given that a set restart instantly creates a completed set no matter the tackle number, I wanted to remove the “complete” notion and look at that run of possession as a whole. When did this phase of possession start and when did it end? I wanted to answer that question, and an adjusted set count was the answer.
What is an adjusted set count? At a basic level, it’s the total sets for a game minus set restarts awarded. You could work it out per game just by subtracting the number of set restarts from both total sets and completed sets, excluding some edge cases where multiple set restarts were called in a single adjusted set.
A more detailed explanation would be that for any set that includes a set restart, I’m looking at the start of the sequence of plays until the a set is completed by a non set restart event, regardless of the tackle count and play the balls. If a team had three tackles, received a set restart, then completed that set to tackle 6, I’d be counting that as just one adjusted set. If there are multiple set restarts within the same string of possession, then it’s still counted as just one adjusted set.
Thank you for reading The Rugby League Eye Test. Subscribe below to receive new posts in your inbox and support independent rugby league content.
I could do this for penalties as well as those are treated as completed sets, but there’s a distinct stoppage of play between the penalty and ensuing start of play. With a set restart, for better or for worse, things just keep moving. That’s the type of possession I want to track and see what the value of a set restart is.
Why use them? The benefit from my point of view isn’t just creating a more accurate set number, although that’s part of it. We end up with just over 69 adjusted sets per game, down from nearly 78. Completion rates are juiced by set restarts, so an 80% completion rate is probably closer to 76% when adjusted. But that’s less of an interest to me as well because completion rates are only useful to a point, where chasing high rates reduces risk and stifles attack. Goodhart’s Law and all.
What it does allow me to do is to calculate the probability of scoring at more realistic level. The one part of the basic feature engineering I didn’t mention earlier was that I also included a flag as to whether or not a set included a set restart, how many set restarts were awarded and whether a try was scored from that adjusted set.
You can probably see where I’m headed here.
The end game of this adjusted set count was to have a historical probability of scoring a try from a traditional set with consisting of 0-6 tackles, and one from a set including a set restart of any length.
Keep in mind this is NOT like my expected points (ETXP) model where I look at each play the ball in isolation and calculate a try probability. This is the likelihood of an adjusted set start resulting in a try.
Now that we have the data cleaned for this purpose, I can give you the number. These are for any game played since Round 3, 2020 when set restarts were introduced.
To set the scene, since the start of the decade, a try is scored on just under 10% of adjusted set starts. A rough calculation from most games would indicate that, with about eight tries a game scored from ~80 total sets per match.
A traditional set (no set restart awarded), has a try scored 8.9% of the time. Assuming that try is worth 5.5 points based on a 75% goal conversion, the expected point value of a normal set is 0.52 points.
An adjusted set that includes a set restart sees a try scored 22.5% of the time, and multiplied by 5.5 is worth 1.24 points.
Yes, a single set restart being called in an adjusted set is worth 2.4x the expected points than that of a traditional set with no restart of the tackle count. That’s a substantial benefit. Assuming 8 set restarts are called in a game with four given to each side, that is worth an extra 5.8 points per game over a match with zero set restarts.
If a team is awarded two set restarts in an adjusted set, then that increases again to 30.4%, or 1.67 expected points and 3.2 times more than a normal set. An adjusted set with three set restarts in in jumps even higher than that, but the incidence of that occurring is so low the numbers aren’t statistically significant. Note that the number of set restarts awarded does not have a strong correlation with margin of victory or points scored, but it does increase the probability of scoring.
The value of this has also changed over time and it’s mostly increasing. Looking at Rounds 1-9 this decade (3-9 for 2020), the probability of scoring from an adjusted set including a set restart has been on an upward trajectory every season.
Until 2026.
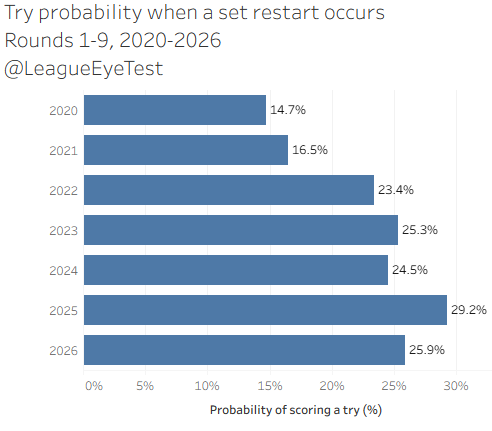
Starting from just 14.7% in 2020 and peaking in 2025 at 29.2%, the probability of scoring a try when a set restart was increased every season other than 2024, which dropped by less than 1% from 2023.
Yet in 2026, that number has dropped back to 25.6%. Of course, we’re still seeing more tries scored from a set including a set restart as the raw volume of them has increased by over 50%, but the rate of them resulting in tries has declined.
It’s the inverse of what has happened for sets without a set restart, where the probability is higher than ever.
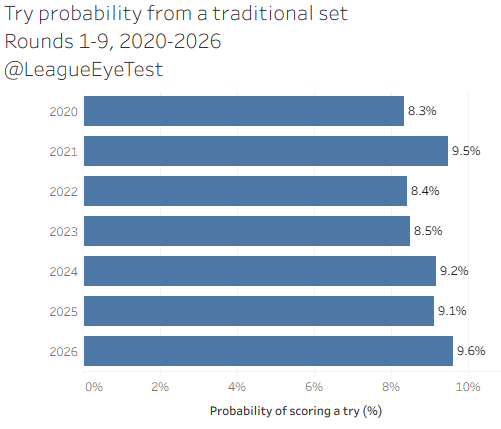
9.6% of “normal” sets have resulted in a try this season, higher than the previous peak back in everyone’s favourite season, 2021, where it was 9.5%.
We’re in a strange situation in 2026, where set restarts are producing more tries by volume, but teams aren’t converting them at the same rate. Yet for normal sets, the attacking team is performing better than any other year this decade. You’ll notice that 2021 also had an increase for tries from a traditional set.
Edit 1:33pm 04/05/2026: I don’t usually do this, but thanks to a fantastic comment on reddit from I felt the need to. They suggested that the decrease in 2026 was due to the additional zone from 20-40m out might be the reason for the decline in 2026. And they’re right.
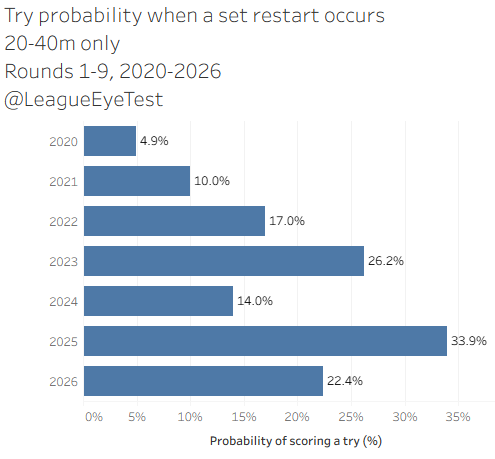
From 20-40m out, the drop is about 10%, showing that the new area is reducing try conversion when a set restart occurs. Interestingly for traditional sets, the conversion rate of them between 20-40m out is up as well, just the same as 2021.
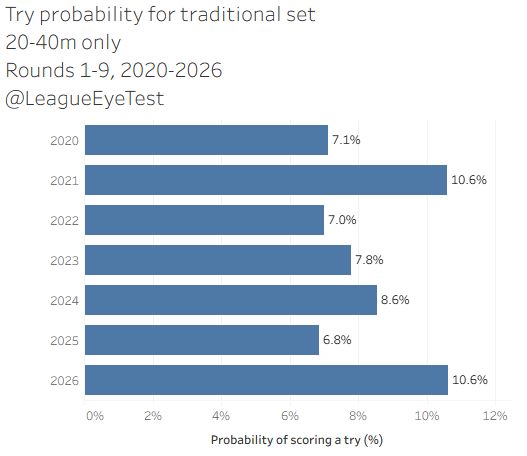
Given the volume of traditional sets occurring over normal sets that’s not an inconsequential number. And when you start a set past the 40 metre line this year, the try probability is slightly down for a normal adjusted set and slightly up for an adjusted set with a set restart.
It’s another data point to chalk up that it’s not only the rules themselves that are producing these results and huge scores.
The additional fatigue could be another factor, but the average absolute margin after 10 minutes this season is 4.08 points. In 2021 it was just 3.56 points and in 2022 it was 2.58. There are sharp spikes in points scored at the back end of halves pointing to fatigue from rule changes, but they’re also occurring at the start of the game when fatigue should be less prevalent. Attacking structures have become more involved, and defenses are struggling to read them no matter the level of fatigue, and points are coming from further away.
As a side note about points and margins, I’d highly recommend this read by friend of the site The Cruncher which delves into just how unpredictable the 2026 season is. You might be surprised by the results.
When you look at game margin and the probability of scoring when awarded a set restart, there’s a noticeable difference between teams leading and those trailing. A team ahead on the scoreboard given a set restart during an adjusted set produces a try 24.9% of the time. When behind, that only happens 20.2% of the time.
Why was 2025 such an exciting season? Possibly because the team trailing scored a try 31.6% of the time when a set restart was awarded. We saw comebacks and closer games, and a team could reign in a lead. In 2026, that number has plummeted to just 21.0% and we’re seeing margins balloon as a game progresses.
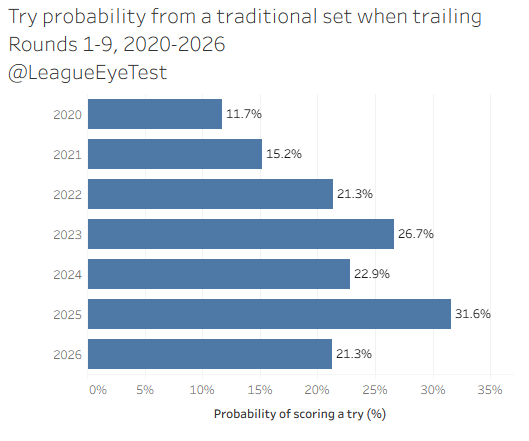
The value of a set restart to a team behind on the scoreboard hasn’t been lower since 2021, and never been higher for a team leading (29.7%). If you’re ahead this year, it’s easier to use slower ruck speed and shorten the 10 metres to maintain a lead.
The value of the set restart also declines as you approach the try line, which is something I’d mentioned a few years back. Once a defending team has their backs against their own line, the perceived benefit of continued play is removed as they’re already set defensively. That’s proven in this data, as the 2.4x multiplier drops down to less than a 10% increase as you move inside the red zone. It’s beneficial, but the impact is lessened.
The other interesting part now is being able to use these numbers by team. The consecutive play the ball numbers I’ve shown previously give an idea of how teams are defending longer stretches of possession, and this will give us an understanding of how teams are defending traditional sets and those with set restarts. A bigger picture view if you will.
I’d like to note that on a team level there’s probably a margin of error around +/- 1% given some of the edge cases in defining what is an adjusted set. These are also much smaller sample sizes for a single season but should be indicative of where teams are succeeding or struggling. I’m time poor and there are most likely some errors in this data set, please understand. As always, I’m not letting perfect be the enemy of good.
Let’s look at each team from 2026 by how often a try is scored split by traditional sets (without a set restart) and those with a set restart. Here’s traditional sets by team.
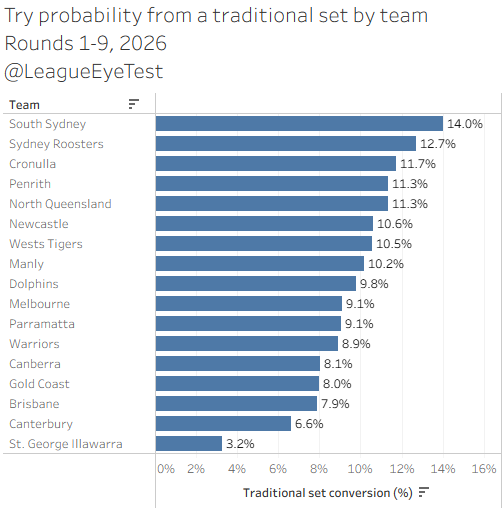
South Sydney are the most potent on a normal adjusted, scoring a try 14.0% of the time, which shouldn’t be a surprise as they have the highest per game point scoring average this season. The Roosters are next at 12.7%, followed by Cronulla at 11.7% with Penrith and North Queensland at 11.3% each.
The worst teams at converting a are the Dragons by a significant margin, with just 3.2% of normal sets resulting in a try. Canterbury are second last at 6.6%, with Brisbane, Canberra and the Gold Coast all around 8%.
To me this passes the Eye Test as if you asked me who were the best attacking teams, I’d have picked from that list, and the worst attacking teams would also come from that bottom group. The exception would be Brisbane, but we’ll see why that is the case in a second.
Here’s each team by the conversion of their adjusted sets which include a set restart. As noted above we’re now looking at a very granular level and some of these teams don’t have more than 30 adjusted sets which involve a set restart. Small sample sizes etc…
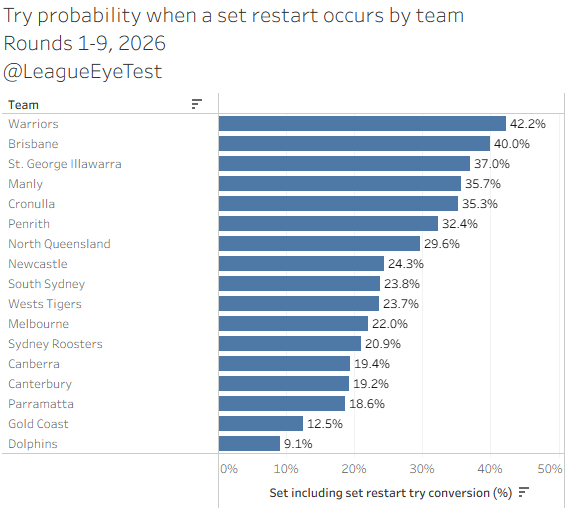
The first thing that stands out is the numbers are much bigger, and there’s a lot of variation hidden in the aggregate. The Warriors place first, scoring a try on 42% of their adjusted sets which involve a set restart. The reason for Brisbane’s form this season might be seen here, as they lethal at scoring when they receive a set restart, also converting at over 40%.
St George Illawarra have the third best percentage of tries form an adjusted set involving a set restart at 37%, which also correlates with my consecutive play the ball data. The Dragons were decent at scoring tries from eight plus successive play the balls, and had four of them against Melbourne, and every one involved a set restart. I mean look at this from the NRL site’s play by play for that match.
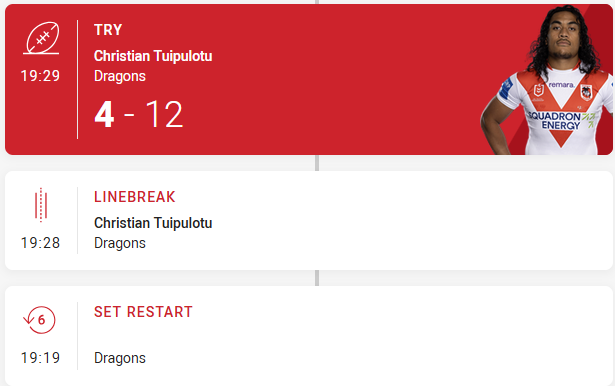
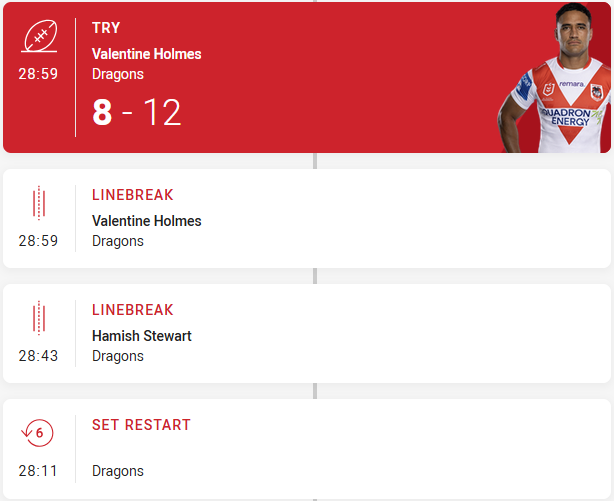
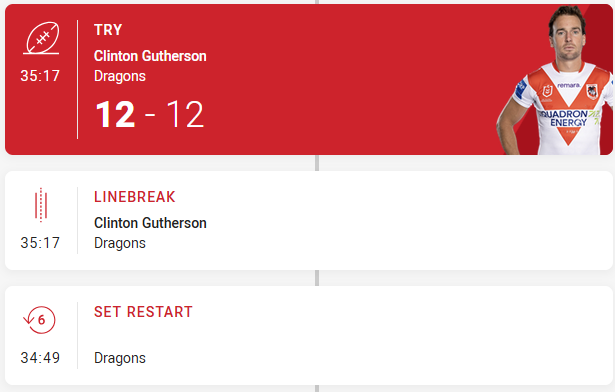
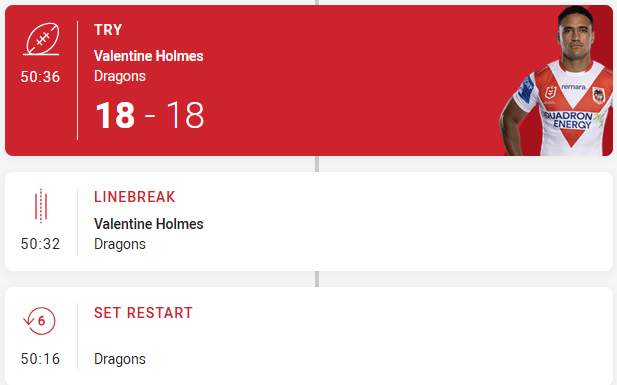
This paints a picture of their overall attacking ability being not as dire as it initially seems (although it’s still very bad), their main issue is getting enough possession to a point where they can pressure the line. If you need that many leg ups to score a try it’s probably not a good sign. It also again points to just how bad Melbourne’s defense of consecutive possession has been, but I went over that last week and things aren’t improving.
The worst teams at converting set restarts includes a list of more usual suspects in the Gold Coast, Parramatta, Canterbury and The Dolphins.
The last thing I’m going to do today with this data, is plot each teams’ normal and set restart conversion percentages against each other, with the plot split into quadrants by league average for both measures.
Below is the plot for each team this season after nine rounds. I’ve labelled each quadrant as a guide to what each area represents. Top left is teams who over index on set restart tries, but under index on scoring from traditional sets. Top right are teams who over index on converting traditional and set restart sets. Bottom right is teams who over index on converting traditional sets into tries but convert set restarts into points lower than league average. And bottom left is teams who convert any type of set worse than league average. These will also be impacted by where teams are receiving or conceding their set restarts.
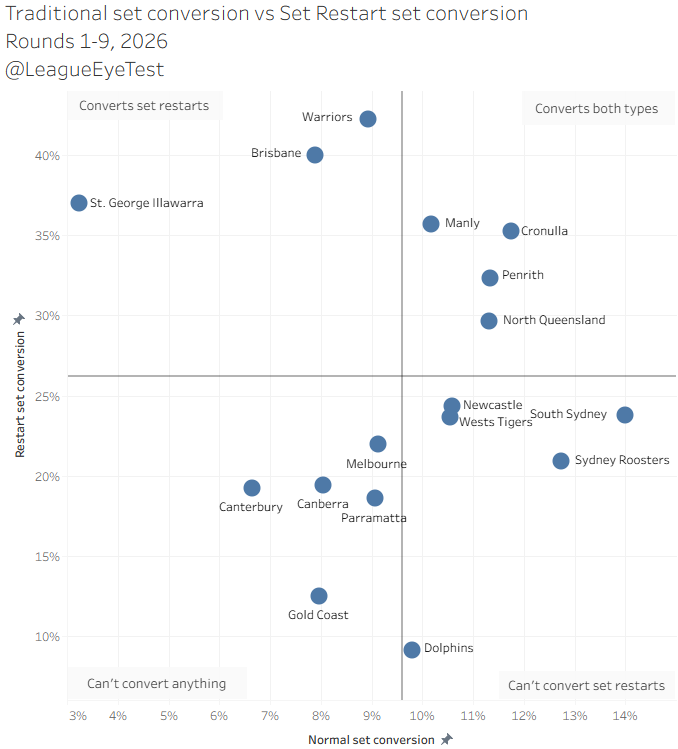
To me this is a great way of quickly visualising how teams are converting their sets, with some obvious clustering occurring. I can clearly see that the Dragons convert set restarts really well at 37%, but struggle to score without them at just 3%. Brisbane and the Warriors are strong at crossing the line when given a set restart, both north of 40%, but not far off league average for normal sets at just under 10%.
Manly, Cronulla, Penrith and North Queensland are the best four teams at scoring points from any type of set. The Knights, Tigers, Roosters and Rabbitohs convert normal sets to tries at a higher rate than league average, but are slightly below league average when given a set restart.
The Dolphins are on an island of their own, struggling to convert anything at a higher rate than 10%. They are second in the NRL for handling errors per game, which indicates it’s of their own doing. They’re close enough to “Can’t Defend Anything” that I should probably group them together,
Lastly, we have the teams who convert normal and sets with a set restart worse than league average – Canberra, Canterbury, Gold Coast, Parramatta and Melbourne.
By now you know how things are done at the Eye Test, so you know that we’ll also look at this same chart defensively.
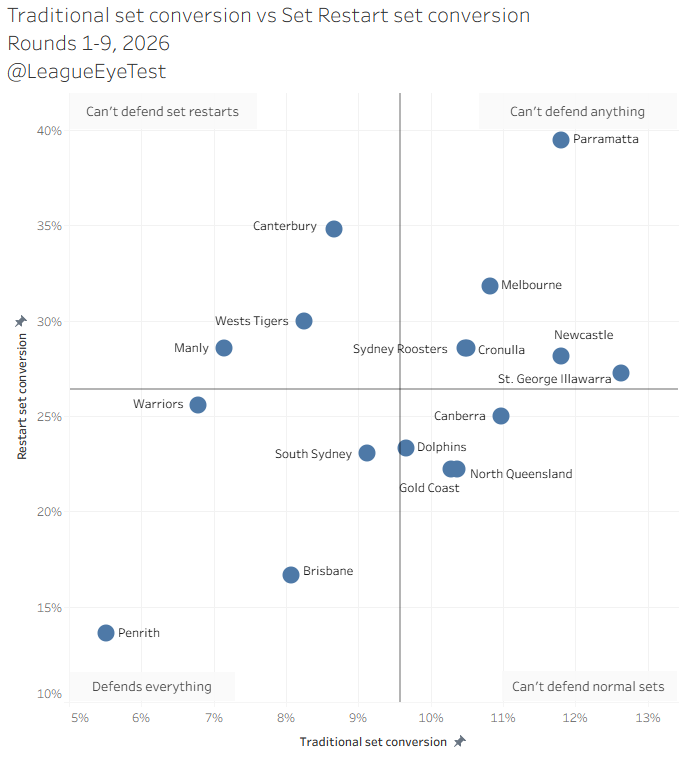
The broken Eels are leaking points everywhere, as are Melbourne but not at as high of a rate. The Roosters, Sharks, Knights and Dragons are also unable to defend either type of set better than league average.
There are cracks showing in the Bulldogs defense this season, and here we can see they are unable to defend set restarts, giving up a try on 35% of them. The Tigers and Sea Eagles are also struggling when giving up extra play the balls in succession.
The Raiders, Dolphins, Titans and Cowboys are the freak teams. They have some how worked out how to defend a set restart better than league average but are lost at sea trying to defend a traditional set. Surely a sign of teams not focused defensively for the full eighty minutes.
And lastly we have the Penrith quadrant, where they defend everything significantly better than league average. The Warriors, Brisbane and South Sydney also sit here, and the Broncos were far closer to Penrith before their loss on Saturday to the Roosters. Yet Michael Maguire will still cop it from certain sections of the media.
Thanks to adjusted set counts, now we know just how valuable a set restart is. It multiplies the probability of scoring a try by 2.5x for a single restart, and over 3x when multiple restarts are called in a single half. The closer to the line you get, the smaller that impact is.
That probability has been relatively consistent over the decade, but 2026 has changed things. We’re seeing a higher rate of tries scored from possession without a set restart, and a lower rate of tries scored when a set restart is called.
By overall volume there’s more of the latter and about the same of the former, which makes sense when there’s been a 50%+ increase in set restarts. The teams who can defend both types of sets will be the ones who will succeed this season, and thus far it’s hard to look past Penrith again.
I’d like to finish up this week with some minor Sockwatch updates.
The first Sockwatch update for 2026 this week is the number zero.
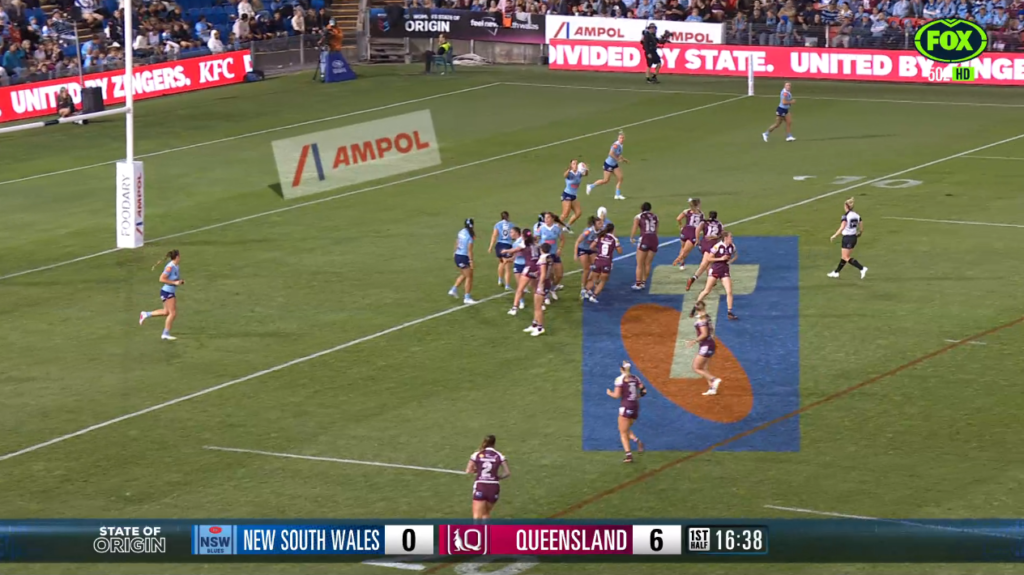
Yes, 0. That is the number of players during the opening women’s Origin match last Thursday evening wearing high socks. Referee Belinda Sharpe was the only person on the field to wear their socks at knee height, as you can see in the above image.
I’ve been informed by friend of the site Kennedy Cherrington that this is due to the players kit only including short socks, so I can’t blame the players for this one.
Give the girls their long songs back please.
Game 1 also produced some Sock Crime Charges, which those of you who follow the Eye Test on Social media will be aware of. Not to the extent of the nine players charged from a recent Dolphins game, but a significant number still.
For the uninitiated, a Sock Crime charge may arise where a player wears a traditional sock cut off at the ankle over a pair of grip socks. I am all for players wearing the gear that gives them the best performance or gives them a feeling of confidence in their footwork. This is about making it look professional.
Just look at the state of these socks from Olivia Kernick.
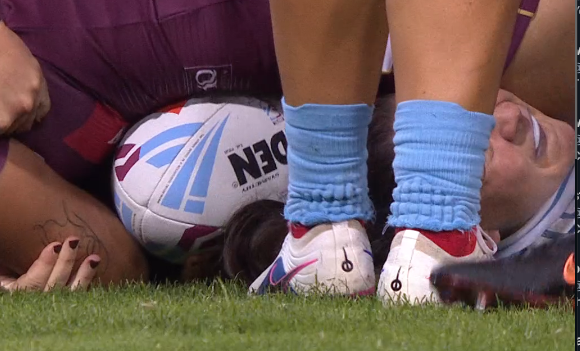
Some of her team mates weren’t much better.
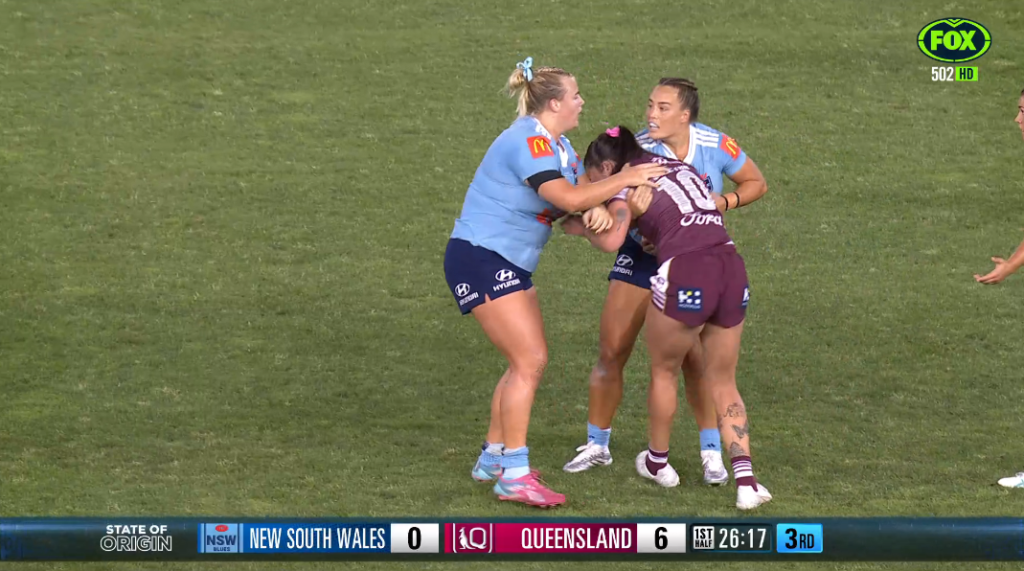
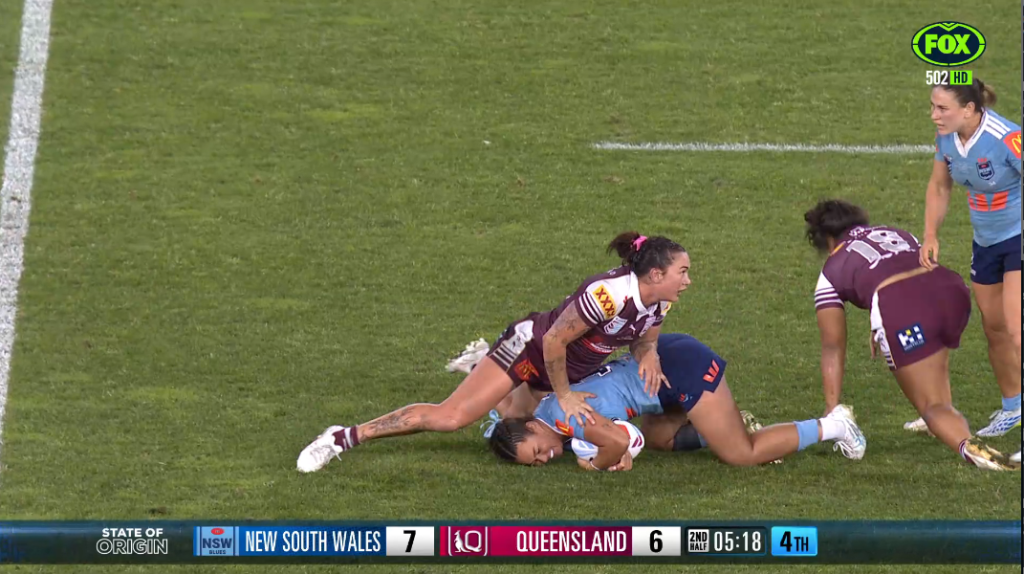
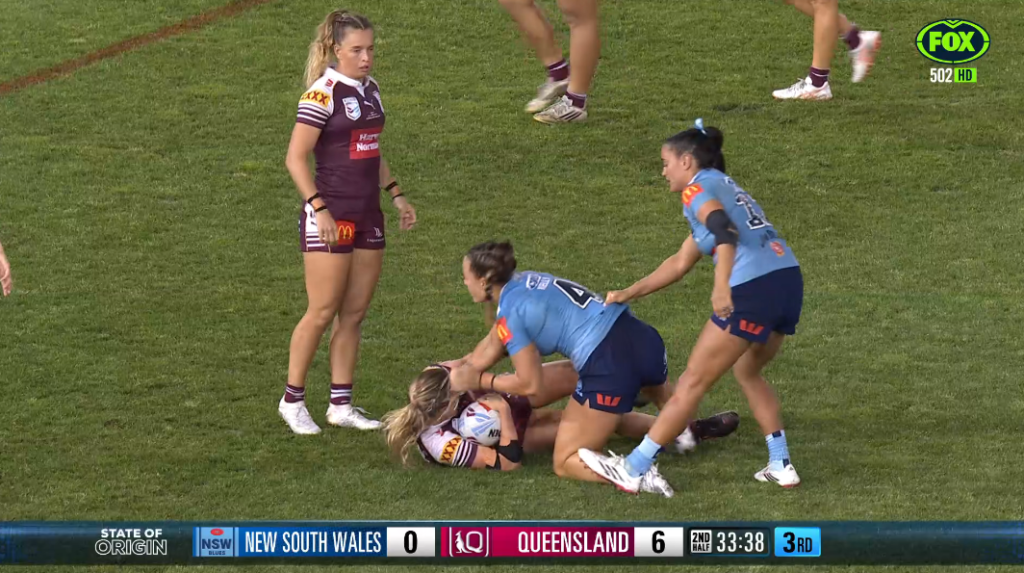
Stemming from this, the Sock Crime charges from Origin Game 1 are as follows:
Olivia Kernick – Grade 3
Ellie Johnston – Grade 2
Yasmin Meakes – Grade 2
Jess Sergis – Grade 1
Kennedy Cherrington – Grade 2 but downgraded to Grade 1 for self reporting to Eye Test HQ
No Queenslanders were charged following the match. Maybe they just get Origin socks?
—
The Rugby League Eye Test produces artisan small batch rugby league analysis that you can’t get anywhere else. In an era of low effort AI slop, the Eye Test offers hand crafted data and independent analysis that you can trust came from a human brain.
This sort of quality workmanship takes time and effort. Quality independent, ad-free rugby league content doesn’t exist without support from readers and the community. The Rugby League Eye Test operates under a value for value model.
If you’ve enjoyed this post, and are in a position to do so, then you can donate an amount of your choice through the PayPal link below, the Kofi page, or through the support page on the site’s menu. You can decide the level of contribution based on the value you believe the Eye Test provides to you.
Support The Rugby League Eye Test
For those of you in areas (such as New Zealand) where there’s issues with PayPal donations for some reason, I’ve set up a Kofi page as well for donations.
If you’re not in a position to donate financially, you can still support the site by sharing this post with others who might enjoy it. Support and promote independent rugby league content.