
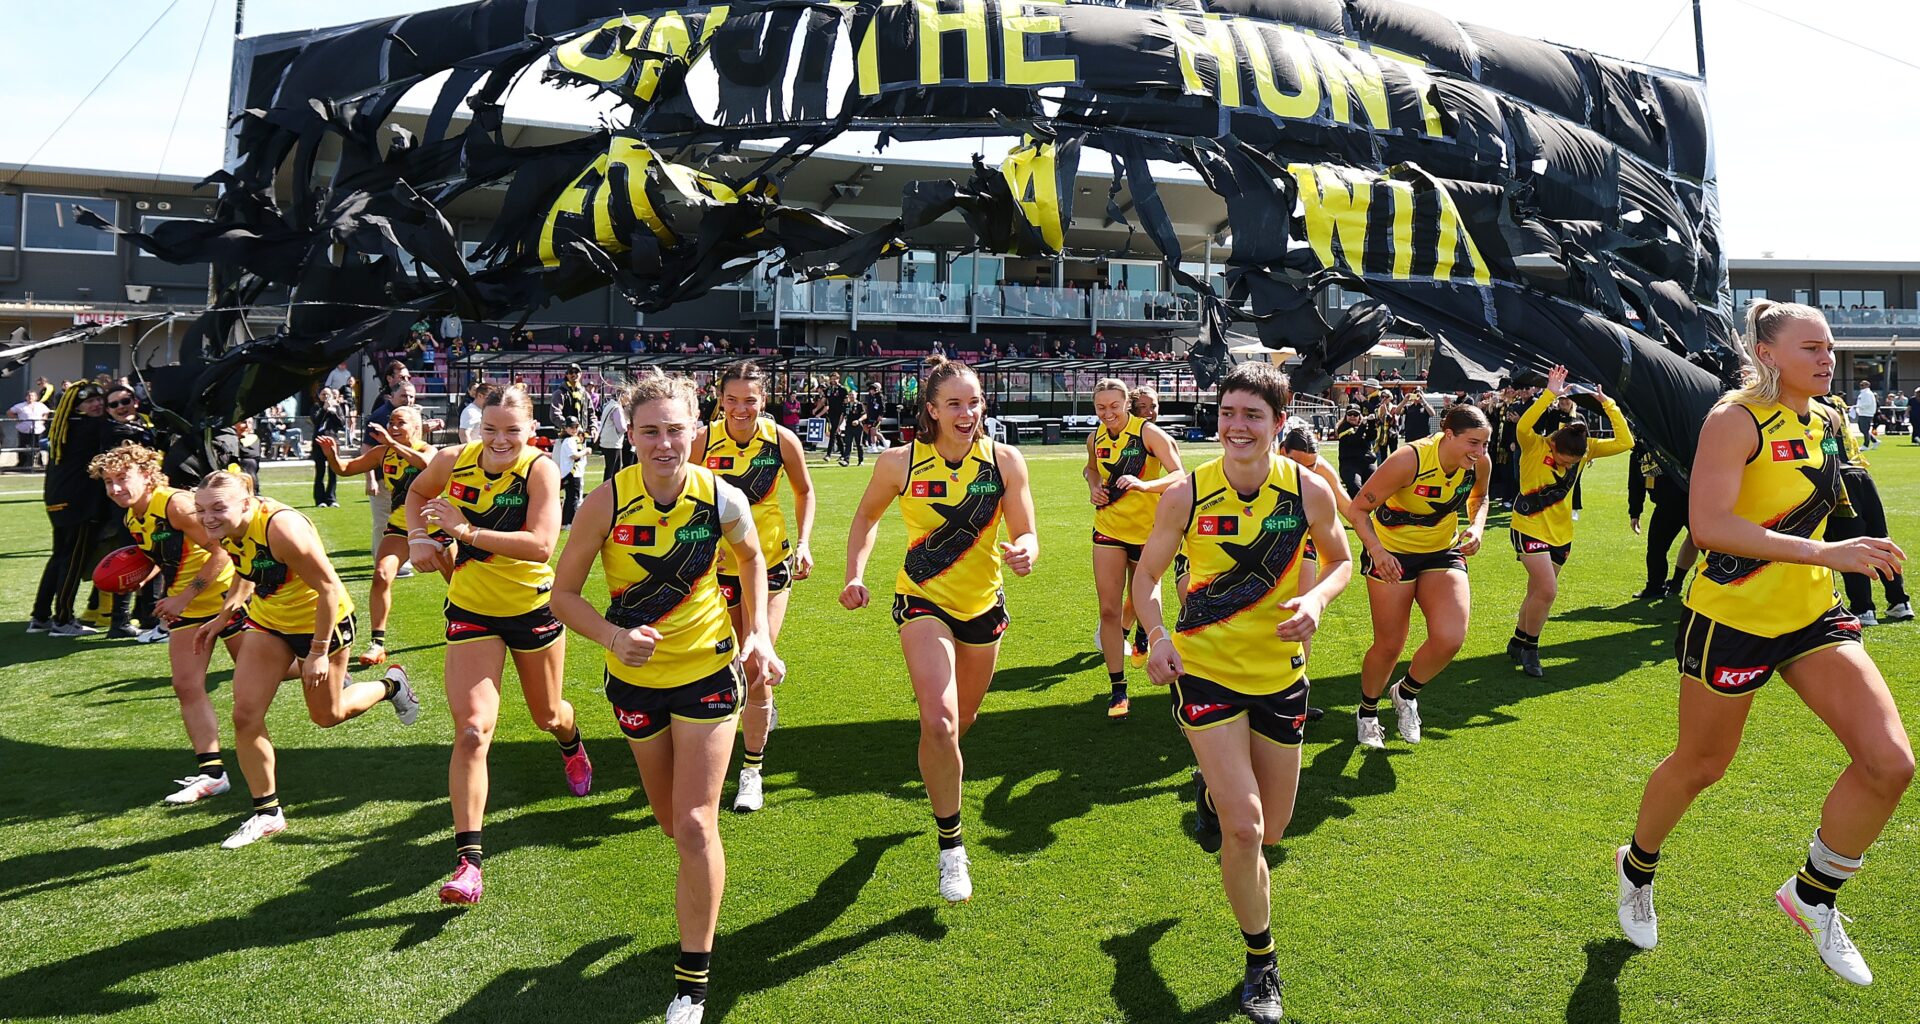
Richmond players take to the field during the AFLW R4 match against Narrm (Melbourne) at Casey Fields on September 6, 2025. Picture: AFL Photos
VENUES in footy are about tribalism and ownership. But they also play a huge part in game style, tapping into specific skills possessed by different players and teams.
Fast running footy looks best on a big deck, while contested beasts shine in small confines.
In the AFLW, the return to community grounds has seen greater variation in ground size than regularly found in the men’s competition, from the tiny surface of North Sydney Oval, to the expanses of Mineral Resources Park.
Since the AFLW expanded to the full complement of 18 teams in 2022 S7, 21 different venues have been used for five or more matches, and with such a broad range of decks comes varied experiences.
General view during the match between the Western Bulldogs and Brisbane at Norwood Oval in Gather Round, 2025. Picture: Getty Images
The gap between the largest playing surface – West Coast’s home of Mineral Resources Park – and the smallest – North Sydney Oval – is a whopping 6243.9 square metres, or more than 1.5 acres of land.
So small is North Sydney Oval in fact, that it is more than 3,000 square metres smaller than the next smallest venue regularly used in that time, Henson Park.
Logic would suggest that a smaller venue would mean better game play, easier transition, and higher scoring than that of larger surfaces used, and while North Sydney’s average score of 94 combined points per game sits second of those 21 venues in that time, there is no direct correlation between surface area and scoring.
In fact, of the top 10 venues for average scores, seven sit in the top 10 for land mass. The outliers; North Sydney Oval (21st for size), Henson Park (20th), and GMHBA Stadium (15th).
Venue
Surface area
Avg combined score
Manuka Oval
16587.6
99.6
North Sydney Oval
10602.9
94.0
Alberton Oval
16689.7
88.0
Casey Fields
16587.6
86.5
Mineral Resources Park
16846.8
84.9
Springfield Central Sport Complex
16185.5
84.0
People First Stadium
16380.3
83.8
Henson Park
13638.4
82.8
GMHBA Stadium
15221.0
80.7
Arden Street Oval
16336.3
78.2
What surface area does often dictate, however, is in the style of football different grounds allow sides to play.
In weekly preparation for games, coaches have confirmed that the size of the deck does impact selection at times, erring for an extra runner when heading to a larger venue, or another tough contested ball player on smaller grounds.
On the cramped confines of North Sydney Oval, transition footy is largely off the cards. Clubs go end-to-end in a flash, before getting stuck in congestion inside 50. The venue averages the most tackles inside 50 (34.4) and clearances (57.2), and the fewest marks (67.8) and bounces (0.4) pointing to repeat stoppages and numbers in-tight.
It is the ideal kind of venue for clubs that want to play a contested style of footy – something Fremantle, Gold Coast, and Port Adelaide have thrived on in recent years. It is conducive to keeping things tight and pressured, and limits opportunities for clubs to use slick ball movement and run and carry.
A general view of North Sydney Oval. Picture: AFL Photos
Meanwhile larger grounds like Mineral Resources Park, Manuka Oval, and Alberton Oval allow clubs to use that run and carry more regularly and use the ball at a greater efficiency.
Teams who have caught the eye with cutting ball use and dash outside the contest like Melbourne, North Melbourne, and Brisbane make good use of opportunities on expansive grounds.
That’s not to say one kind of venue is better for the game than the other. Rather, such a breadth of venue sizes provides the League with a chance to showcase every aspect of the code, and those that come out on top are the clubs who can adapt in every phase of the game.
Unsurprisingly, the home decks of historically dominant teams North Melbourne, Melbourne, Adelaide, and Brisbane possess the highest average home scores, and those of teams that have struggled recently – Collingwood, Fremantle, the Western Bulldogs, and Essendon – have the lowest.
Venue
Avg. Home Score
Casey Fields
58.9
Arden Street Oval
58.8
Thomas Farms Oval
53.0
Springfield Central Sport Complex
49.0
Alberton Oval
46.7
North Sydney Oval
45.4
Norwood Oval
44.2
GMHBA Stadium
42.8
Henson Park
39.1
People First Stadium
38.4
Kinetic Stadium
38.0
Manuka Oval
38.0
IKON Park
36.8
Mineral Resources Park
36.2
Swinburne Centre
36.1
RSEA Park
34.9
Mars Stadium
34.4
Windy Hill
33.7
Mission Whitten Oval
30.6
Fremantle Oval
30.5
Victoria Park
30.5
Notably, Greater Western Sydney’s home away from home Manuka Oval averages the highest away score of any regularly used ground in the country, helped along by heavy scores from Melbourne, Adelaide, and Essendon who all put on more than 80 points against the Giants at the venue.
Clubs must plan as much for their direct opposition as they do for the space with which they are afforded to execute the game plan, and although creating a fortress at home can prove valuable, being able to win anywhere, in any amount of space, if the most important asset of all.