
Recently I was putting together my interchange rotation charts, and noticed that the same data could be used to track Head Injury Assessment (HIA) interchanges. This data would allow me to see whether the increase in fatigue had caused more head knocks or if some teams were being affected by them more than others.
The main thing I wanted to quantify was how many minutes were lost due to HIAs, not just the occurrences of them . How are they tracking this season compared to last, and are some teams affected by them more than others?
Unsurprisingly there’s no easy way to collate these numbers, and they’re not publicly tracked anywhere. However, they are publicly available through the play by play (in the loosest sense of the term) from the NRL.com match centre.
Before getting too deep into the weeds, I thought I’d check with the subject matter expert here and got in contact with friend of the site and the people’s champ Brien of NRL Physio fame. He was was kind enough to share with me some of his HIA data from prior seasons. Unfortunately, he didn’t have data for this year for me to compare to, but his historical numbers up to 2024 were incredibly useful calibration tools and I’ll be sharing what I’ve used here today with him.
How I’ve tracked this is by collating any kind of HIA labelled interchange from the NRL website’s play by play section of the match centre. From there I’ve logged the exact time when the player left the field, and if they came back on, I tracked when they returned to calculate how much game time they were absent for. If they were instantly deemed as not able to return, or if they didn’t return from a standard HIA check, I’ve logged the remaining game time as minutes “missed”.
There’s some edge cases missing where a player is hit high by foul play. Those substitutions are sometimes classed as “Free Interchange” in the NRL site’s play by play, because they also cover things like lower leg injuries from hip drops. It doesn’t explicitly indicate if there’s a HIA check as well as the Free Interchange.
If I had an unlimited amount of time I could go back and check which ones were head knocks and not lower leg injuries from hip drops, but I’m time poor and this doesn’t pay enough for me to torture myself that way. If someone wants to subsidise me to do so, then feel free to contact my via email or my perpetually open DMs.
Thank you for reading The Rugby League Eye Test. Subscribe below to receive new posts in your inbox and support independent rugby league content.
Given this I’ve excluded any Free Interchange events from my analysis, because I can’t tell if they result in a HIA or not. This way it’s more of a representation of non foul play HIA events than total HIA events and still like for like data across seasons.
It’s not a huge gap without them. Comparing with the data NRL Physio collected, I’ve got very similar numbers for these seasons, although it does start to diverge the further I go back. It looks like I’m missing high single figure instances of a free interchange also needing a HIA, so it’s still tracking the vast majority of cases, and it should give us a good indication of where the league is heading and which teams are suffering from them.
Without any further delay, let’s get into the numbers. Below are the total number of regular HIA checks (not including free interchanges for reasons discussed above) for the past five seasons.
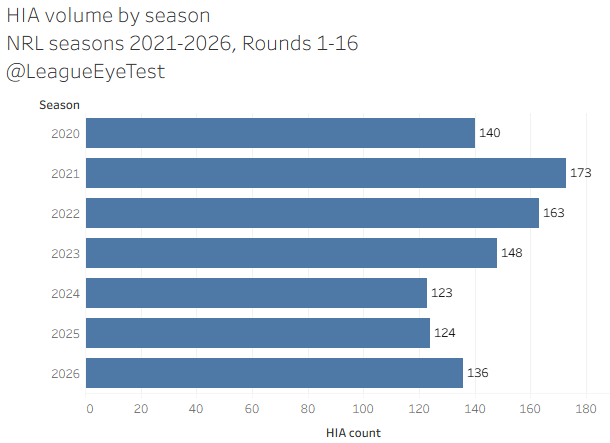
After 16 rounds we have 136 total HIA’s, up by a dozen from last year’s 124 and 2024’s 123. These numbers are still down from the peak of the early 2020s.
In terms of minutes lost by HIA, these have also increased slightly in 2026.
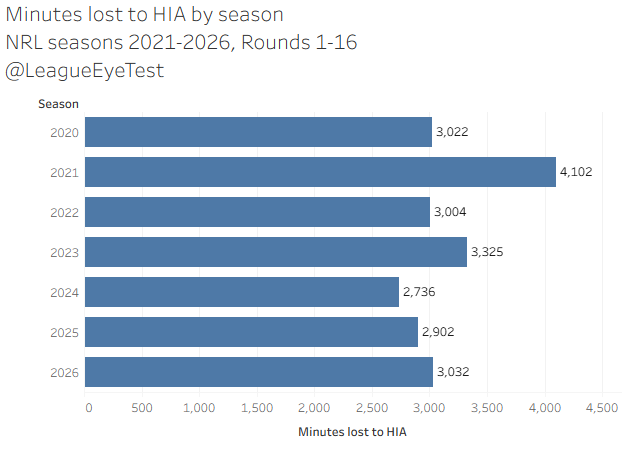
Just over 3,000 minutes of play have been lost due to a failed HIA this season, up by 130 minutes from the 2,902 lost in 2025 and 300 minutes head of 2024. Still nowhere near the insanity of 4,000+ minutes being lost after 16 rounds in 2021, but given everything ridiculous that happened during that season nothing surprises me anymore.
HIA failure rate is slightly increased on last season as well.
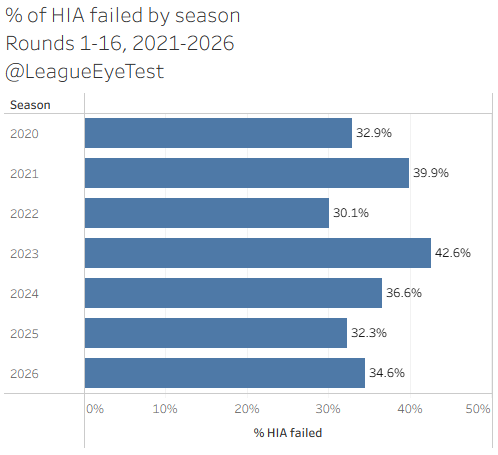
After sixteen rounds, 34.6% of non foul play HIA’s were failed, ahead of 2025 (32.3%) but down from 2023/2024 which were in the 37%-42% range. Note that whilst 2023 was at 42% after 16 rounds, it had regressed to 37% by the end of the season, in line with other years.
Given this, it seems like some of the panic around the pace of the game might be overblown. Yes the numbers are up, but there isn’t a dramatic increase or spike of HIA instances, and the failure rate is within an acceptable variation. Maybe the players aren’t as fatigued as we’re led to believe, or maybe their tackling techniques have improved?
The difference this season is hiding in the aggregate. In 2026 there’s one significant difference in HIAs this season over last. And it most likely has something to do with fatigue. As usual the devil is in the details.
Through 16 rounds in 2025, there were 11 HIAs in the final 15 minutes of a game. In 2024, that number was 15.
In 2026, we’ve seen 24 HIA’s occur in the final 15 minutes of a game.
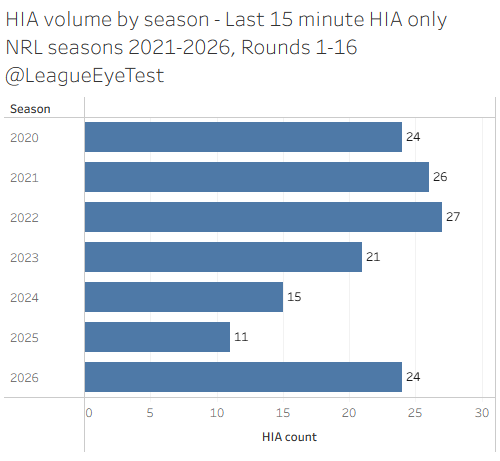
After 16 rounds, 2026 has one fewer HIA in the final 15 minutes as the last two seasons combined. Even in 2023 we only had 21 HIA’s after 16 rounds, and 2021 had 26. Please note these are standard HIA checks in the final 15 minutes, not all HIA checks in the final 15 minutes. If I include players who were deemed unable to return and occurred in the final 15 minutes, that number doesn’t change in 2026 but does move to 14 in 2025. Still a significant jump.
To combat the small sample size, when looking at them as a proportion it represents 17.7% of all HIA events, the highest proportion this decade. That is double the rate of last year (8.9%).
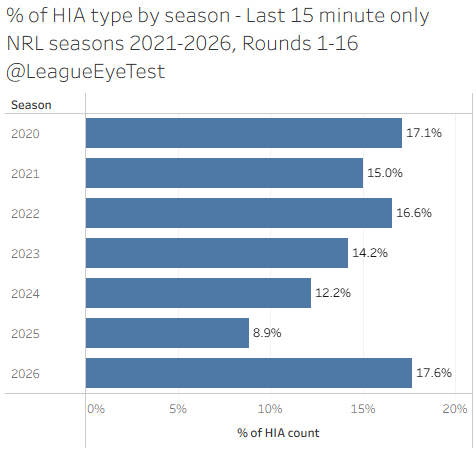
Whilst total HIA are marginally up, the proportion of late game HIA’s are double what they were a year ago. And this comes after four straight seasons of declining share for HIA’s in the final 15 minutes of a game. Something clearly changed this season.
To back this up, 26% of HIA occur in the final 20 minutes of the game in 2026, nearly double the rate of 2025 (13.7%). Additionally, 67% of all first half HIAs occur after the 20th minute. That number was 47.3% last year and no season has been above 59%. This could be interpreted as another sign that fatigue is a considering factor in these changes, even early in a game.
In summary, HIA’s slightly up on last year, and the percentage failed is comparable as well. But the proportion of HIA’s late in game when players are highly fatigued has doubled this season, indicating players are at a significantly higher risk of brain injuries late in matches. Hopefully someone passes this on to the Rugby League Players Association.
Now we’ve had the league wide look, let’s focus on some team specific numbers to see who has been most impacted by HIA’s this season. By volume it’s pretty clear who’s had the worst run of head knocks.
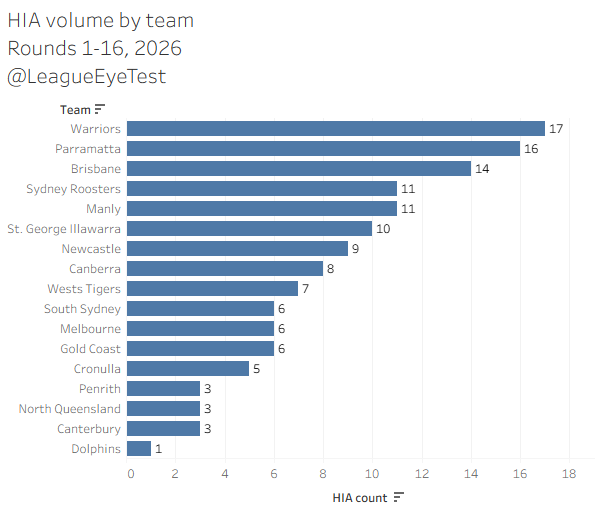
The Warriors have had 17 HIA this season, ahead of Parramatta with 16 and Brisbane with 13. Seven of those 17 for the Wahs failed their HIA, which tied for first in the competition with the Roosters, who failed 7 of their 11 HIA this season. The Eels have been somewhat lucky, with just four players failing their HIA.
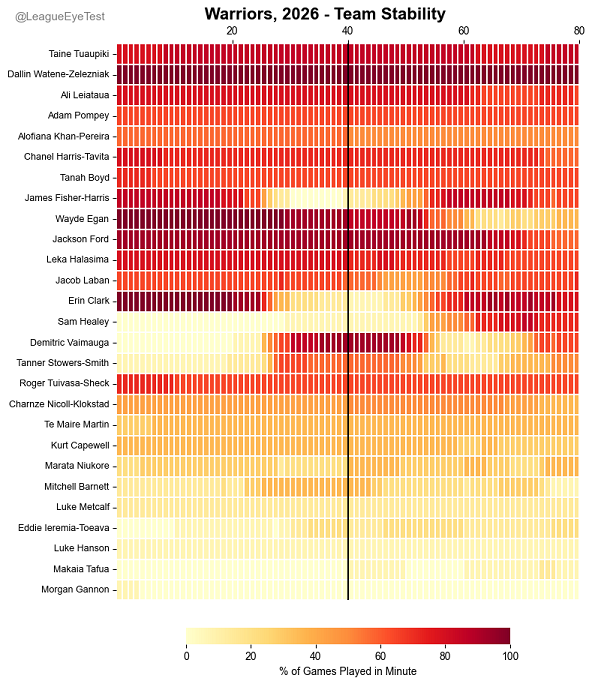
The Warriors have suffered a significant number of major injuries as well as multiple head knocks. Looking at their team stability chart (formerly interchange rotation but renamed because it shows more than just interchange patterns) you can see how impact the club has been across the board.
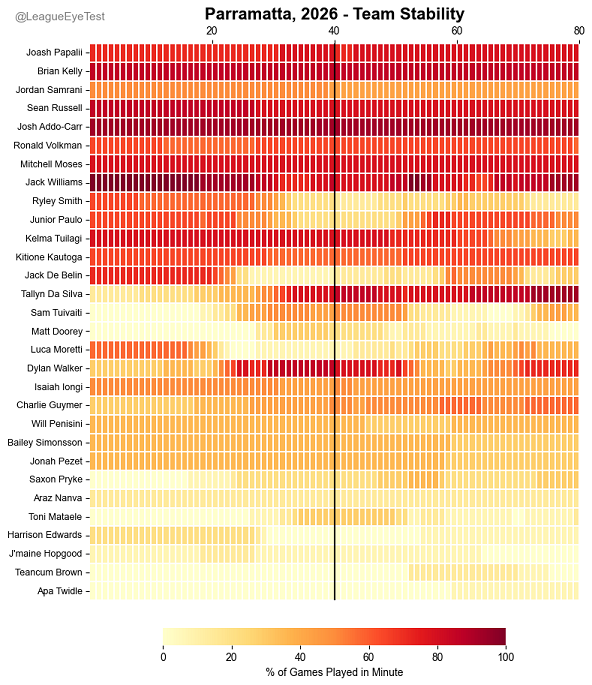
The Eels are one of four clubs to use 30 players already, along with Brisbane (who hit that mark a month ago), South Sydney and the Wests Tigers. Their stability chart also takes a hit across the board. Take note of Sam Tuivaiti’s minutes here, we’ll return to him later.
Back to HIA’s, at the bottom end of the scale, the Panthers have had just 3 HIA’s this season, along with the Bulldogs and Cowboys, while the Dolphins have had just the single check. The latter is an almost unfathomable number after 14 games of high pace rugby league.
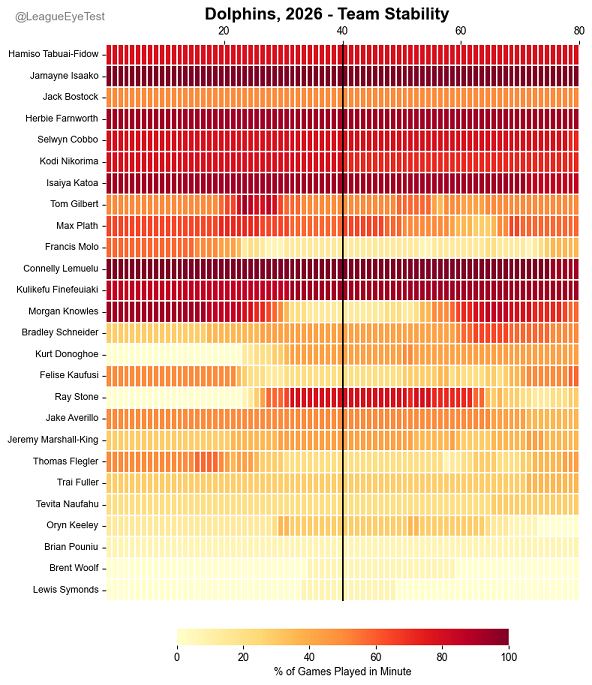
By looking at the Panthers and Dolphins team stability charts you can see that even though they share low HIA volumes, the Fins haven’t had the same overall stability that Penrith have had.
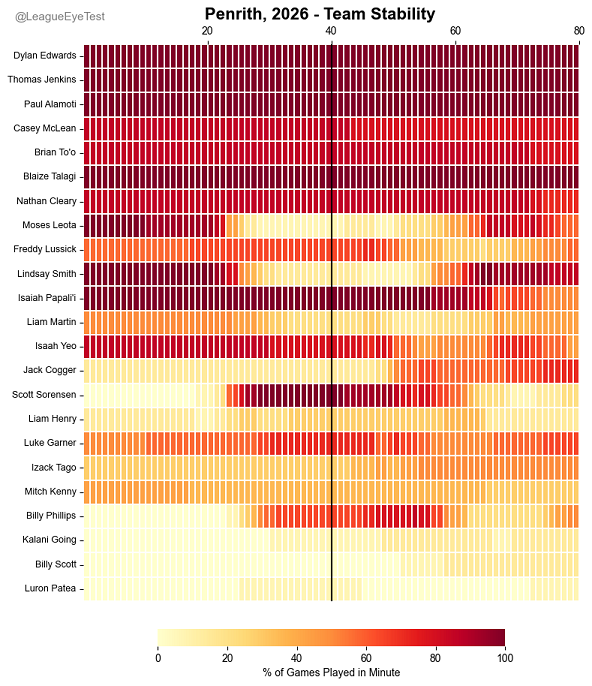
Penrith’s 1-7 have missed only a handful of games this season (although Casey McLean’s injury will change that), whilst the Dolphins have had to make a number of changes across the board as the season progressed.
The breakdown of HIA by minutes lost per team tells a slightly different story though than the raw volumes though.
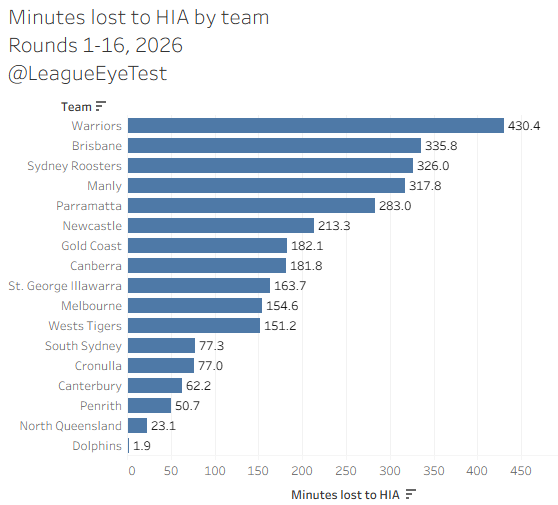
By far the biggest loser by total minutes lost is again the Warriors at 430, almost 100 minutes more than second placed Brisbane (335) and 104 more than the Sydney Roosters (326). Whilst the Eels have had the most head injury assessments in the NRL this season, they’re only ranked 5th by minutes lost at 283, behind Manly at 318 minutes off field.
Who has been impacted the least by HIA’s this season from minute lost? By far it’s THE Dolphins who as we noted above had the single HIA event.
The Fins have lost just 1.9 minutes this year to HIA, an absolutely absurd number after 14 games. That 115 seconds came in Round 5 when Selwyn Cobbo went off for a HIA check in the 78th minute. Not only have they dodged HIA’s all season, but the only one they’ve had came at 78:05 in the 5th round of game they were already behind by 34 points. A near statistical improbability.
Penrith (50.7 minutes) and North Queensland (23.1 minutes) are the other two teams to have suffered the least impact from HIA’s this year. The Cowboys number is also ridiculous for completely different reasons. Bear with me for a few paragraphs as I set this one up.
Five players have at least three head injury assessments this season. Jake Trbojevic is obviously one. He cleared checks in Round 4 and 7, but failed one in Round 6 to lose a total of 76.4 minutes.
Wayde Egan from the Warriors picked up his third HIA of the season on Sunday, with two cleared and one did not return for a total of 72.7 minutes lost.
Parramatta middle Sam Tuivaiti had two of his three in consecutive rounds (3 & 4). However he cleared both before not returning from one in Round 7 for a total of 70.3 minutes lost.
Brisbane’s Jack Gosiewski experienced his three HIA’s in rounds 2, 9 and 10. He didn’t return in Round 2, was cleared in Round 9 and had a 78th minute on in Round 10 for a total of 68.4 minute off field.
Who is the 5th player with multiple HIA’s this season? It’s Cowboys winger Murray Taulagi.
But how can that be if the club has only lost 23 minutes all season? The players above had multiple checks and lost roughly 70 minutes each.
It basically comes down to luck and timing. Taulagi’s most recent and third HIA was in the 35th minute of their Round 14 game. He passed his check at half time and returned losing just 4.3 minutes.
Taulagi’s first HIA this season occurred in Round 6 in the 71st minute (70:43), where he couldn’t return and lost 9.3 minutes. His second HIA this season came in Round 8, also in the 71st minute, just 15 seconds earlier than his previous one for a loss of 9.5 minutes.
That totals 23.1 minutes, the Cowboys complete list of HIA instances this season. If it weren’t for the Dolphins basically dodging the HIA bullet this season I’d think Taulagi’s sequence of fortunate events was unbeatable.
This made me ask the question – if teams are seeing vastly different impacts from HIA’s this season, what about the teams they‘re facing? So, I looked at HIA volume and minutes lost by opponent to see if there was a trend. First up is HIA volume by opponent.
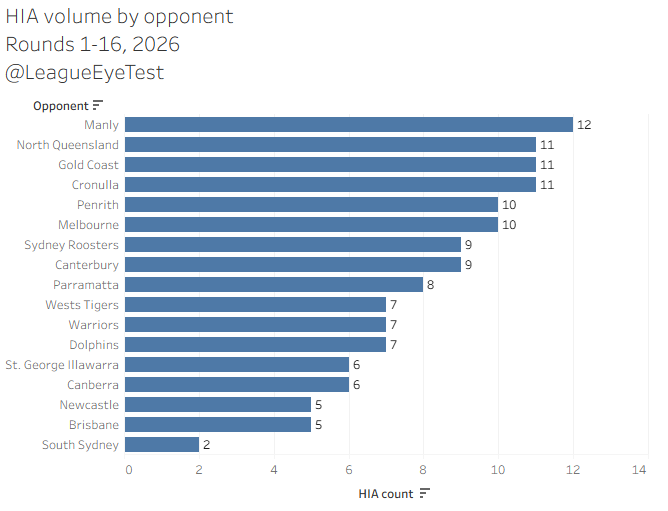
This is a little bit more even. Manly lead the way with 12 HIA checks for their opponents, with North Queensland, Cronulla and Gold Coast on 11. Every team in the NRL has at least 5 HIA’s against them, except for South Sydney who have seen just two.
One of those was Newcastle’s Jacob Saifiti in the 79th minute of their Round 9 game, and the other was Blayke Brailey in the 69th minute of their Round 10 game.
If you can count (chances are you can if you’re reading this, although I’ve been known to be wrong before), that makes a total off just 11 minutes of action lost by players facing South Sydney this season. Another number that’s almost as improbable as the Dolphins 115 seconds.
And to no surprise that’s by far the fewest minutes lost by an opposing side this season. Every other team has seen at least 100 minutes lost by their opponents to a HIA this season except for the Bunnies.
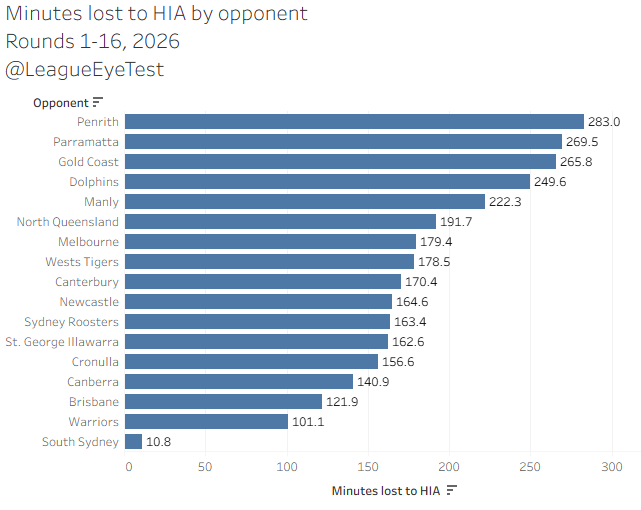
Penrith opponents have lost the most minutes to HIA this season at 283, slightly ahead of Parramatta at 270 and Gold Coast at 266. Again, this chart is far more even when looking by opponent than team. I’m sure someone will try to weaponise this number against the Panthers in some way.
Historically some of these numbers are by far the lowest over the past six seasons. For minutes lost by team, the Dolphins, Cowboys of 2026 take positions 1,2 and 4 for the fewest minutes lost through sixteen rounds. Penrith’s 50.7 minutes aren’t that far behind in 6th place overall.
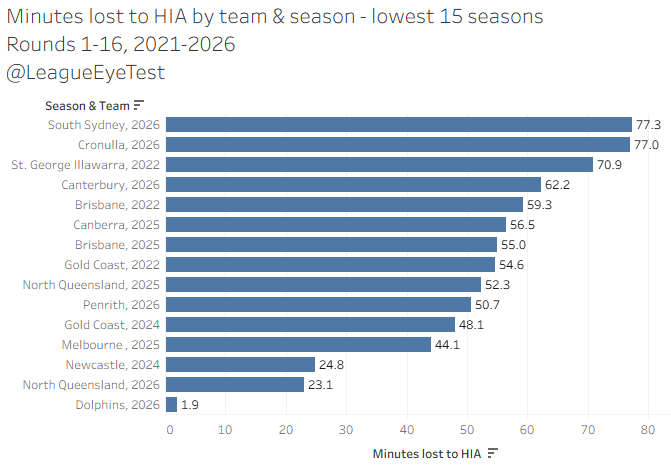
The previous low was 24.8 from Newcastle in 2024, and 40.7 from Brisbane in 2025. Only 12 teams have lost less than an hour of gametime from HIA’s through 16 rounds.
For most minutes lost by team, most of them came in 2021 (there’s that season again), with Cronulla losing 491 minutes that season, followed by 465 by the Tigers in 2022 and Canberra with 456 in 2021.
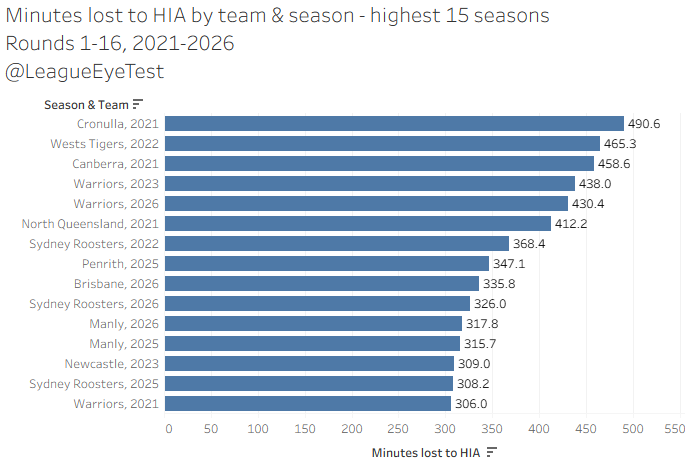
The Warriors 403 minutes this season is only 5th highest since 2021. That’s right behind the club’s 2023 campaign with 438 minutes lost, with a significant proportion of that number coming from Wayde Egan. Penrith, Brisbane and Manly from this season rank 9th, 10th and 11th over the past six seasons as well.
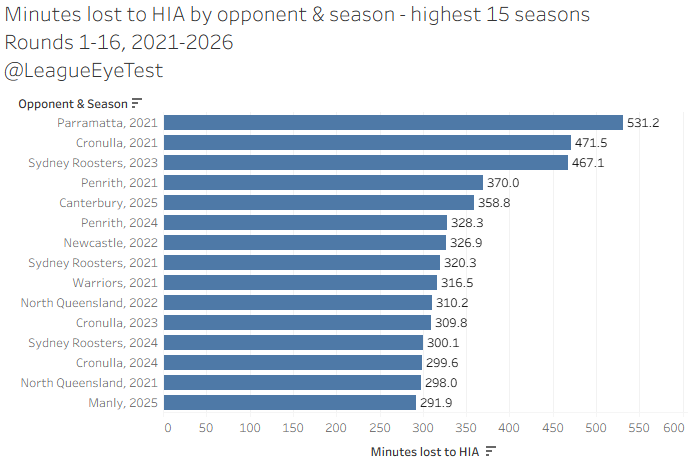
By opponent it’s a similar story. Souths’ opponents losing just 10.8 minutes is a record since 2021, with the previous low being 18.7 by teams facing Canterbury in 2023 and 37.8 against Melbourne in 2024.
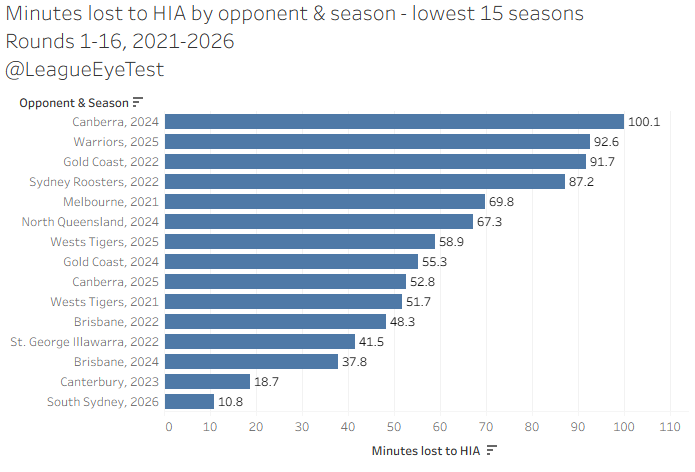
Yet again it’s 2021 where opponents were losing the most minutes. Teams facing Parramatta lost 531 minutes that season, with opponents of Cronulla (471) also losing a lot of game time to HIAs. The other 400+ minute season came from teams playing the Roosters in 2023. Parramatta’s opponents losing 265 minutes only ranks 24th over the past six seasons.
—
The Rugby League Eye Test produces artisan small batch rugby league analysis that you can’t find anywhere else. The Eye Test offers hand crafted data and independent analysis that you can trust came from a human brain.
This sort of quality workmanship takes time and effort. Quality independent, ad-free rugby league content doesn’t exist without support from readers and the community. The Rugby League Eye Test operates under a value for value model.
If you’ve enjoyed this post, and are in a position to do so, then you can donate an amount of your choice through the PayPal link below, the Kofi page, or through the support page on the site’s menu. You can decide the level of contribution based on the value you believe the Eye Test provides to you.
Support The Rugby League Eye Test
For those of you in areas (such as New Zealand) where there’s issues with PayPal donations for some reason, I’ve set up a Kofi page as well for donations.