
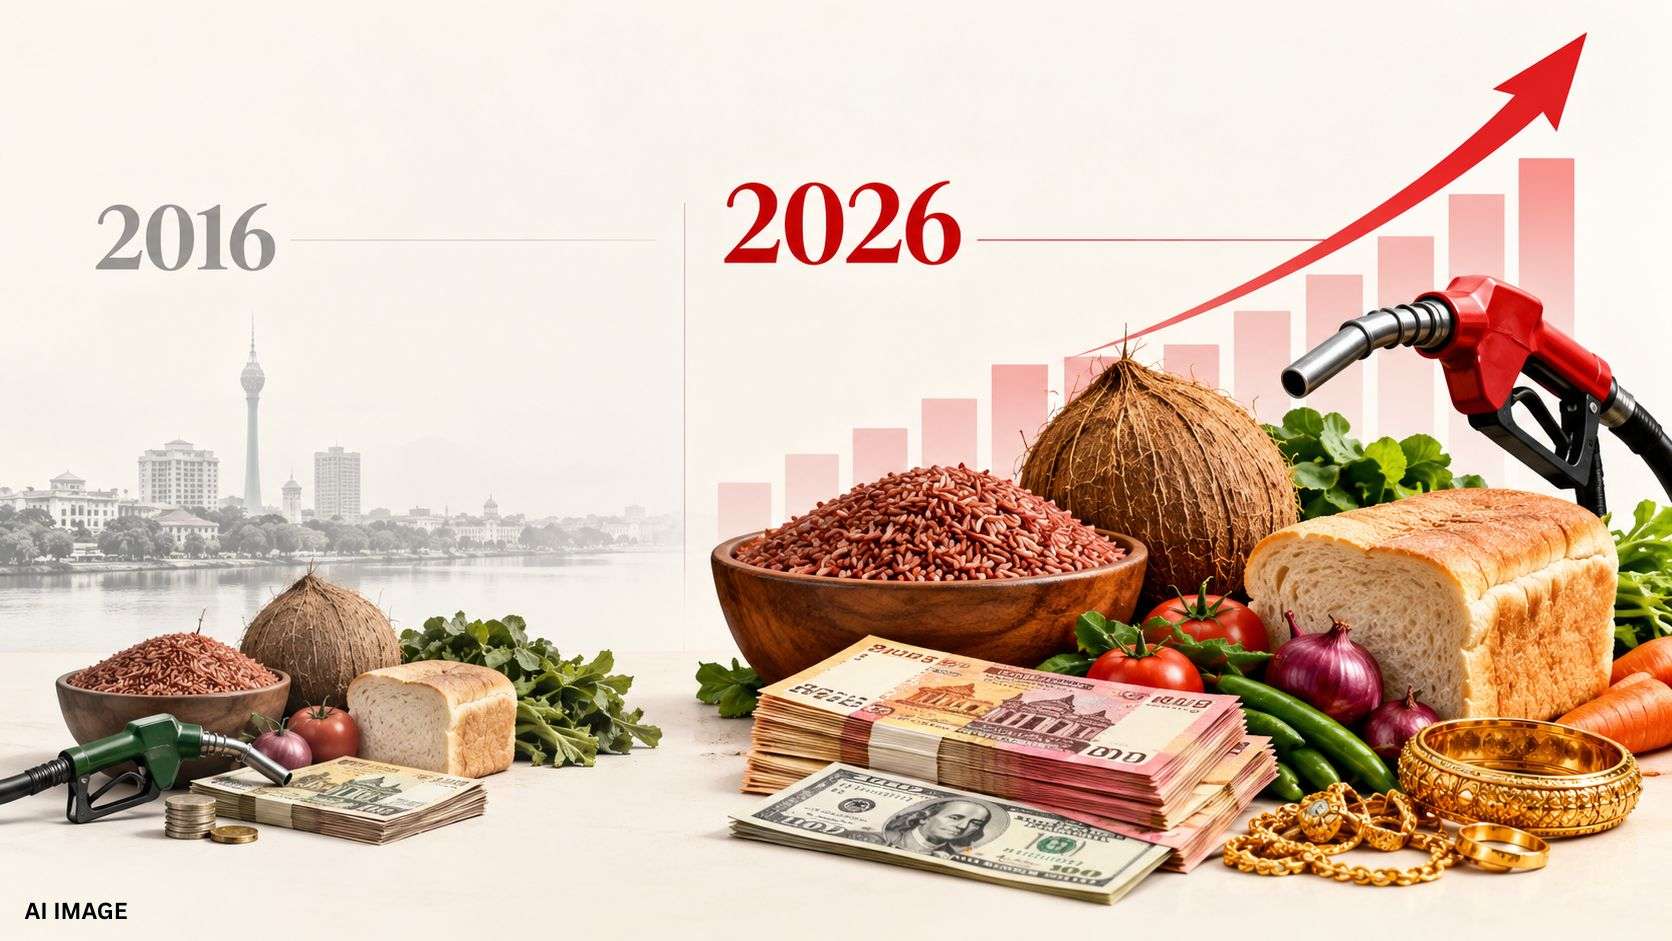
10 years, the same money
Food Prices:
2016 vs 2026
Explore 65 everyday foods and the US dollar to see how their rupee values changed over ten years.
Then and now, side by side.
Choose an item
Browse by category, then select a product to compare.
Category All products Product Raw red rice
Raw red rice
Colombo District: 2016 annual average vs fourth week of September 2026
+164% price increase since 2016
2016Annual average
Rs. 72.97
per kg
2026Sep, week 4
Rs. 192.76
per kg
Rs. 119.79 more per kg The 2026 price is 2.6 times the 2016 price.
AI Price Assistant
Ask about any of the 65 food prices or the dollar rate.
Answers from this dataset only
Which rose the most?Which rose the least?What more than tripled?What happened to the dollar?Explain this item
Start with a question above. The assistant will calculate its answer from the published figures.
How we calculated this, and where the figures came from
The 65 food comparisons cover open market prices in Colombo District. The 2016 figures are annual averages. The 2026 figures are weekly averages from the fourth week of September. Only products with matching units and sufficiently clear descriptions were included. Minor spelling and naming differences were standardised for readability. This is a price comparison, not a formal inflation index.
The dollar comparison uses the CBSL monthly average USD/LKR spot series for September 2016 and September 2026. CBSL changed its published spot reference methodology in March 2023, so this is a historical comparison, not a banknote buying or selling quote.
2016 food prices Department of Census and Statistics, Bulletin of Selected Retail and Producer Prices 2013-2016, Colombo District tables.
Prices vary by market, quality, size and week. The selector identifies grades, sizes and pack weights where they matter. This comparison covers individual prices, not a complete household food basket.
This comparison shows how the prices of food, fuel and gold, together with the value of the rupee, have changed over time. Explore each category or use the AI Price Assistant to identify the largest increases and understand individual comparisons.
The figures are based on data from the Department of Census and Statistics, Ceylon Petroleum Corporation, Central Bank of Sri Lanka and published gold-market sources. These price changes are the combined result of many interconnected factors, including inflation, exchange rates, taxation, global commodity prices, supply conditions, seasonality, product quality and market location. No single factor should be viewed as the sole cause of an increase. This interactive presents a historical price comparison and is not intended to serve as a formal inflation index or a detailed analysis of the causes behind each price change.