
Photoinduced structural dynamics
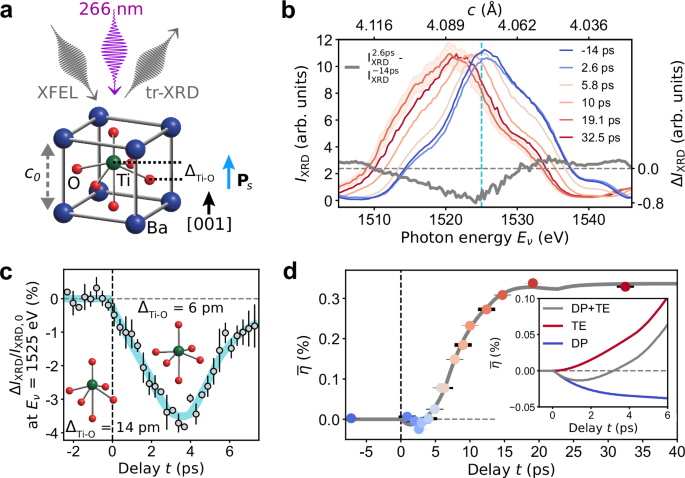
Our sample consists of a coherently strained, monodomain BaTiO3 (BTO) thin film, grown on a GdScO3 (GSO) substrate, with a SrRuO3 (SRO) bottom electrode sandwiched in between (see “Methods”). Under a compressive strain of −0.55% imposed by the substrate, the BTO film shows an out-of-plane ferroelectric polarization Ps = Psz pointing toward the sample surface (Fig. 1a), where Ps is the magnitude of the polarization and z is the unit vector along the out-of-plane direction. The sample is excited above the BTO band gap Eg = 3.4 eV30 using 266 nm laser pulses, with photon energy E = 4.66 eV, at an incident pump laser fluence of 2.7 mJ cm−2. Time-resolved X-ray diffraction of the (001) Bragg reflection is employed to probe the lattice response of our ferroelectric thin film along the out-of-plane direction. The lattice deformations along the in-plane directions on the picosecond timescale are negligible, given the large ratio between photoexcited area (330 × 240 μm2) and BTO film thickness dBTO = 34.5 nm.
We observe an initial reduction of the tetragonal distortion, which goes hand in hand with lattice compression, then followed by lattice expansion. In particular, Fig. 1b shows the (001) diffraction intensity IXRD of BTO as a function of the photon energy Eν and at different pump-probe delays t from −14 ps to 32.5 ps. At t = 2.6 ps we observe the following changes to the Bragg peak as compared to the ground state (at t = −14 ps): a decrease in the diffraction intensity IXRD near the peak center, and a shift to higher photon energy, which implies a decrease in the out-of-plane lattice parameter c, i.e., lattice compression (see gray curve in Fig. 1b). To further explore this initial structural dynamics, we measure the delay dependence of ΔIXRD/IXRD,0 = [IXRD(t) − IXRD,0]/IXRD,0, which quantifies the relative change of IXRD(t) at the photon energy Eν = 1525 eV of the BTO peak with respect to the equilibrium value IXRD,0 at negative delays. We observe a maximum diffraction intensity drop of ≈ 4% at t = 3.5 ps, with up to 99% recovery to the equilibrium value at t ≈ 7 ps (Fig. 1c and Supplementary Fig. 1). We assign the initial 4% drop and recovery in diffraction intensity to the displacements of atoms within the BTO unit cell (inset of Fig. 1c). Specifically, simulations based on the dynamical theory of diffraction31 (Supplementary Fig. 2) exclude the Debye-Waller effect and show that a decrease in the displacement ΔTi−O between the Ti atom and the center of the O octahedron by 8 pm can model the measured maximum change in peak diffraction intensity.
We focus next on the BTO (001) Bragg peak measured at longer time delays (Fig. 1b). We observe that IXRD(Eν) at t > 3 ps are shifted toward lower photon energies, i.e., larger out-of-plane lattice parameters c, with respect to IXRD(Eν) at smaller delays t. This can be clearly seen from the plot of the BTO out-of-plane strain \(\overline{\eta }(t)\), averaged over dBTO (Fig. 1d). Here, \(\overline{\eta }(t)=[c(t)-{c}_{0}]/{c}_{0}\), with c(t) and c0 representing the average \(\overline{c}\) at a given t > 0 ps and t ≤ 0 ps, respectively (see “Methods”). In Fig. 1d, we find that: (i) the maximum compression of −0.024% occurs at t = 2.6 ps, (ii) \(\overline{\eta }(t)\) increases linearly at a rate of 0.04 %/ps in the range 4 ps < t < 10 ps, and (iii) settles at 0.34% at ≈ 20 ps.
The model fitting \(\overline{\eta }(t)\) data in Fig. 1d is presented in the following. When a photon with energy E > Eg is absorbed in BTO, electrons are photoexcited from the O 2p-derived valence band to the Ti 3d-derived conduction band32,33,34. The thermalization of photoexcited electrons leads to an increase in the electron temperature (Te), and to changes in the electronic system that can be modeled by the variation of the bandgap as a function of the electronic pressure (∂Eg/∂p)4. In turn, a modified electron system affects the interatomic potential, resulting in atomic motions and contributing to the deformation potential stress σDP(Te, ∂Eg/∂p). Subsequently, photoexcited electrons transfer part of their excess energy (E − Eg) to the phonon system via electron-phonon scattering, increasing the phonon temperature (Tp) on the picosecond timescale. This, in turn, induces a lattice expansion dependent on the BTO thermal expansion coefficient (β), and contributes to the thermoelastic stress σTE(Tp, β). The total stress4,35σ = ρv2η + σDP + σTE generates a strain wave η(z, t) that propagates through the material of mass density ρ at the longitudinal speed of sound ν. Given the incident peak power intensity of 39 GW cm−2 and other known sample parameters (Supplementary Table 1), we solve analytically the two-temperature model (2TM, Supplementary Note 1) and the lattice strain wave equation (Supplementary Note 2) to obtain the strain η(z, t). The 2TM describes electron and phonon temperatures, Te(z, t) and Tp(z, t), upon absorption of a laser pulse in our sample, thereby accounting for thermal effects (Supplementary Fig. 3). Finally, we calculate the strain \(\overline{\eta }(t)\), averaged over dBTO, and obtain an accurate fit of the experimental data in Fig. 1d. A similarly good fit of \(\overline{\eta }(t)\) data is obtained for incident pump fluence of 1.4 mJ cm−2 (Supplementary Fig. 4). The main outcome of our fit model is a negative ∂Eg/∂p of the order of ≈ 10−3 eV GPa−1 (Supplementary Table 2), in agreement with first-principles calculations36, with a resulting bandgap decrease of about 3.2 meV (Supplementary Note 3). The negative ∂Eg/∂p causes lattice compression along the out-of-plane direction within the first ≈ 3 ps, when the negative σDP dominates over σTE (inset of Fig. 1d). Conversely, at larger time delays (t > 3 ps), Tp increases (Supplementary Fig. 5) and the thermoelastic term becomes the dominant one, leading to an increase of the average out-of-plane strain \(\overline{\eta }(t)\) (Fig. 1d and Supplementary Fig. 6). The calculations of lattice temperature, out-of-plane strain and diffraction curves as a function of delay t and distance z from the BTO surface are reported in Supplementary Note 4. The validity of the model employed to fit the strain \(\overline{\eta }(z,t)\) data is further corroborated by the good agreement between the experimental BTO (001) diffraction peaks measured at different pump-probe delays t and the corresponding calculated diffraction curves, based on the strain profiles as a function of delay t and distance z from the BTO surface (Supplementary Fig. 7 and Supplementary Fig. 8).
Photoinduced ferroelectric polarization and electron dynamics
We turn now to investigating the dynamics of the ferroelectric polarization magnitude Ps and of the photoexcited carriers37,38,39,40,41, upon excitation of the BTO film by the same 266 nm pump laser with fluence 2.7 mJ cm−2. Therefore, we perform tr-SHG experiments29,42 and simultaneously tr-refl in reflection geometry (Fig. 2a). From SHG polarimetry, i.e., the dependence of SHG intensity \({I}_{{{{\rm{SHG}}}}}(\varphi )\propto | {\chi }_{ijk}^{(2)}E{(\omega )}^{2}{| }^{2}\) on the polarization angle of the probe beam φ, we learn about the optical tensor elements \({\chi }_{ijk}^{(2)}\) of a material, and thus its symmetry42. By selecting either horizontal (p) or vertical (s) polarization of the SHG beam, we measure \({I}_{{{{\rm{SHG}}}}}^{p}(\varphi )\) and \({I}_{{{{\rm{SHG}}}}}^{s}(\varphi )\), shown in Fig. 2b, c (blue points) together with the respective fit curves (see “Methods”), which are based on the 4mm point group symmetry with the following nonzero tensor elements: \({\chi }_{zxx}^{(2)}\), \({\chi }_{xxz}^{(2)}\), and \({\chi }_{zzz}^{(2)}\).
Fig. 2: Photoinduced ferroelectric polarization and electron dynamics.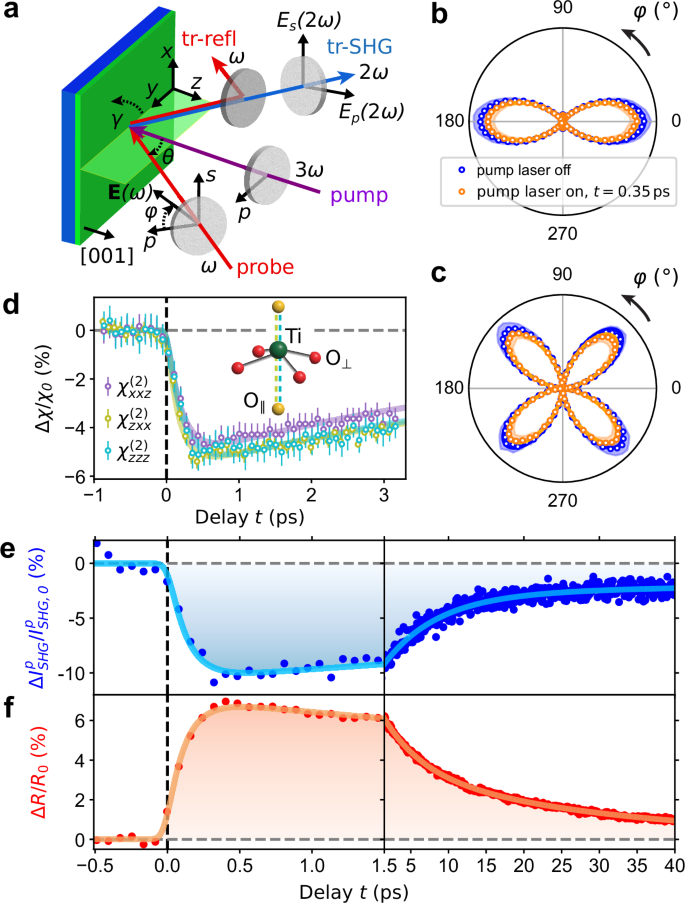
a Sketch of the tr-SHG and tr-refl setup (see “Methods”). b, c Polar plots of \({I}_{{{{\rm{SHG}}}}}^{p}(\varphi )\) and \({I}_{{{{\rm{SHG}}}}}^{s}(\varphi )\) measured without pump laser (blue points) and with pump laser at the delay t = 0.35 ps (orange points). The orange and blue solid lines are fit curves to the data resulting from equations (1) and (2). The shaded orange and blue areas refer to the standard deviation of the data and amount to ≈ 13%. d Relative change Δχ/χ0 of the tensor elements \({\chi }_{xxz}^{(2)}\), \({\chi }_{zxx}^{(2)}\), and \({\chi }_{zzz}^{(2)}\) as a function of delay t, and respective fit curves (Supplementary Note 5). \(\Delta \chi /{\chi }_{0}=({\chi }_{ijk}^{(2)}-{\chi }_{ijk,0}^{(2)})/{\chi }_{ijk,0}^{(2)}\), where \({\chi }_{ijk,0}^{(2)}\) refers to the tensor element \({\chi }_{ijk}^{(2)}\) at t ≤ 0 ps. The error bars refer to the standard deviation resulting from the fit of the tensor elements. Inset: sketch of Ti atom and O octahedron with the indication of O∥ (yellow spheres) and O⊥ (red spheres), and the softening of Ti-O∥ bonds (dashed olive and cyan lines) with respect to the Ti-O⊥ bonds (solid purple lines). e, f Relative change of SHG \(\Delta {I}_{{{{\rm{SHG}}}}}^{p}/{I}_{{{{\rm{SHG,0}}}}}^{p}\) and reflectivity ΔR/R0 as a function of the delay t. \(\Delta {I}_{{{{\rm{SHG}}}}}^{p}/{I}_{{{{\rm{SHG,0}}}}}^{p}= [{I}_{{{{\rm{SHG}}}}}^{p}(t)-{I}_{{{{\rm{SHG,0}}}}}^{p}]/{I}_{{{{\rm{SHG,0}}}}}^{p}\), where \({I}_{{{{\rm{SHG,0}}}}}^{p}\) refers to the SHG intensity at t ≤ 0 ps. ΔR/R0 = [R(t) − R0]/R0, where R0 refers to the reflectivity at t ≤ 0 ps. The solid lines are fit curves to the data with fit parameters τ0, τ1, and τ2 reported in the text. The error bar of \(\Delta {I}_{{{{\rm{SHG}}}}}^{p}/{I}_{{{{\rm{SHG,0}}}}}^{p}\) and ΔR/R0 data points are ≈ 8% and 2%, respectively. Since SHG is a nonlinear process, it is more significantly affected by fluctuations of the 800 nm probe laser intensity of ≈ 2%. However, the standard deviation of \(\Delta {I}_{{{{\rm{SHG}}}}}^{p}/{I}_{{{{\rm{SHG,0}}}}}^{p}\) and ΔR/R0 at t < 0 ps are 0.6% and 0.06%, respectively.
Upon laser excitation, the 4mm symmetry is preserved (orange points in Fig. 2b, c) and the three tensor elements show similar dynamics (Fig. 2d), characterized by a fast fall time with the maximum drop after ≈ 500 fs and two exponential recovery time constants of ≈ 5.5 ps and ≈ 45 ps (Supplementary Fig. 9 for −1 ps < t < 30 ps). Interestingly, the tensor elements representative of the induced electric dipole along the out-of-plane direction z (\({\chi }_{zxx}^{(2)}\) and \({\chi }_{zzz}^{(2)}\)) show a nearly identical time dependence and a larger relative change than \({\chi }_{xxz}^{(2)}\), which refers to the in-plane induced electric dipole along the direction x. The difference between \({\chi }_{zxx}^{(2)}\) (or \({\chi }_{zzz}^{(2)}\)) and \({\chi }_{xxz}^{(2)}\) reaches 0.5% after ≈ 500 fs and decreases in a few tens of picoseconds (Supplementary Fig. 9). A purely thermal effect43 would cause a uniform change of all tensor elements \({\chi }_{ijk}^{(2)}\), whereas the measured different dynamics of \({\chi }_{ijk}^{(2)}\) indicates a time-dependent lattice distortion and/or change in the electronic distribution of non-thermal origin. In fact, TD-DFT calculations32,33 show that upon charge transfer, the Ti-O∥ bonds between Ti and apical O∥ atoms (parallel to Ps) are weakened more than Ti-O⊥ bonds between Ti and basal O⊥ atoms (perpendicular to Ps), as sketched in the inset of Fig. 2d. Consequently, it is intuitive to expect a larger amplitude of the induced electric dipole along the Ti-O∥ direction (z) with respect to the Ti-O⊥ direction (in the xy plane), as experimentally demonstrated by our data.
The proportionality \({I}_{{{{\rm{SHG}}}}}\propto | {\chi }_{ijk}^{(2)}{| }^{2}\propto | {P}_{s}{| }^{2}\) gives direct access to the magnitude of the spontaneous polarization44. To this end, we measure the relative change \(\Delta {I}_{{{{\rm{SHG}}}}}^{p}/{I}_{{{{\rm{SHG,0}}}}}^{p}\) as a function of pump-probe delay t (Fig. 2e), with the polarization of the 800 nm probe beam fixed to the maximum of \({I}_{{{{\rm{SHG}}}}}^{p}(\varphi )\) at φ = 0° (Fig. 2b). Simultaneously, we measure the relative change in reflectivity ΔR/R0 as a function of pump-probe delay t (Fig. 2f). The data in Fig. 2e [f] are well reproduced by a fit function consisting of the sum of three exponential decay terms, with fall [rise] time τ0, and recovery times τ1 and τ2, convoluted with a Gaussian function representing the experimental temporal resolution (Supplementary Note 5). The initial drop in SHG intensity by 10% within 350 fs is followed by \({\tau }_{1}^{{{{\rm{SHG}}}}}=7.2\pm 0.5\,{{\rm{ps}}}\,\) and \({\tau }_{2}^{{{{\rm{SHG}}}}}=200\pm 140\,{{\rm{ps}}}\,\) recovery times, resulting in a 2.3% drop at 40 ps (Fig. 2e). At the same time, we observe a fast increase in reflectivity by 7% within 350 fs, followed by two recovery times, \({\tau }_{1}^{R}=5.2\pm 0.1\,{{\rm{ps}}}\,\) and \({\tau }_{2}^{R}=29.8\pm 0.5\,{{\rm{ps}}}\,\) (Fig. 2f).
In both tr-SHG and tr-refl data, the time needed to reach the maximum relative change (≈ 350 fs) might be due to the thermalization of photoexcited electrons via electron-electron scattering. Subsequently, thermalized electrons, which are higher in the conduction band, move to the bottom of the conduction band, transferring energy to the phonon system, and recombining with holes in the valence band via electron-phonon scattering4,40,45 or radiatively46. These processes are characterized by the recovery times τ1 and τ2. Both τ1 and τ2 recovery constants of \(\Delta {I}_{{{{\rm{SHG}}}}}^{p}/{I}_{{{{\rm{SHG,0}}}}}^{p}\) are larger than those of ΔR/R0 because the dynamics of the spontaneous polarization (seen by tr-SHG) results from the convolution of the faster dynamics of photoexcited carriers (seen by tr-refl) and the slower dynamics of atoms.
To interpret the SHG intensity drop and the reflectivity increase, it is useful to express the magnitude of the spontaneous polarization as22,47: Ps(t) = (1/V)∑iqi(t)Δzi(t), where V is the volume of the unit cell, qi(t) is the local charge and Δzi(t) is the out-of-plane displacement of atom i from the high symmetry position. The above-bandgap photoexcitation transfers electrons from the O 2p-derived valence band to the Ti 3d-derived conduction band of BTO. This charge transfer from O to Ti atoms reduces both the local negative charge at the O site (qO) and the local positive charge at the Ti site (qTi). We attribute the increase in R to the increase in photoexcited carrier density ne38,39,40, which decreases qi, while Ps results from changes in both qi and Δzi. This offers the opportunity to manipulate Ps by modifying qi, independently from the atomic displacements Δzi. In fact, in our experiments, after 350 fs, before any significant atomic movement can occur, the increase in carrier density ne is responsible for the measured decrease in Ps and increase in R, shown in Fig. 2e, f. This interpretation is corroborated by the increase of the maximum relative change of both \(\Delta {I}_{{{{\rm{SHG}}}}}^{p}/{I}_{{{{\rm{SHG,0}}}}}^{p}\) (negative, indicating decrease in polarization) and ΔR/R0 (positive, indicating increase in photoexcited carrier density) with pump fluence (Supplementary Fig. 10 and Supplementary Fig. 11). After a few tens of picoseconds, the longer recovery time of the polarization, as compared to the photoexcited carriers, is due to the contribution of the much slower structural dynamics, affecting Δzi, characterized by a recovery time beyond the 40 ps timescale, as seen in Fig. 1d.
An interpretation of SHG intensity and reflectivity in terms of nonlinear SHG coefficient and electric susceptibility, equivalent to the one discussed above, is reported in Methods. Furthermore, we note that measuring current-voltage (I-V) curves is an alternative tool to measure photocurrents under illumination48,49. These measurements are typically performed under steady-state conditions and require a top electrode. Given the absence of top electrode in our sample, adding it would certainly change the interfacial properties of our sample and influence the measured photogenerated electrons. As an example, it has been shown that the photocurrent may vary by more than 2 orders of magnitude, depending on the top electrode employed50. Furthermore, modifying the top interface would also modify the BTO ferroelectric polarization, at least locally near the surface, and possibly also deeper in the BTO layer, as investigated experimentally11,31,51 and theoretically47. Finally, adding a top electrode would also affect the strain propagation because of the different acoustic reflection coefficient at the BTO surface (Supplementary Table 1). Therefore, we probe the photoexcited carrier dynamics in our sample by tr-refl, as previously done in other works38,39,40, and as typically done in ultrafast measurements29.