
Last week, the Australian Bureau of Statistics (ABS) issued the national accounts for Q2 2025, revealing stronger-than-expected growth.
Analysts predicted a 0.4% increase in headline GDP, while the RBA expected 0.5% growth. However, a 0.6% increase was observed, driven by household spending.
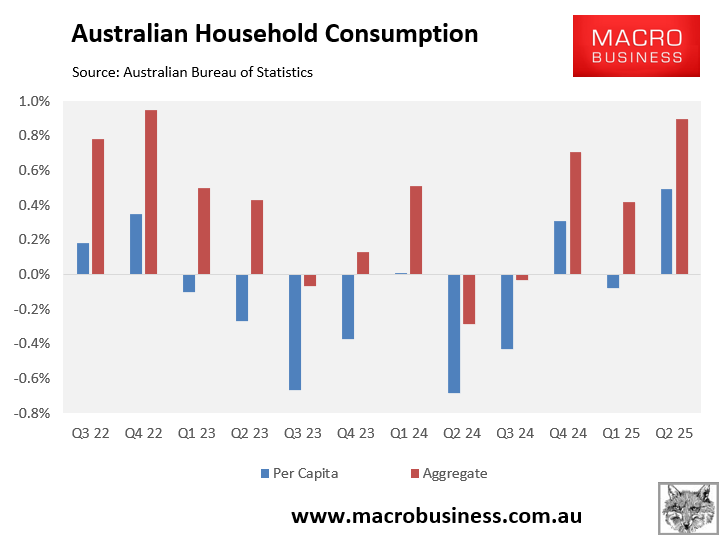
Household spending per capita increased by 0.5% in the second quarter, the highest increase in three years. For the first time in two years, per-person spending increased (+0.3%) year on year.
Advertisement
The long, grinding per capita recession ended with a 0.2% improvement in GDP per capita in the second quarter and a 0.2% increase year on year.
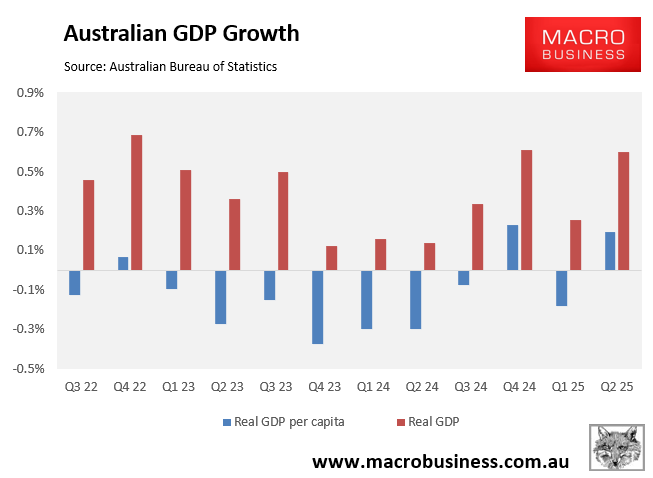
In Q2 25, GDP per capita rose for only the third time in 12 quarters. GDP per capita increased 0.2% year on year.
Advertisement
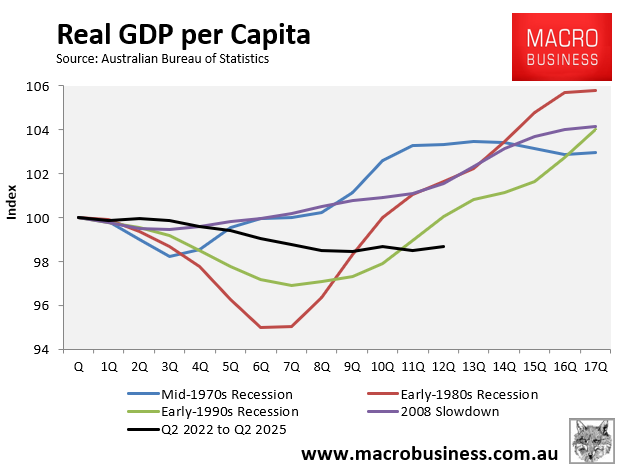
Despite the increase, GDP per capita remains 1.3% lower than it was when the Albanese government took office in Q2 22.
The increase in per capita household expenditure and GDP indicates that consumers have responded positively to the RBA’s rate cuts, as well as last year’s Stage 3 tax cuts.
Advertisement
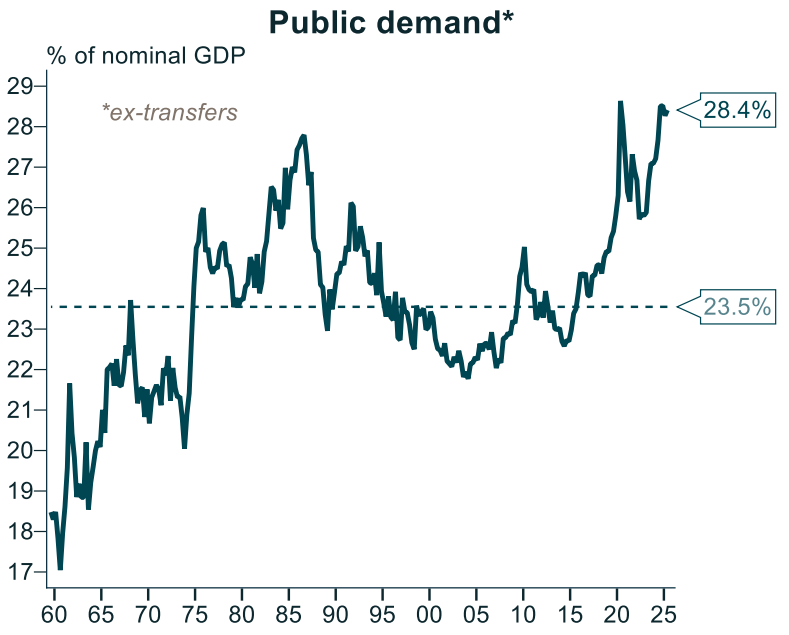
Despite the modest rebound in household spending, Australia’s economy remains powered by government spending and taxpayer-funded jobs.
The following chart from Alex Joiner from IFM Investors shows that public demand as a share of GDP remained at historic highs in Q2 2025.
Advertisement
Most of this growth in public demand has come from spending on programs like the NDIS, rather than capital investment.
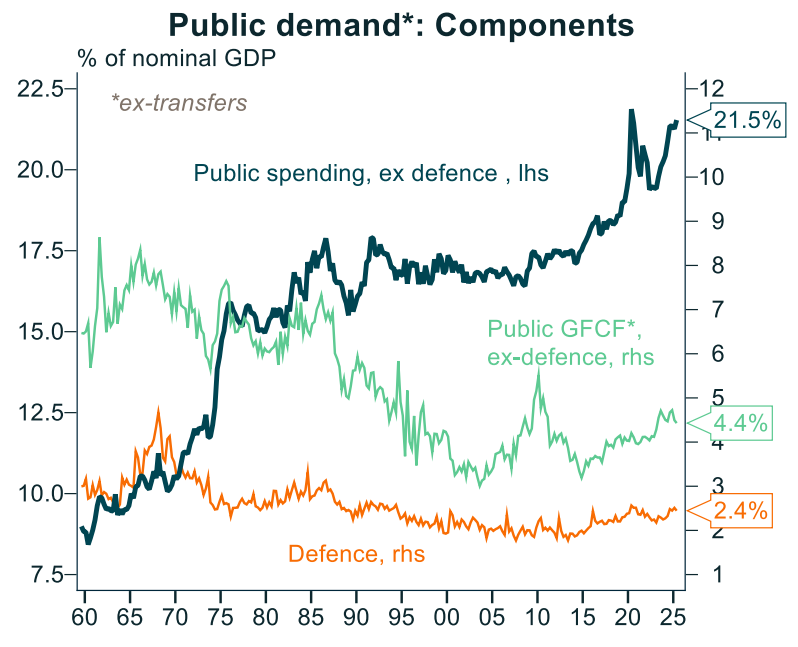
This spending on programs has driven a boom in non-market jobs.
Advertisement
As illustrated below by Justin Fabo from Antipodean Macro, the Q2 national accounts showed that growth in hours worked in Australia’s non-market industries (+0.4% for the quarter), albeit slowing, continued to outpace that in the market sector (+0.2% over the quarter).
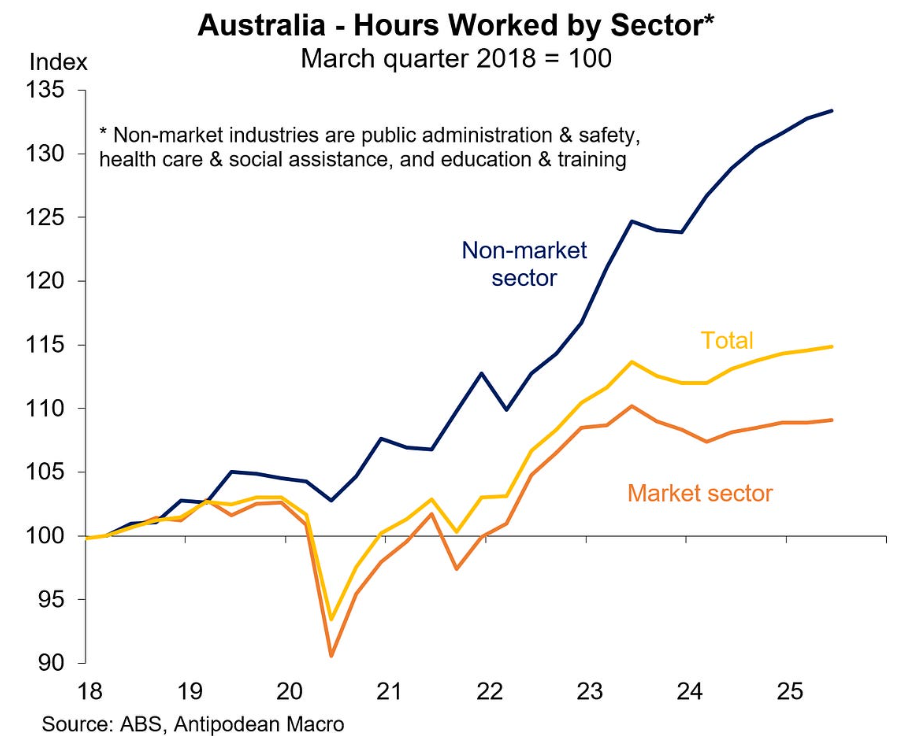
Friday’s Q2 Labour Account from the ABS reported similarly, with government-aligned non-market jobs easily outpacing the market (private) sector over recent years.
Advertisement
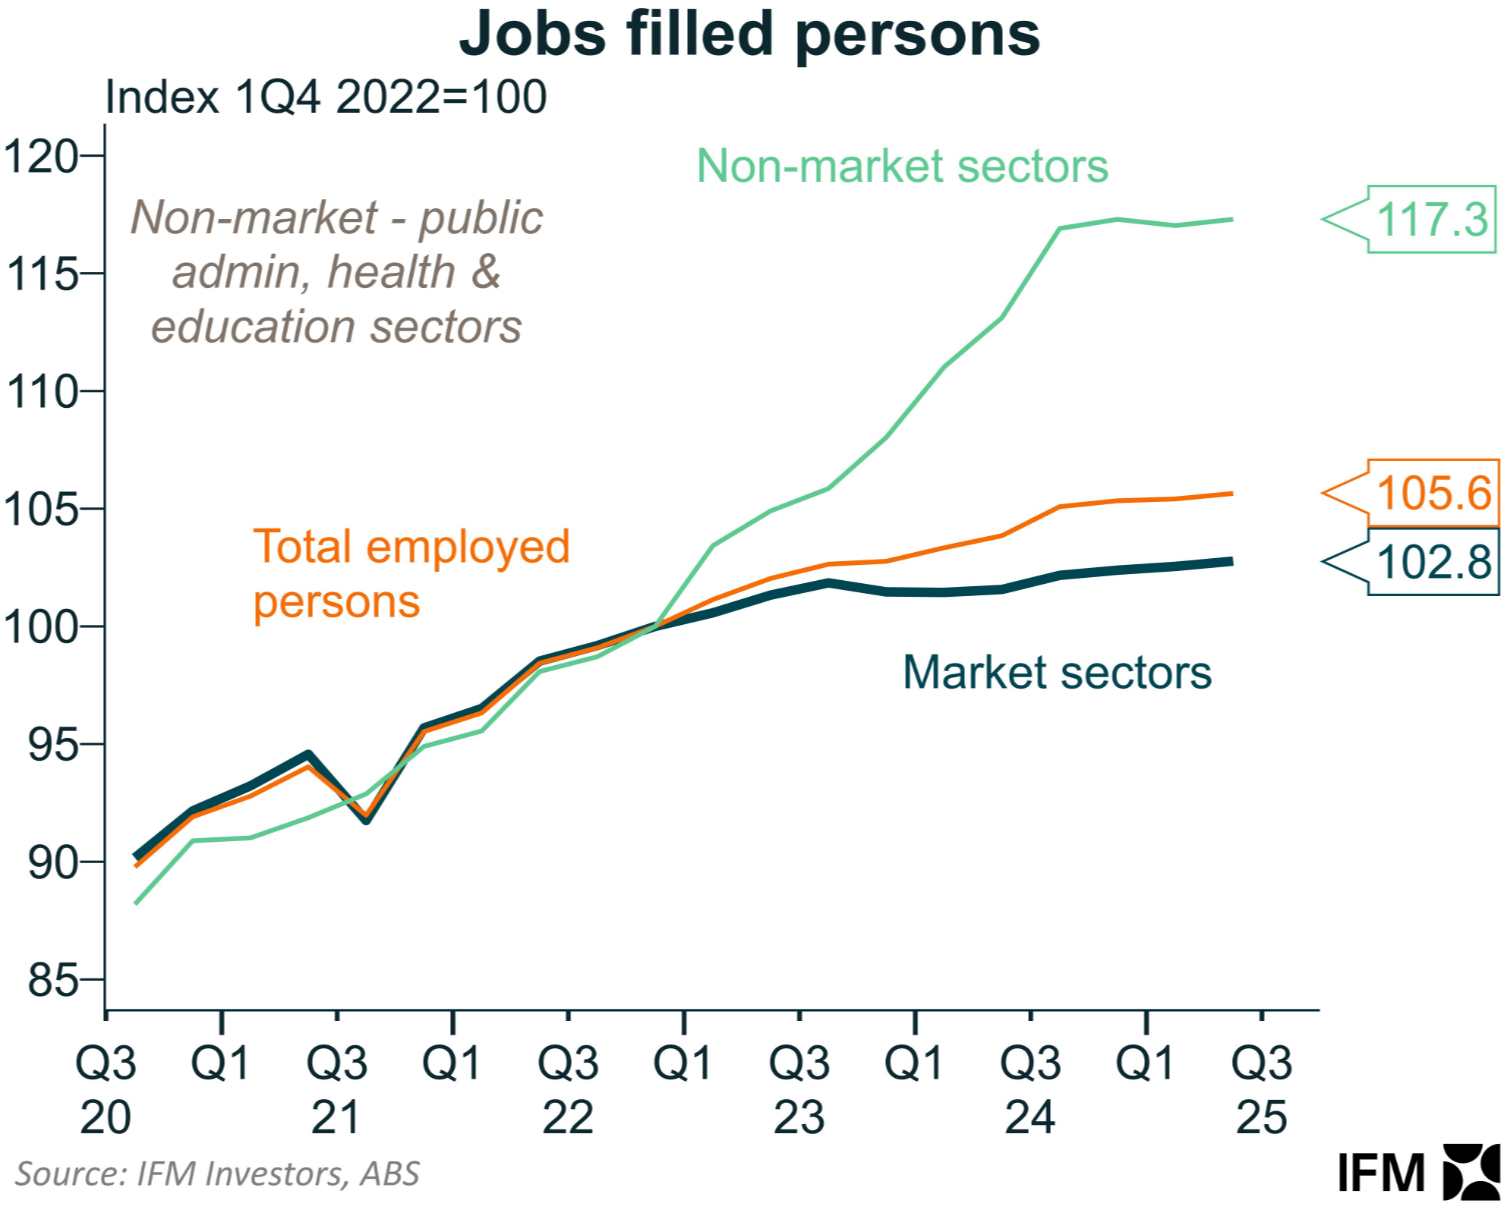
As illustrated below by Alex Joiner at IFM Investors, 650,526 jobs have been created in the non-market sector since the beginning of 2023, versus just 183,219 in the market sector. This means that 78% of Australia’s job growth since 2023 has been from the non-market sector.
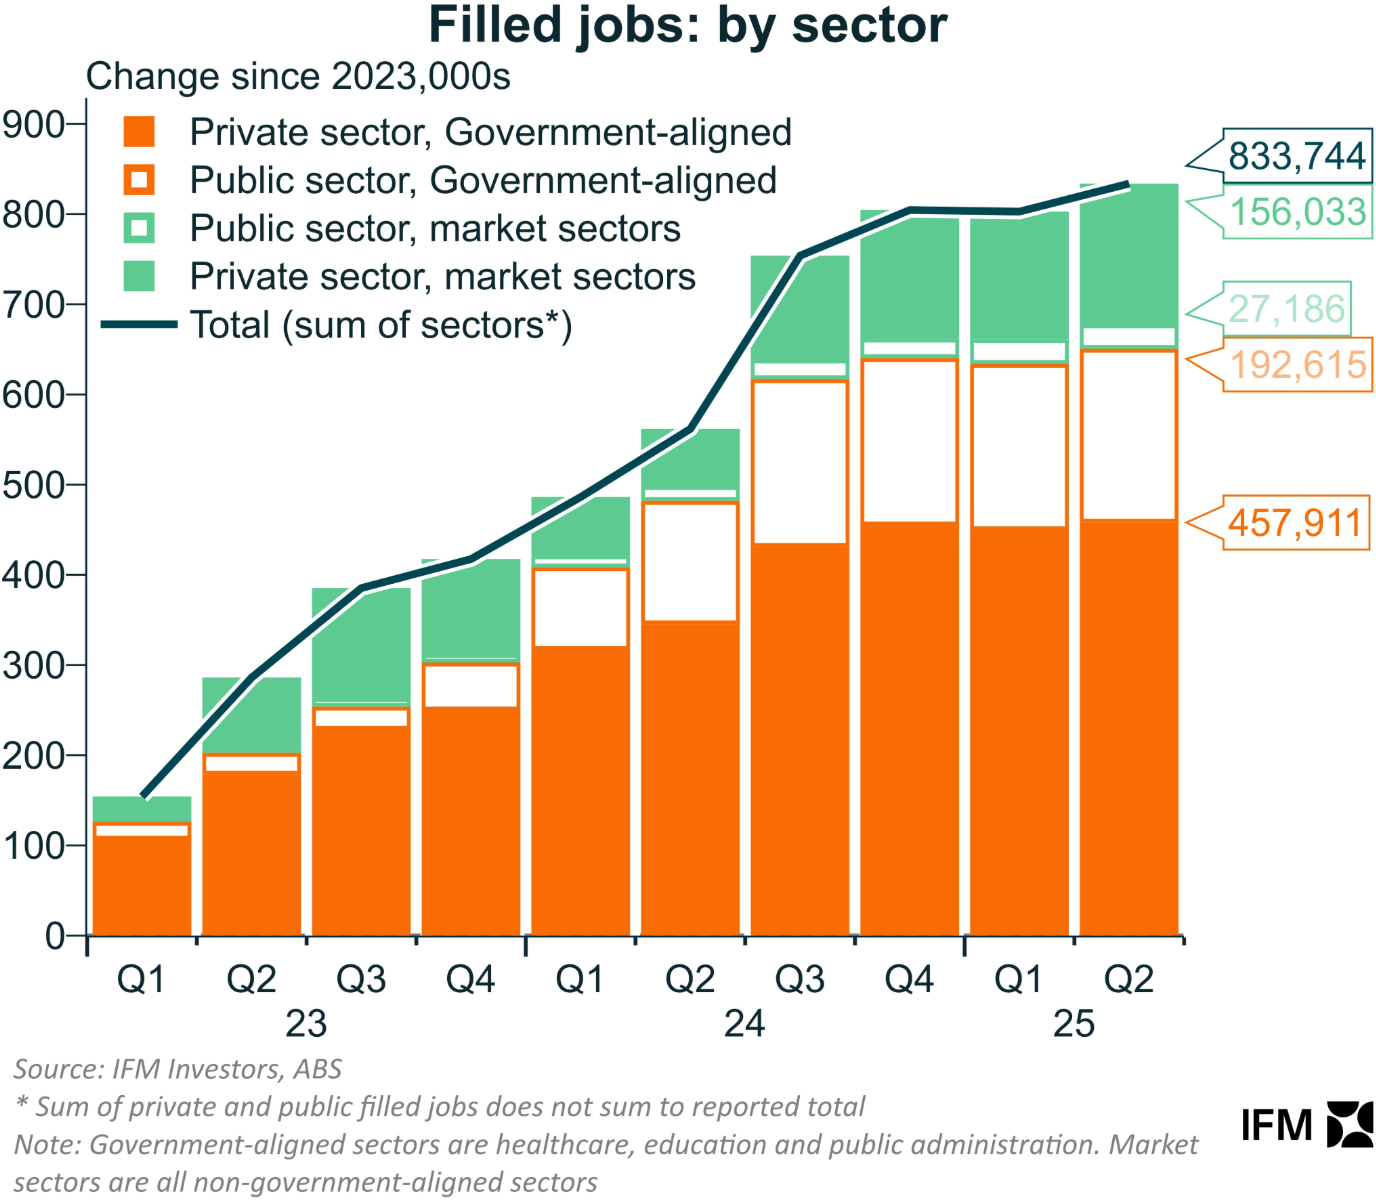
Joiner also shows that since Q1 2022, jobs in the non-market sector have grown by 17.3%, versus only 2.8% growth in the market sector.
Advertisement
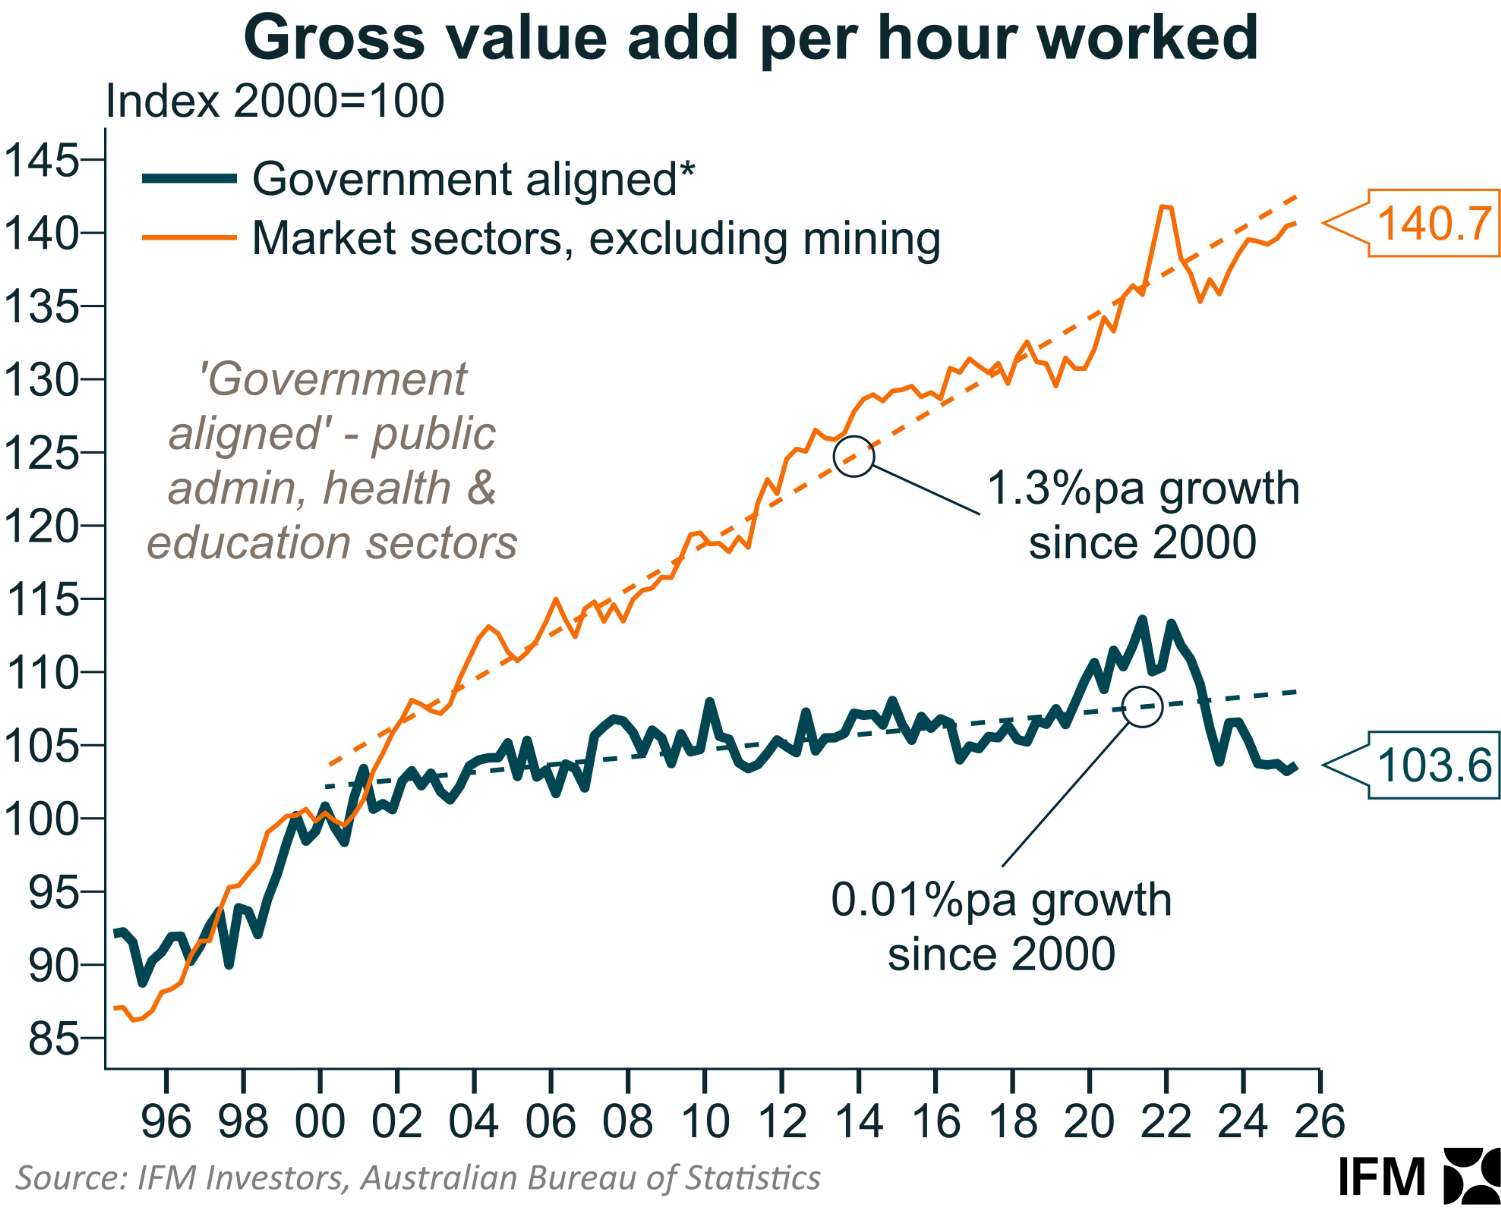
Finally, the following chart from Joiner plots the gross value added per hour worked across the market and non-market sectors, which is a measure of labour productivity:
Advertisement
As you can see, the non-market sector has experienced barely any labour productivity growth since 2000, versus 1.3% annual growth for the market sector.
Austerity measures by state and federal governments risk hammering the labour market and broader economy if the market sector fails to refire with ‘jobs and growth’.