

U.S. Economic Overview
The U.S. economy showed persistent deceleration in August. The U.S. labor market continued a steady deterioration, as job growth trended downward and the unemployment rate slowly increased. The employment numbers are likely to worsen as the federal government’s deferred resignation program issued in February reaches its end on Sept. 30. Despite the labor market conditions, certain indications suggest the U.S. job market may soon begin to recover. In particular, business sentiment data suggests hiring is likely to increase in the coming months. Moreover, the Federal Reserve is likely to begin implementing more accommodative monetary policy in the coming months to improve labor market conditions.
Although inflation remains above the Fed’s 2 percent target, the central bank is mandated to achieve both price stability and full employment. With concerns of a deteriorating labor market beginning to outweigh concerns over tariff-related inflation, the Fed is likely to begin a new cycle of rate cuts in a transition to neutral monetary policy. While these rate cuts may drive down short-term rates, the Fed’s shrinking holdings of asset-backed securities could keep mortgage rates elevated until their balance sheet policy stabilizes. Moreover, as the U.S. government risks losing tariff revenue, the rising prospect of a worsening fiscal outlook could cause a sustained increase in long-term interest rates, including rates on mortgages and long-term government bonds.
Capital markets remained mostly flat throughout August as investors awaited further information on the state of the economy. Long-term interest rates fell slightly in response to the Fed’s inclination to implement more accommodative monetary policy in the coming months. This decline carried into early September as the weak employment report for August enhanced the case for rate cuts. The Fed’s decision-making committee—the Federal Open Market Committee—meets again Sept. 16.
Stories We’re Following
International Capital Markets
The issue: The U.S. is largely a net recipient of international investment, allowing businesses, homebuyers, governments, and other borrowers access to capital with more favorable interest rates. At the onset of the global trade war in April 2025, the possibility of disruptions in global capital flows, as foreign investors reassessed U.S. investment risk, raised concerns that interest rates might increase. A redirection of foreign capital flows could significantly raise the cost of capital, reducing the value of underlying assets, including businesses and real estate.
Updates: Net foreign capital inflows into long-term U.S. assets surged in June, indicating that foreign investors have not been deterred by the global trade war. While the long-term implications of trade policy could continue playing out over the next several months and years, early indications suggest U.S. investments still appeal to foreign investors.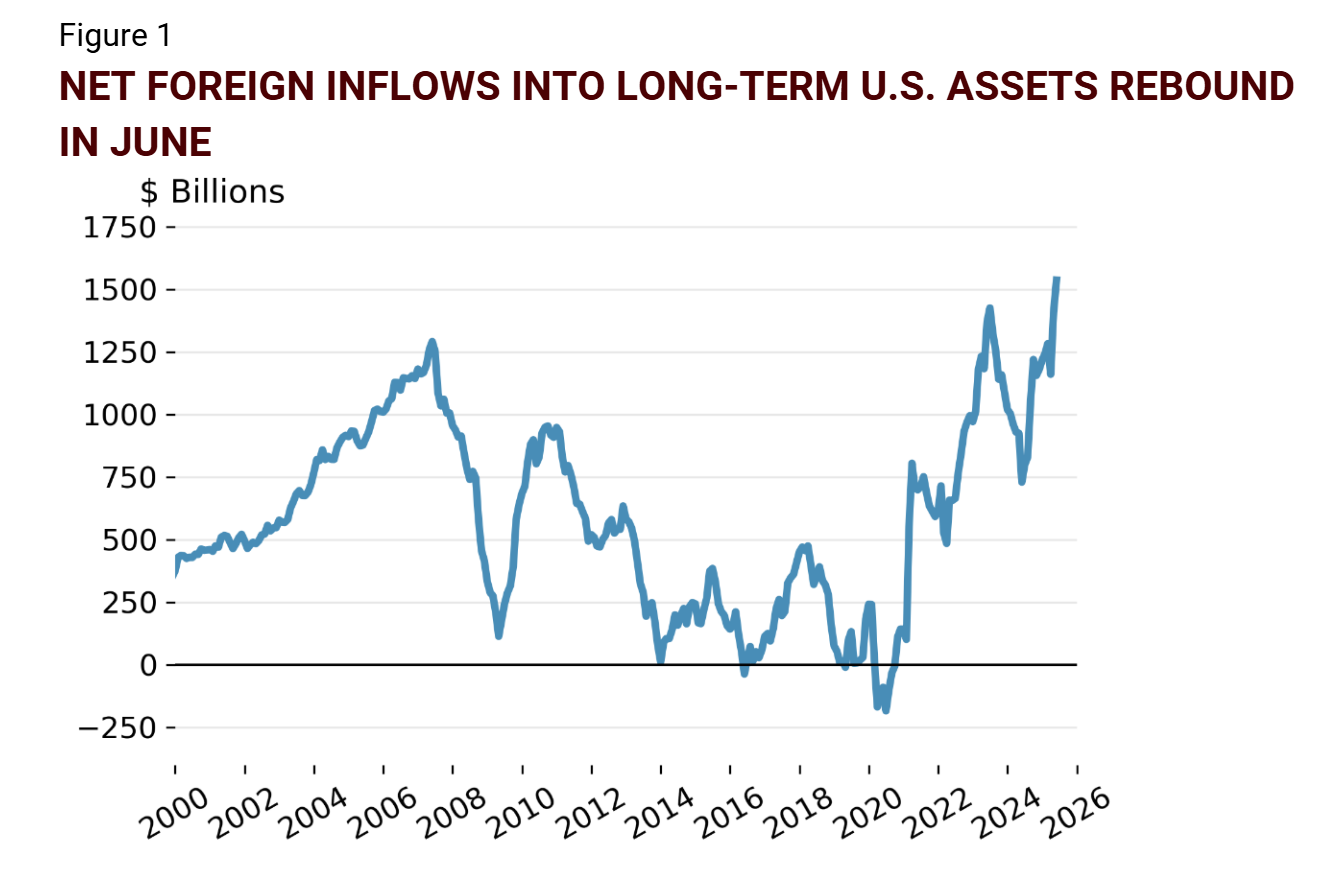
Notes: 12-month rolling sum.
Source: U.S. Department of the Treasury, Treasury International Capital
Federal Reserve Policy
The issue: The Fed is tasked with achieving a dual mandate of price stability and full employment. As inflation approaches the Fed’s 2 percent target, the central bank gains support for reducing interest rates to accommodate slowing labor markets. As part of its broader balance sheet operations, the Fed also buys and sells long-term private and public financial assets. Its divestment in mortgage-backed securities has placed upward pressure on mortgage rates, which could continue for as long as the Fed maintains this policy.
Updates: In late August, Fed Chairman Jerome Powell provided a critical update to the path of monetary policy at the Fed’s annual meeting in Jackson Hole, Wyoming. In a prepared speech, Powell indicated a pivot toward more accommodative monetary policy, increasing the likelihood of rate cuts in the coming months. Powell also provided a significant update to the Fed’s monetary policy framework, which abandoned “average inflation targeting.” Before this shift in policy, the Fed would aim to overshoot the inflation target rather than meet the target in order to achieve an average rate of inflation. By abandoning this framework, the Fed implicitly indicated a more dovish outlook on monetary policy where the Fed would seek to meet the inflation target rather than exceed it (to the downside). This shift in policy further reduced the anticipated path of interest rates.
Labor Market Slowdown
The issue: Several factors, including a slowing economy and policy-related uncertainty, have contributed to a slowdown in hiring. Despite the slowdown in hiring, the rate of layoffs has also remained mostly constant in recent months. This slowdown in both hiring and layoffs has contributed to only a modest increase in the unemployment rate despite the broad labor market slowdown. The hiring outlook, based on business survey data, provides an indication of the broader labor market and macroeconomic outlook.
Updates: The onset of the global trade war created significant uncertainty in the business outlook, causing many firms to scale back hiring activity. As concerns over the macroeconomic implications of tariffs subside, surveys of expected hiring, including those from the Federal Reserve Bank of Atlanta and the Federal Reserve Bank of Dallas (described in the Texas Economic Indicators below), show a significant improvement in the outlook for hiring. If this improvement in the outlook is sustained, along with a shift to accommodative monetary policy, labor markets could experience a rebound over the next several months. 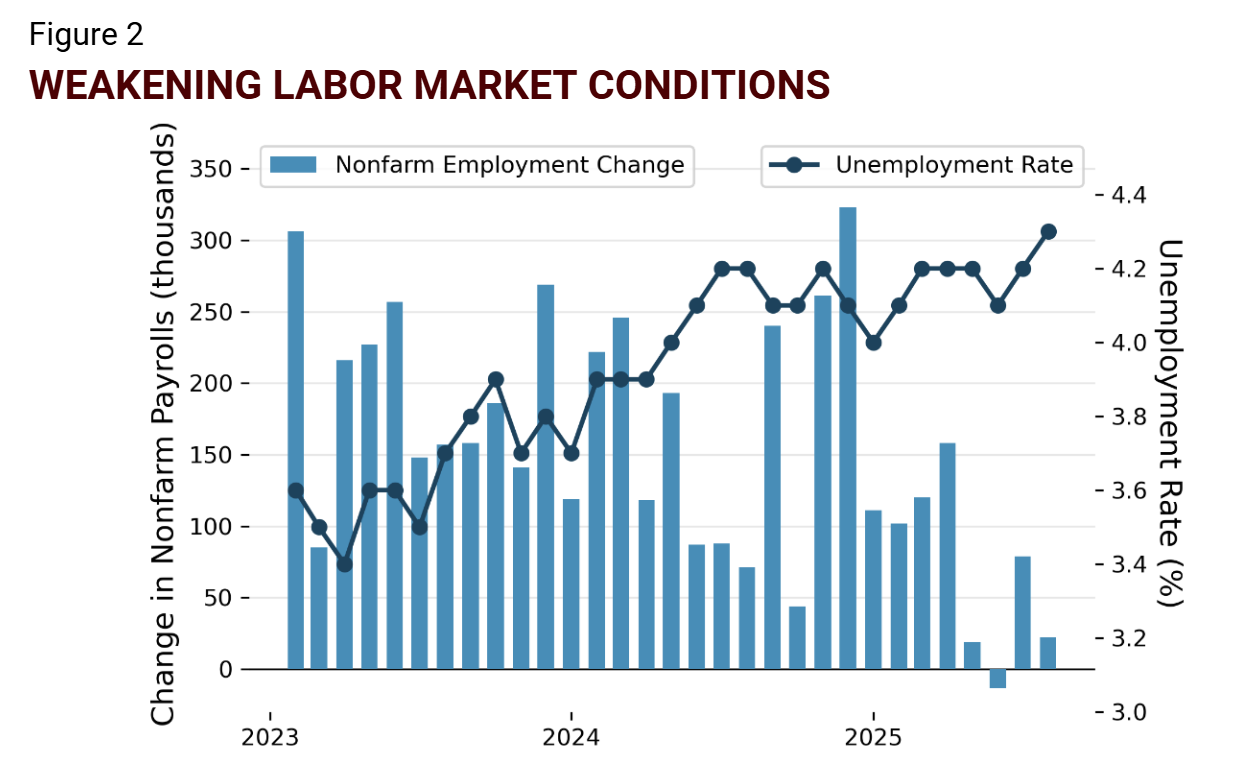
Source: U.S. Bureau of Labor Statistics, accessed via FRED
Texas Economic Indicators
The Texas economy showed signs of improvement against the backdrop of a weakening U.S. economy. Nearly every Texas metropolitan area showed an employment rebound in July after most areas showed a decline in June. Survey data from the Federal Reserve Bank of Dallas also continued showing a strong rebound in the hiring outlook that spanned each of the major sectors of the Texas economy. Moreover, longer-term measures, including year-over-year employment growth shows a growing improvement in the Texas economy relative to the broader U.S. economy (Figure 3).
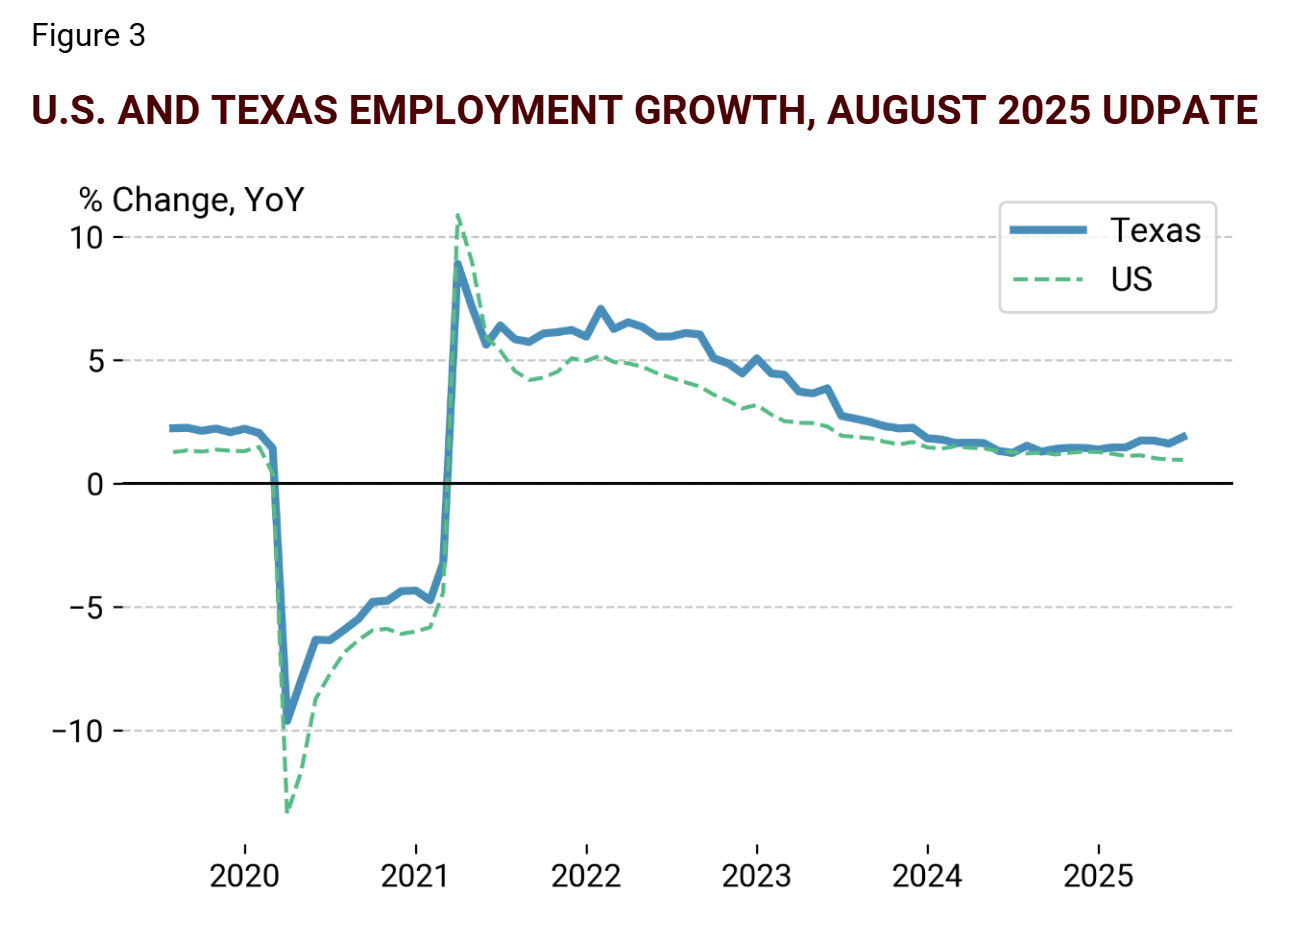
Source: U.S. Bureau of Labor Statistics and the Federal Reserve Bank of Dallas
Employment
Texas employment rebounded, growing by 0.1 percent in July (Figure 4) and outpacing the U.S. rate of job growth. Month-over-month (MoM) employment growth increased in every metropolitan area of Texas, except for the Houston metropolitan area and Lubbock. The San Antonio and Brownsville-Harlingen metropolitan areas experienced significant growth.
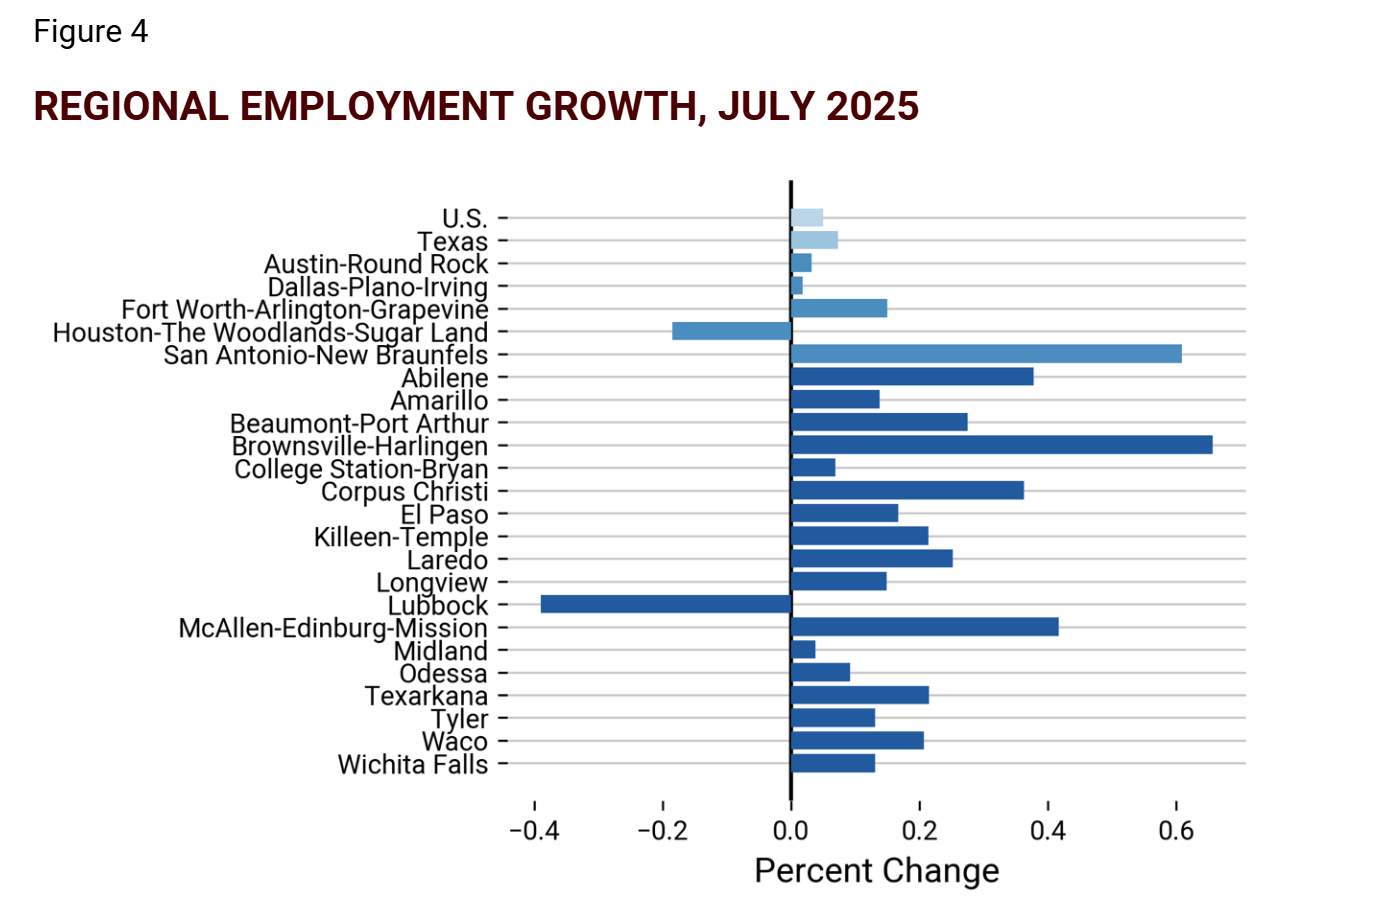
Notes: U.S., Texas, major metropolitan areas, and other metropolitan areas are each shown in different shades of blue.
Source: U.S. Bureau of Labor Statistics and the Federal Reserve Bank of Dallas
The goods-producing industries, with the exception of construction, experienced significant losses in June, with Mining and Logging losses now showing a persistent decline—likely due to declining oil prices (Figure 5). MoM employment grew in every service industry, except Education and Health Services, which have driven a large share of gain in recent months in the broader U.S. economy.
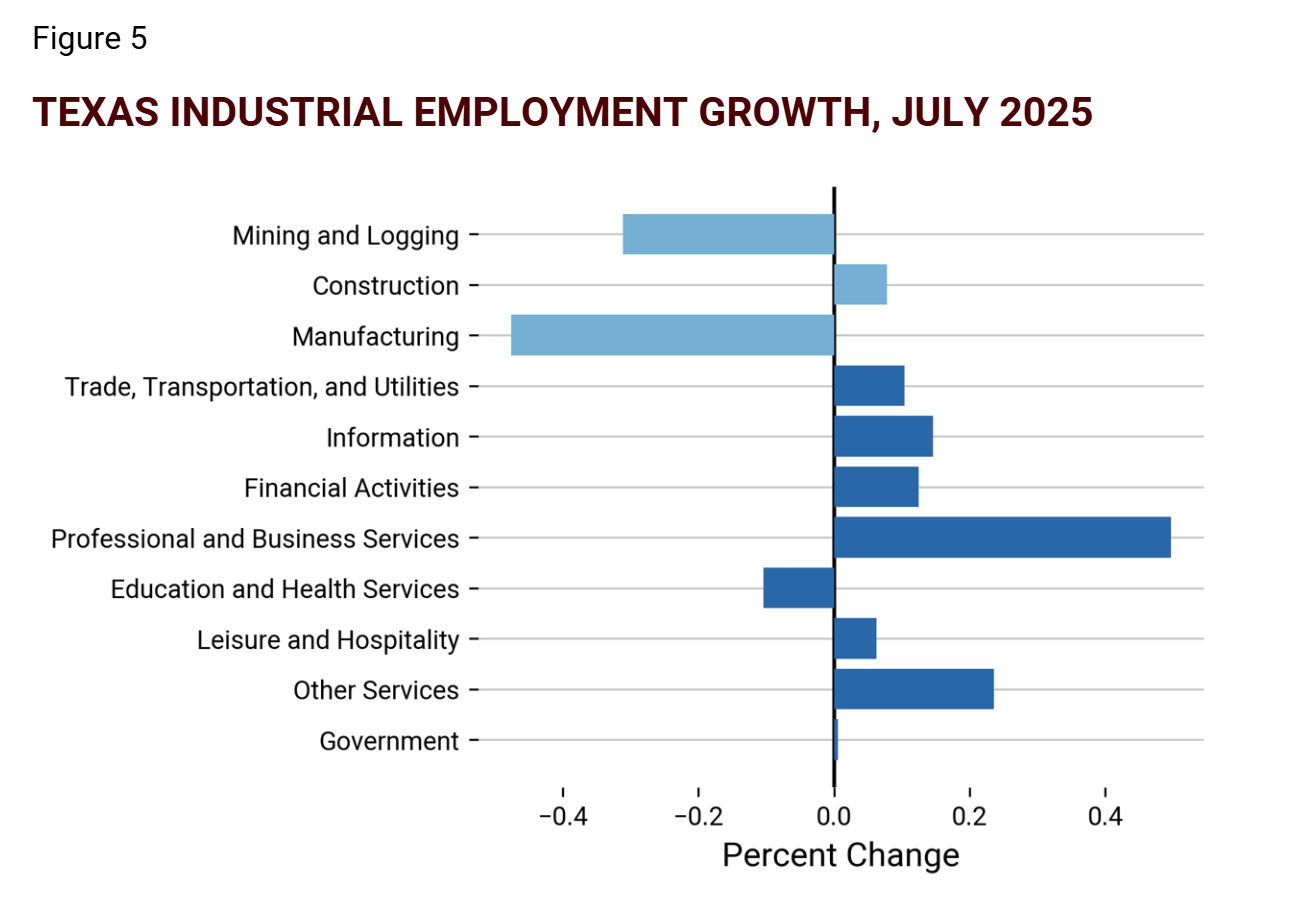
Notes: Goods-producing and service-providing industries are shown in different shades of blue.
Source: U.S. Bureau of Labor Statistics and the Federal Reserve Bank of Dallas
Employment Outlook
The share of Texas firms planning to hire in the next six months continued a strong rebound in the services and retail sectors while remaining flat in the manufacturing sector (Figure 6). This indicates a rebound in business optimism that could lead to a corresponding increase in job growth in the coming months. The number of firms planning to decrease employment fell in the manufacturing sector while ticking up in the retail sector and remaining mostly flat in the services sector. Overall, the business survey data appears to indicate a labor market improvement in the coming months. This employment outlook remains a critical indicator as a slowdown in hiring could lead to an increase in the unemployment rate.
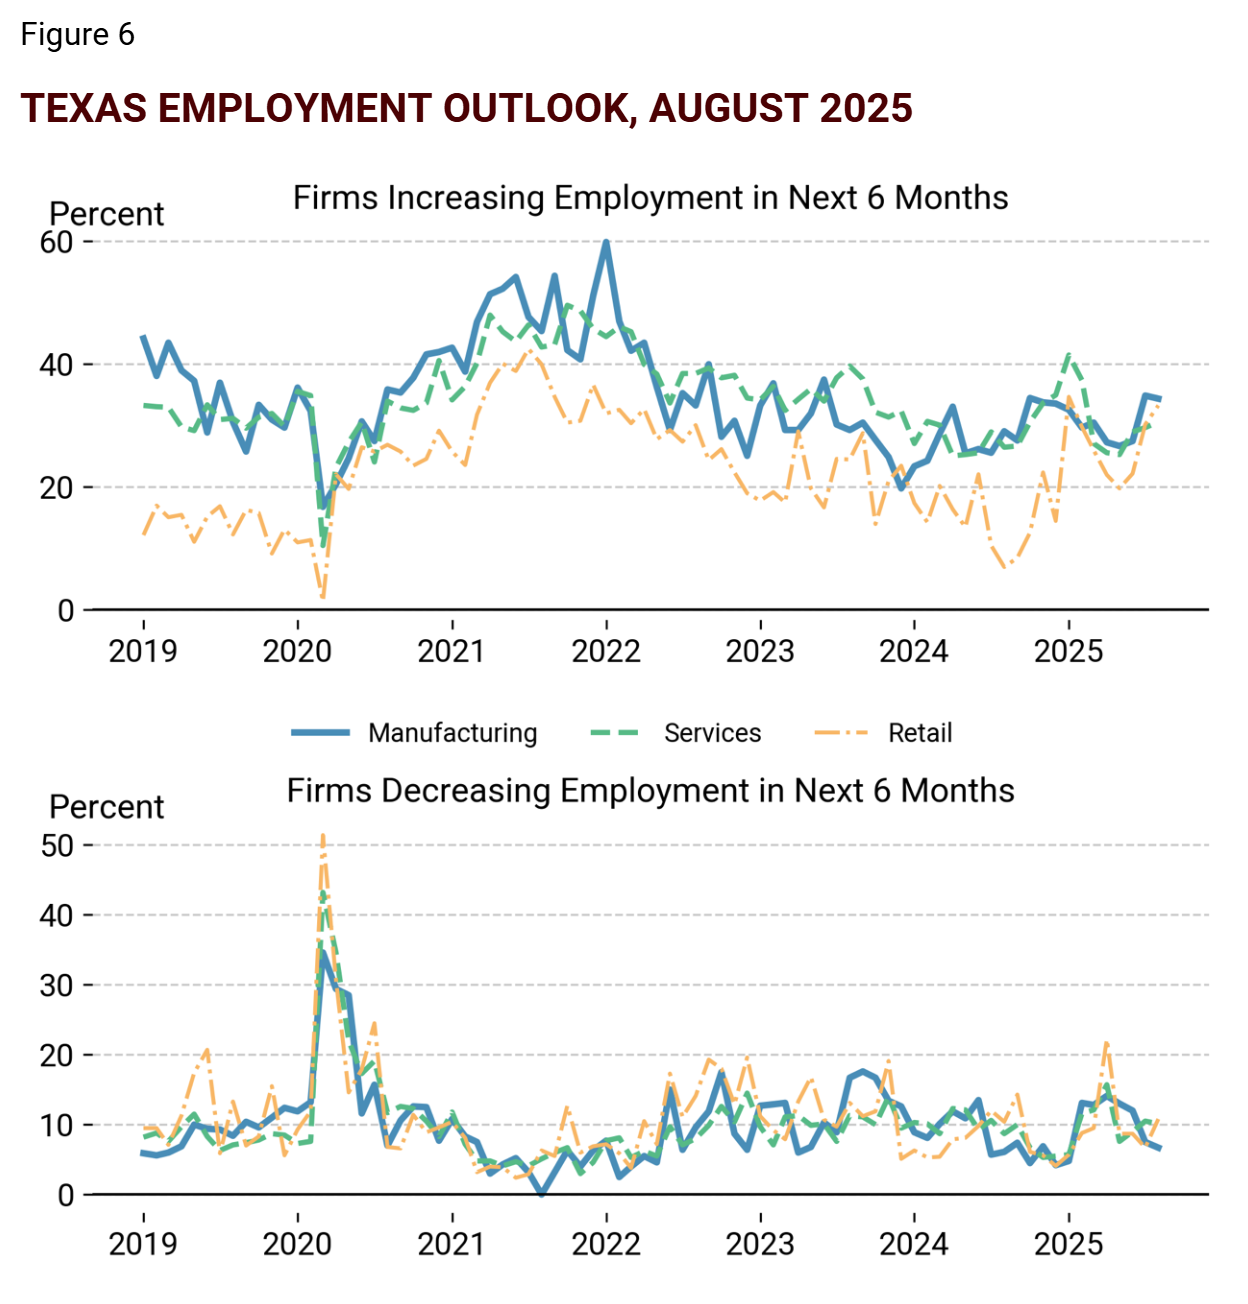
Notes: Share of Texas firms planning to increase (top) or decrease (bottom) employment in the next 6 months, by major sector.
Source: Federal Reserve Bank of Dallas
Housing and Mortgage Rates
The Federal Housing and Finance Agency (FHFA) released the 1Q2025 house price index. The recent data shows a steady decline in the growth rate of house prices at the national level, as it fell sharply year-over-year from 4.8 percent to 3.7 percent. Texas house prices also showed a steep decline from 2.7 percent to 1.7 percent. The Austin and San Antonio regions were both in negative territory at -0.9 percent and -0.2 percent, respectively, while the Dallas and Houston area home prices grew at a positive rate of 0.6 and 2.3 percent, respectively.
Mortgage rates dipped slightly in August but remained elevated, as rates fell by 16 basis points from 6.72 percent to 6.56 percent (Figure 7). Broad-based housing cost measures across the U.S. continued showing deceleration in the housing market as heightened mortgage rates and a sustained macroeconomic deceleration continue weighing on housing market activity.
As the Federal Reserve pivots to more accommodative policy in the coming months, short-term rates are likely to decline. Long-term rates on certain financial assets, including mortgages, may depend extensively on the Fed’s outlook on its balance sheet policy.
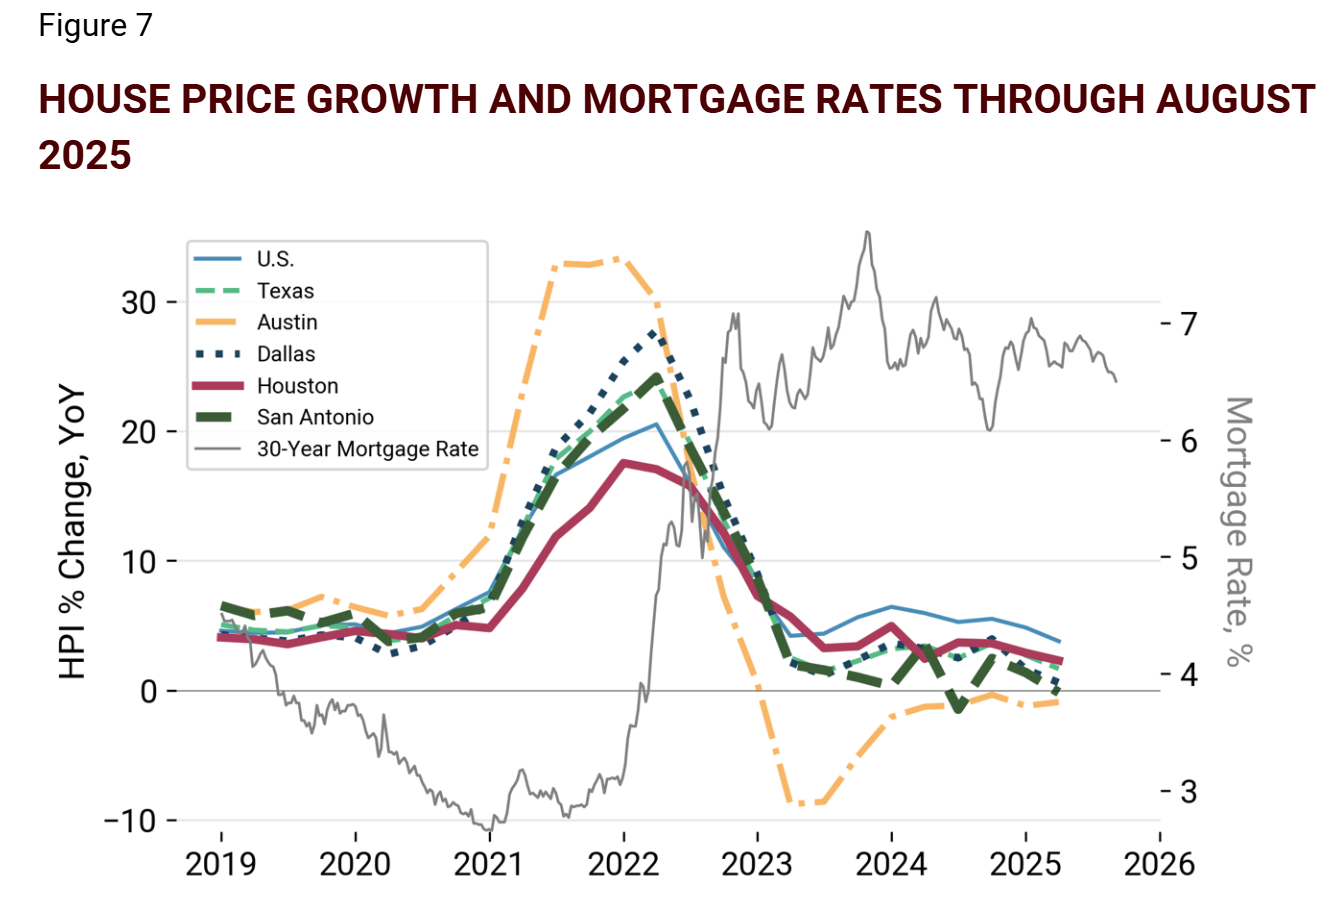
Notes: House price index data is provided through 2Q2025, and mortgage rate data is provided through the end of August.
Source: FHFA and Freddie Mac, accessed via FRED
The mortgage spread (Figure 8)—defined as the premium of mortgage rates over the 10-year Treasury yield—continued a slow decline, falling 6 basis points in August, from 237 to 231 basis points (i.e., from 2.37 percentage points to 2.31 percentage points). The mortgage spread, which provides useful context of mortgage rates in broader capital markets, remains elevated compared to the historical range of 150-175 basis points. This suggests that as capital markets normalize, mortgage rates could decline by another 75 to 100 basis points, relative to the 10-year Treasury yield.
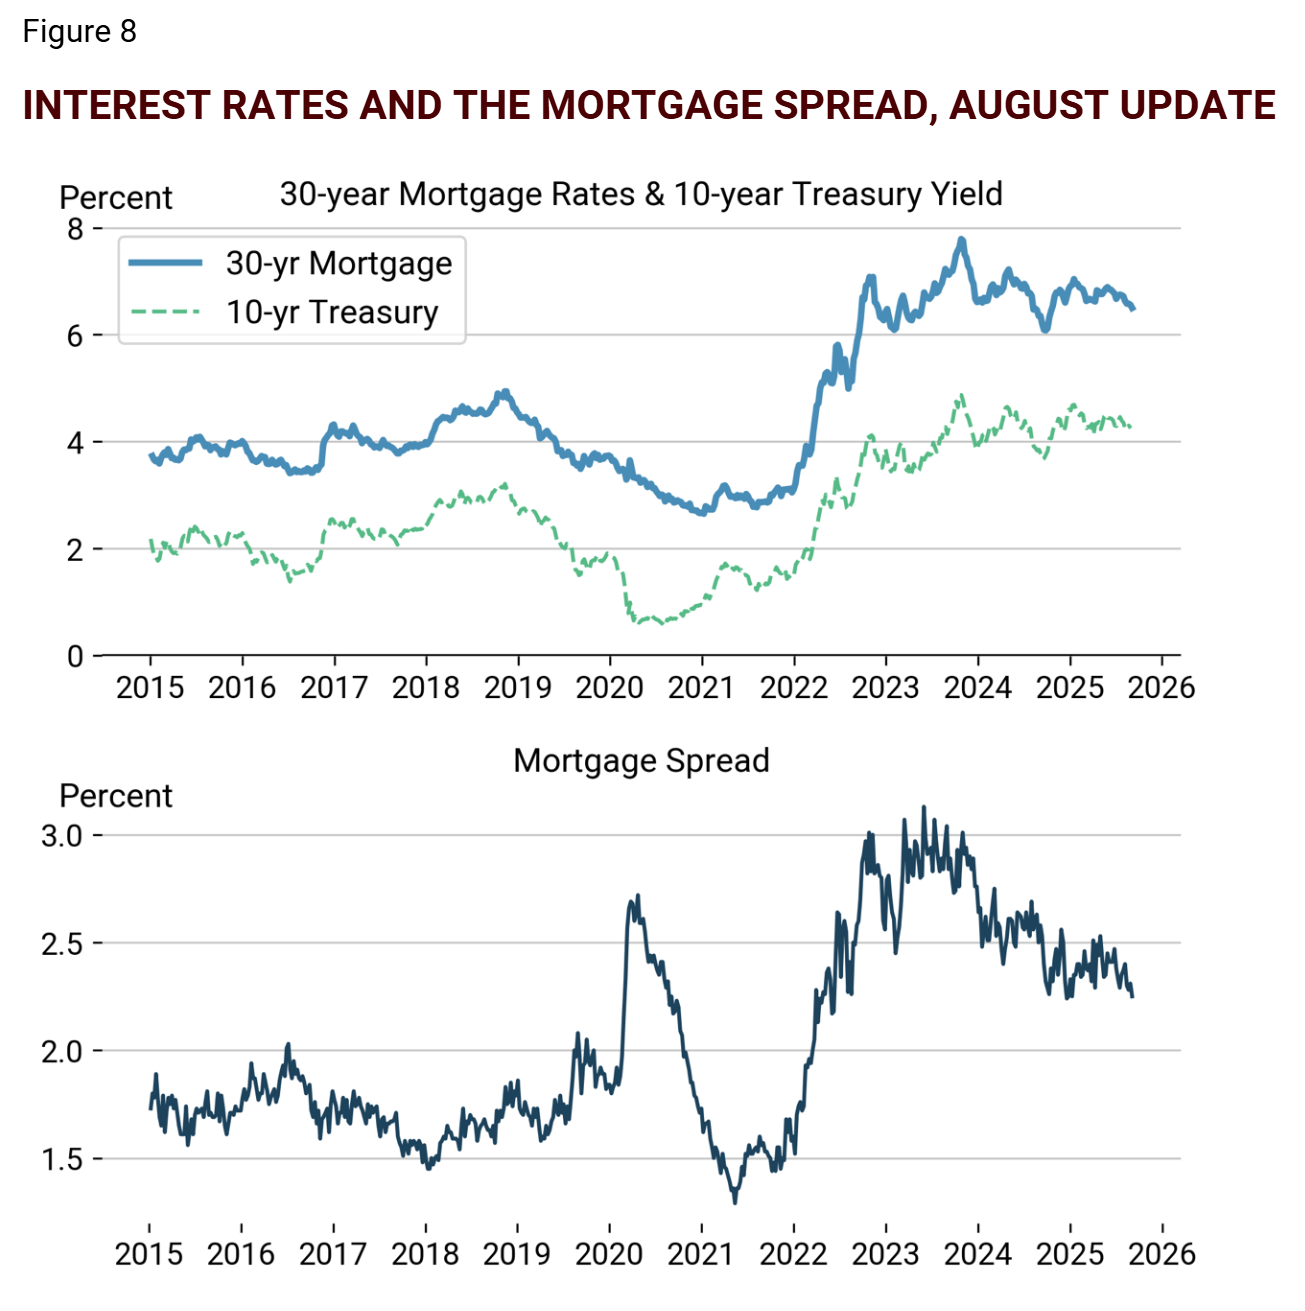
Notes: The mortgage spread is defined as the 30-year mortgage rate minus 10-year Treasury yield. Its typical range is 1.5 percent to 1.75 percent (150 to 175 basis points).
Source: Freddie Mac, Board of Governors of the Federal Reserve, and author’s calculations; data accessed via FRED
For more information on the Texas housing outlook, read TRERC’s monthly Texas Housing Insight report.