
Fish maintenance and trial design
The sourcing of swamp eel and the rearing procedures employed in this study have been described in previous studies [6, 54]. Briefly, healthy and mature individuals (with females weighing 80–150 g and males > 250 g) from Baishazhou Aquatic Products Wholesale Market (Wuhan, China) were selected as parents to generate the sibling offspring via artificial insemination. The embryos and larval swamp eel were incubated in the incubator of a cell culture room for 4 months, reaching the juvenile stage at 120 days post-fertilization (dpf). The juveniles were then transferred to the indoor recirculating system, maintained at a temperature of 25–28 °C, a pH of 7.2–8.0, and adequate dissolved oxygen levels. They were fed with frozen bloodworms at a rate of 0.5–1% of body weight 2–4 times daily for an additional 10 months, with feeding ceasing 7 days prior to sacrifice. Finally, adult swamp eel was sampled at 430 dpf for subsequent investigations.
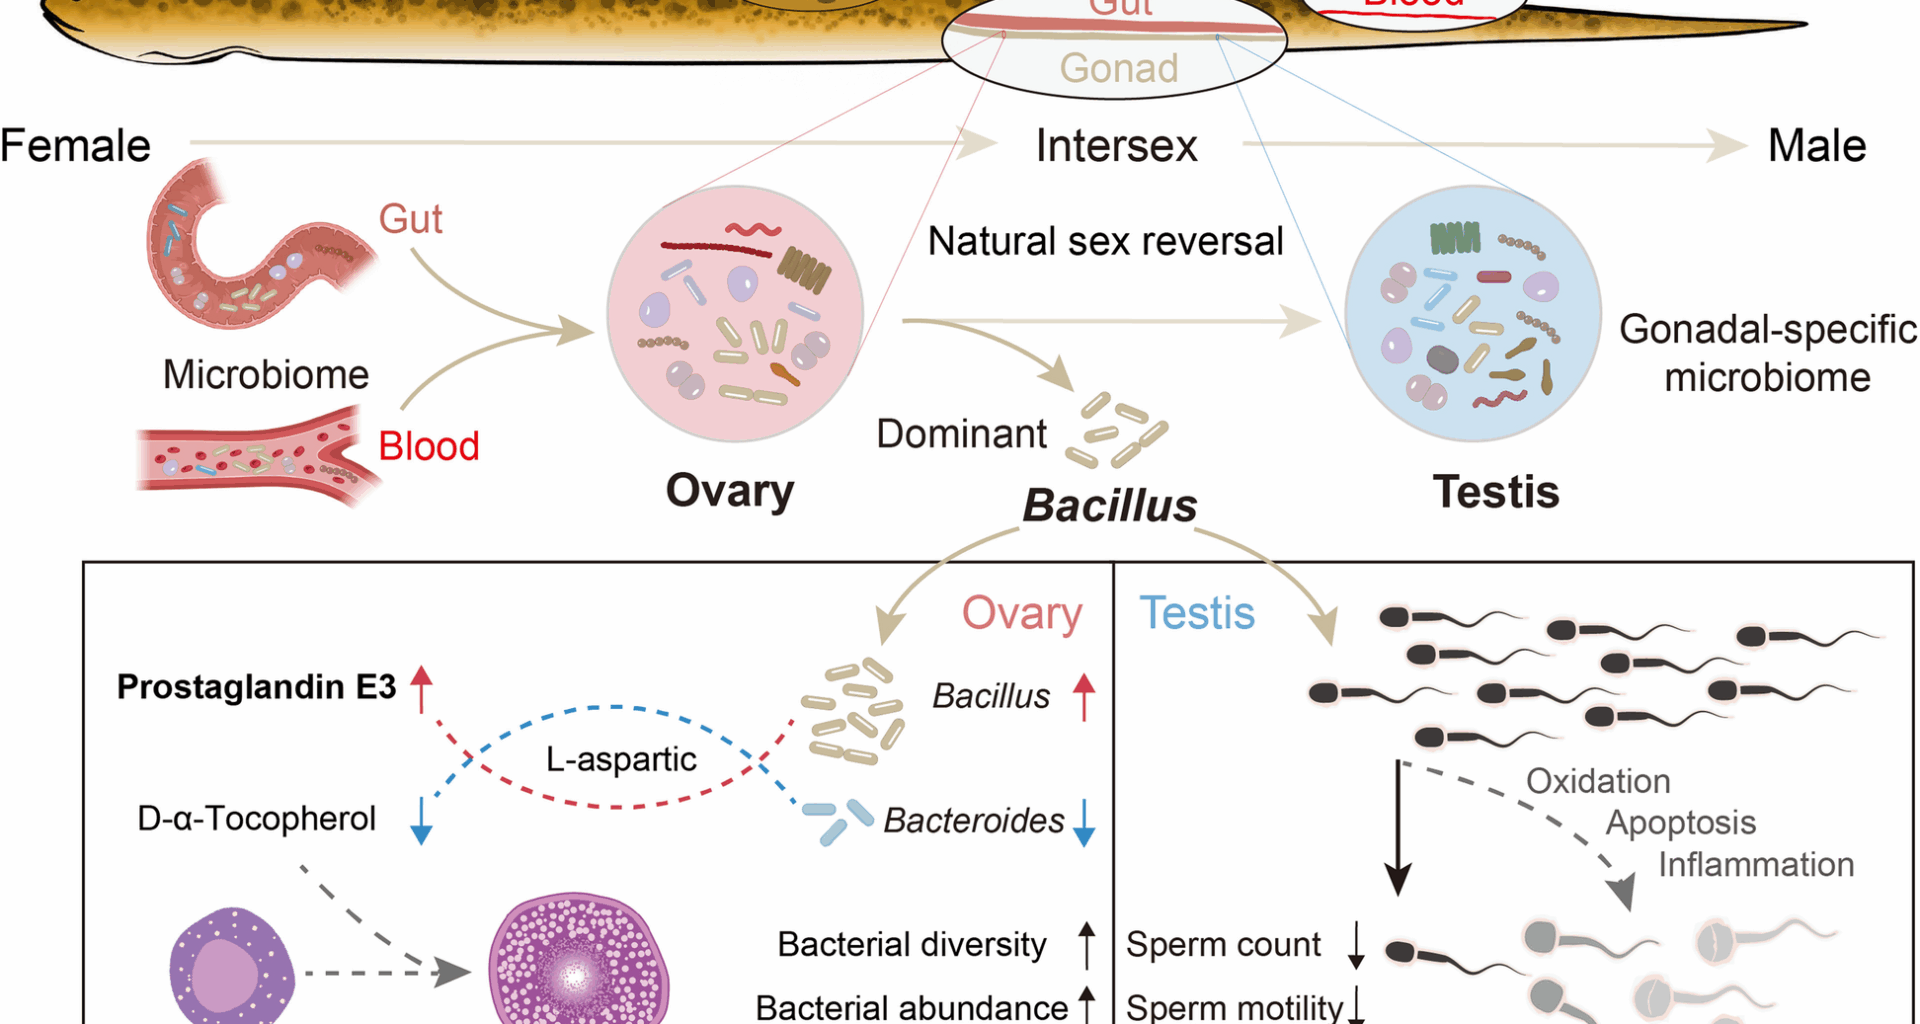
Before sampling, the water in which the fish lived was first collected for 16S rRNA sequencing to obtain the background composition of the bacterial community in the water environment. Subsequently, the swamp eel was anesthetized with MS-222, and the blood was collected using a disposable sterile syringe. After sterile dissection of the skin and gut, the gonads were separated and divided into two segments. One of them was fixed immediately in 4% neutral formalin buffer for sex identification and histological observation. The other segment was stored in sterile freezing tubes for sequencing. All of these collected tissues were immediately frozen with liquid nitrogen and stored at − 80 °C for further study.
Histology and light microscopy studies
After being fixed in 4% neutral formalin buffer at 4 °C overnight, gonadal samples extracted from female and male swamp eel were dehydrated in a graded ethanol series, permeabilized with xylene, embedded in paraffin, and then cut into 4 μm sections. The sections were rehydrated and stained with hematoxylin and eosin (H&E) for routine histological examination as follows: dewaxed in xylene, rehydrated through a graded ethanol series, stained the nucleus with a hematoxylin solution, and the cytoplasm with an eosin solution, finally sealed with resin. Images were collected and analyzed using an automatic digital slide scanner (Leica, Germany).
Identification and challenge of gonadal bacteria in swamp eel
To verify the key bacteria in the gonads, we sampled the gonadal tissue of swamp eel in sterile PBS. After homogenization by bead beating for 2 min at 60 Hz, 100 μl homogenate was absorbed onto the plate preparation of Mannitol-Egg-Yolk-Polymyxin Agar Base (MYP), Columbia Agar Medium (CAM), and LAMVAB Agar (LAMVAB), respectively. After being incubated upside-down for nearly 14 h at 37 °C in a humidified CO₂ incubator, single colony was then selected and cultured in Brain Heart Infusion Broth (BHI) following 12h incubation at 37 °C with continuous shaking (220 rpm) in a temperature-controlled incubator. Bacterial universal primers were used for amplification in a 50-μl reaction, including 25 μl 2 × PCR master mix, 2 μl bacteria template, and 2 μl primers as the following conditions: 95 °C for 10 min, followed by 35 cycles of 95 °C for 30 s, 58 °C for 30 s, 72 °C for 1 min and a final extension at 72 °C for 10 min. After being analyzed by agarose gel electrophoresis and photographed, the PCR products were purified and sequenced.
For the swamp eel challenge, we made slight modifications according to previous studies [55, 56]. Specifically, 60 fish (∼ 100–120 g) were challenged with Bacillus via intraperitoneal injection at a final concentration of 105, 106, and 107 CFU/ml for each challenge experiment, and then migrated into the aquarium containing fresh culture water. Gonads were collected daily from 3 individuals from days 1 to 5 after injection. Both experiments were performed at least three independent times. As a control, the same number of fish were maintained in a similar tank and injected with the same culture medium without bacteria. The samples from the control fish were also collected from days 1 to 5 after the medium culture mock challenge. The gonads from 106 CFU/ml challenged female swamp eel were collected for subsequent 16S rRNA gene sequencing and metabolome sequencing. The testes challenged with the same concentration were collected for downstream research. Moreover, the water in which the fish lived was also collected for 16S rRNA sequencing before sampling.
RNA isolation and quantitative real-time PCR analysis
Total RNA was extracted according to the manufacturer’s instructions. The concentration of RNA was measured using a spectrophotometer (Nanodrop One), and the completeness was analyzed by agarose gel electrophoresis. Approximately 2 μl of RNA (1000 ng in total) was reverse transcribed into cDNA with Hifair III First-Strand cDNA Synthesis SuperMix for qPCR (YEASEN) following the manufacturer’s instructions. The synthesized cDNA was diluted five times and then used as a template for quantitative real-time PCR (qRT-PCR) analysis. The qRT-PCR was performed in triplicate, and each contained 1 μl of a diluted cDNA template, 5 μl of SYBR Real-time PCR Master Mix plus (Monad), and 0.5 μl forward and reverse primers in a 10-μl reaction volume. The amplification profile was performed as follows: 95 °C for 2 min, followed by 40 cycles of 95 °C for 10 s, 60 °C for 10 s, and 72 °C for 10 s. A dissociation protocol was carried out by reading fluorescence at every 0.5° between 72 and 95 °C after thermal cycling to confirm that only a single band of the correct size was amplified. The relative expression levels were analyzed by the 2−∆∆CT method, and elongation factor 1α (ef-1α) and ribosomal protein L17 (rpl17) were used as internal controls [6, 57]. The primers used in this study are listed in Table S2.
DNA extraction, PCR amplification, and Miseq sequencing
The genomic DNA was extracted using the MagPure Stool DNA KF Kit B (Magen, China) following the manufacturer’s instructions. The concentration and quality of the extracted DNA were subsequently determined with a Qubit fluorometer (Invitrogen, USA) and checked by running an aliquot on a 1% agarose gel, respectively. PCR amplification was performed in a 50 μl reaction mixture to obtain the V3–V4 regions of the 16S rRNA gene using 30 ng template, PCR master mix, and the bacterial universal primers 338F (5′-ACTCCTACGGGAGGCAGCAG-3′) and 806R (5′-GGACTACHVGGGTWTCTAAT-3′) as the following program: 94 °C for 3 min, followed by 30 cycles of 94 °C for 30 s, 50 °C for 45 s, 72 °C for 45 s, and final extension at 72 °C for 10 min. The PCR products were purified with Agencourt Ampure XP beads and eluted in elution buffer. Libraries were qualified by the Agilent 2100 bioanalyzer (Agilent, USA). The validated libraries were applied for sequencing on the Illumina MiSeq platform (BGI, China) following the standard pipelines of Illumina, and generating 2 × 300 bp paired-end reads.
Raw reads were filtered by an in-house procedure and paired-end reads were merged to tags with FLASH [58]. The tags were clustered into OTUs with a 97% threshold by using UPARSE, and the OTUs unique representative sequences were obtained. Then, OTUs representative sequences were taxonomically classified using the RDP Classifier with a minimum confidence threshold of 0.6, and trained on the RDP Release16 database by QIIME2 [59]. The USEARCH global was used to compare all tags back to OTUs to obtain the OTU abundance statistics table of each sample. Alpha and beta diversity were estimated by MOTHUR and QIIME2 at the OTU level, respectively. PCA of the OTUs was plotted with the R package “ade4.” The relative contribution of microbial communities was predicted by microbial Sourcetracker2 analysis [60]. LEfSe cluster or LDA analysis was conducted by LEfSe. The sample clustering was conducted by QIIME2 based on UPGMA. Barplot and heatmap of different classification levels were plotted with R package v3.4.1 and R package “gplots,” respectively.
Metabolite extraction and LC–MS conditions for analysis
The samples (approximately 25 mg) were employed for metabolite extraction by mixing with 800 μl precooled extraction reagent (methanol: acetonitrile: water (2:2:1, v/v/v)) and lysis using a TissueLyse bead-mill homogenizer (Qiagen, Germany). After centrifugation at 25,000 g at 4 °C for 20 min, 600 μl of supernatant from each sample was collected and filtered using an SPE column for solid-phase extraction, and the soluble metabolites were dissolved in acetonitrile. Approximately 10 μl from each sample was pooled together as a QC sample and used to assess the reproducibility and reliability of the LC–MS method.
Subsequently, chromatographic separations were performed using an ultra-performance liquid chromatography (UPLC) system (Waters, USA). An ACQUITY UPLC BEH C18 column (100 × 2.1 mm, 1.7 μm; Waters, USA) was used for the reversed phase separation. The column oven was maintained at 45 °C. The flow rate was set at 0.35 ml/min, and the mobile phase consisted of 0.1% formic acid (A) and acetonitrile (B) in the positive mode, and in the negative mode, the mobile phase consisted of 10 mM ammonium formate (A) and acetonitrile (B). The eluted metabolites were introduced into a Q Exactive HF high-resolution mass spectrometer (Thermo Fisher Scientific, USA). The full scan range was 70 to 1050 m/z with a resolution of 120,000. The top 3 precursors were selected for subsequent MS fragmentation with a maximum ion injection time of 50 ms and a resolution of 30,000. The stepped normalized collision energy was set to 20, 40, and 60 eV. Electrospray ionization (ESI) parameters were set as: sheath gas flow rate was 40, Aux gas flow rate was 10, positive-ion mode spray voltage was 3.8 kV, negative-ion mode spray voltage was 3.2 kV, capillary temperature was 320 °C, and Aux gas heater temperature was 350 °C.
The raw data were imported into the software Compound Discoverer 3.3 for peak detection and alignment. The assigned modified metabolites were identified by searching the HMDB database (http://www.hmdb.ca/spectra/ms/search) using Progenesis QI. The molecular mass data (m/z) and retention times (min) were used to identify the metabolites. The putative metabolites were mapped to the Kyoto Encyclopedia of Genes and Genomes (KEGG; http://www.genome.jp/kegg/) by matching the m/z of our samples with those from the database. The pre-processed data were imported to MetaX, an R package software for statistical analysis. The dataset was also subjected to unsupervised multivariate statistical analyses, including principal component analysis (PCA) and partial least-square discriminant analysis (PLS-DA), using SIMCA v.13.0 software. Responsive metabolites were identified using receiver-operating characteristic (ROC) curve analysis by calculating the area under the curve (AUC) using the pROC package in R. Cytoscape v.3.3 was used for visualization of the relationship among metabolites and pathways.
Microbiome‑metabolome integrative analysis
For the association analysis, correlation coefficients were calculated using the abundance of metabolites and the relative abundance of microbial groups. Data were neutralized and normalized. Following unsupervised analyses on each dataset, which were completed to explore and visualize any changes according to treatments, the integration was carried out. In addition to the PCA and PLS-DA, which represented the overall situation of the original data, the heatmap produced correlations between the microbial groups and differential metabolites. By comparing the ROC curves among the separate modeling of different omics and the combined data modeling, which omics can better screen the best biomarkers for the two groups was evaluated. Moreover, Spearman’s correlation analysis evaluating the monotonic relationship between two continuous or ordinal variables was performed using the corr.test in R software.
Testis DHE and TUNEL staining
Changes in ROS production induced by Bacillus were evaluated by staining with dihydroethidium (DHE, Beyotime). Briefly, testis sections were paraffined, dewaxed with xylene, washed with ethanol, and then incubated with DHE at a final concentration of 10 mM at 37 °C for 40 min in the dark. After being washed with PBS, the sections were stained with 1 μg/ml 4,6-diamidino-2-phenylindole (DAPI) for 10 min in the dark at room temperature. The fluorescence was observed under an Olympus IX51 fluorescence microscope.
TUNEL staining of tissue sections was conducted using the In Situ Cell Death Detection Kit (Roche, 11,684,817,910). Briefly, testis sections were paraffined, dewaxed with xylene, washed with ethanol, and then incubated with proteinase K at 37 °C for 30 min, followed by incubation with the provided fluorescein-conjugated TUNEL reaction mixture in a humidified chamber at 37 °C for 2 h in the dark. The cell nuclei were further stained with 1 μg/ml DAPI for 10 min in the dark at room temperature. The fluorescence was observed under an Olympus IX51 fluorescence microscope.
Sperm collection and SEM scanning
The testis of each male swamp eel was removed and squeezed with tweezers for the preparation of the sperm sample, which was temporarily kept in ice-cold Hank’s Balanced Salt Solution (HBSS) as previously described [53]. Subsequently, the sperm from each species were plated on poly-d-lysine-coated cover glasses and submerged into fixation solution overnight at 4 °C. Next, the sperm were postfixed in 1% osmium tetroxide in 0.1 M phosphate buffer (PB) for 2 h in the dark and sequentially dehydrated in 30, 50, 70, 80, 90, 95, 100, and 100% ethanol solutions for 15 min. The samples were critical point dried with liquid carbon dioxide (Quorum, China), mounted on aluminum stubs, and metalized with gold (Hitachi, Japan) for later observation using a scanning electron microscope (Hitachi, Japan).
Sperm motility analysis
Taking 50 μl purified sperm samples were mixed with BHI medium containing Bacillus in equal volumes (the ratio of sperm to bacteria was 1:10), and the mixed samples were incubated at room temperature for 4 h, with slight modifications to the previous report [52]. Subsequently, a mixture of 10 μl was placed on a slide to dry, then fixed with methanol for 30 min, stained using the Gram staining procedure, and examined under an optical microscope (Olympus BX63). Moreover, after being diluted to an appropriate concentration, a 0.5 μl sperm sample was added to 2 μl water to activate the sperm on a specialized slide glass (2 × cells, 20 μm, Hamilton Thorne) and covered with a matched coverslip. A computer-assisted sperm analysis system (CEROS II Animal, Hamilton Thorne, USA) was applied to detect and analyze sperm motility after incubation with the tested bacteria for 4 h. At least eight regions of the chamber were recorded for each sample, and the entire experimental procedure starting from the dissected testis was completed within 6 h for all samples. The sperm parameters related to total motility were measured and summarized in Table S3.
Statistical analysis
The unpaired Student’s two-tailed t test (Prism version 8.0; GraphPad) was performed to determine the statistical significance in the bacterial diversity and abundance, gene expression, testis histology, and sperm motility. P values of 0.05 or less were considered statistically significant.