
The known: Liver disease causes considerable premature morbidity and mortality in Australia, but data on the causes of death of people with cirrhosis are limited.
The new: More than 55% of deaths of people with alcohol‐ or chronic viral hepatitis‐related cirrhosis are liver‐related, but only 31% of deaths of people with metabolic dysfunction‐associated steatotic liver disease. A considerable proportion of the latter group die of extrahepatic cancer or cardiovascular disease, probably reflecting more frequent comorbidity and their higher mean age.
The implications: Targeted public health measures for particular patient subgroups are required to save lives of people with cirrhosis.
Liver disease is one of the leading causes of early death in Australia.1 During 2003–2023, the burden of chronic liver disease increased by 13%, and that of liver cancer by 39%.2 Advances in the therapy and funding of antiviral treatment for people with hepatitis C virus (HCV) infections have made cure easy, safe, and accessible, preventing progressive liver disease for more than one hundred thousand Australians.3 In contrast, alcohol consumption remains a major cause of liver disease in Australia.4 More than five million people (26.8% of adults) exceeded the Australian harm reduction guideline levels of alcohol consumption in 2022, and risky drinking rates are concerningly high for men and young adults.5 The high and increasing prevalence of obesity and its complications (eg, type 2 diabetes, dyslipidaemia, hypertension) means that metabolic dysfunction‐associated steatotic liver disease (MASLD) is now the leading cause of chronic liver disease around the world, affecting more than 30% of adults;6 in Australia, its prevalence is projected to increase by 25% during 2019–2030.7
Despite the high burden of premature mortality, data regarding the causes of death for people with cirrhosis are limited. This information is crucial for setting priorities for prevention and developing models of care and public health programs informed by information specific to Australia. We therefore determined the cumulative incidence of overall and cause‐specific mortality for Queensland residents admitted to hospital with cirrhosis during 2007–2022, by cirrhosis aetiology.
Methods
For our retrospective cohort study, we analysed probabilistically linked Queensland Hospital Admitted Patient Data Collection (QHAPDC) and Queensland Registry of Births, Deaths, and Marriages data for all people hospitalised with cirrhosis in Queensland during 1 July 2007 – 31 December 2022. We assessed the underlying cause of death (also referred to as cause of death) and associated (or contributing) causes of death. We report our study according to the Strengthening the Reporting of Observational Studies in Epidemiology (STROBE) criteria for cohort studies.8
Selection of cases and index admission
We identified all admissions to public and private Queensland hospitals of adult Queensland residents (18 years or older) with cirrhosis, as coded using the International Classification of Diseases, tenth revision, Australian modification (ICD‐10‐AM; Supporting Information, table 1) during 1 July 2007 – 31 December 2022. The first admission with cirrhosis, ascites, hepatic encephalopathy, variceal bleeding, primary liver cancer, hepatorenal syndrome, or hepatic failure was defined as the index admission for an individual. People were followed from their index admission until the date of death, liver transplantation, or 31 December 2022, whichever came first. Cirrhosis aetiology was categorised using a hierarchical algorithm9 as alcohol‐related, MASLD or cryptogenic (probably undiagnosed MASLD, and therefore included in this aetiology group in our study), HCV‐related, hepatitis B virus (HBV)‐related, or other (details: Supporting Information, supplementary methods).
Measurements
Socio‐demographic data — including Indigenous status,10 and residential postcode‐based remoteness (Accessibility/Remoteness Index of Australia)11 and socio‐economic status (Index of Relative Socioeconomic Disadvantage)12 — were obtained from QHAPDC, and the date and causes of death from the Deaths Registry (Supporting Information, supplementary methods). Comorbidity (medical conditions other than liver disease and hepatocellular carcinoma) was measured with the Charlson Comorbidity Index.13,14 Severity of liver disease was assessed according to the presence of cirrhosis decompensation (variceal bleeding, ascites, hepatic encephalopathy), hepatorenal syndrome, or hepatic failure at the index admission. People were deemed to have experienced decompensation during follow‐up after the index admission if they were subsequently re‐admitted at least once with variceal bleeding, ascites, or hepatic encephalopathy.
Outcomes
The primary outcome was underlying cause of death: liver‐related (liver diseases, chronic hepatitis, primary liver malignancies), extrahepatic cancer (all cancers except primary liver malignancies), cardiovascular disease (major adverse cardiovascular events14), diabetes, respiratory disease, infectious or parasitic diseases (excluding chronic hepatitis), external causes, or other (ICD‐10‐AM groups for which the prevalence was less than 2%). We also examined the distribution of all causes of death (underlying and associated).
Data analysis
Statistical analyses were conducted in Stata/SE 18. We describe the cohort using descriptive statistics: numbers and proportions, means with standard deviations (SDs), or medians with interquartile ranges (IQRs). Cumulative overall survival was assessed using the Kaplan–Meier method; we report the log‐rank statistic. We assessed the statistical significance of differences in cumulative all‐cause mortality by cirrhosis aetiology using multivariable Cox regression analysis; we report adjusted hazard ratios (HRs) with 95% confidence intervals (CIs). To mitigate the shortcomings of the hierarchical algorithm that categorises cirrhosis aetiology based on a single aetiology,9 we also examined the contribution of the most frequent concomitant liver diseases to all‐cause mortality (non‐alcoholic fatty liver disease [NAFLD; ICD‐10‐AM K76.0] or non‐alcoholic steatohepatitis [NASH; K75.8] for people with alcohol‐related cirrhosis; alcohol and chronic HBV infections for people with HCV‐related cirrhosis). We assessed differences in cumulative cause‐specific mortality by cirrhosis aetiology using Fine and Gray proportional subdistribution hazard models,15 with other causes of mortality as a competing risk; we report adjusted subdistribution hazard ratios (sHRs) with 95% CIs. We used the vce (robust) option to obtain robust standard errors for the parameter estimates to control for mild violations of underlying assumptions. Information about missing data is reported when applicable. As we could not determine whether people admitted to hospital with cirrhosis during 1 July 2007 – 31 December 2011 had ever been admitted with cirrhosis before this date, we undertook a sensitivity analysis that excluded these admissions.
Ethics approval
The Metro South Hospital and Health Services and QIMR Berghofer Human Research Ethics Committees (HREC/17/QPAH/23; P2209) approved the study.
Results
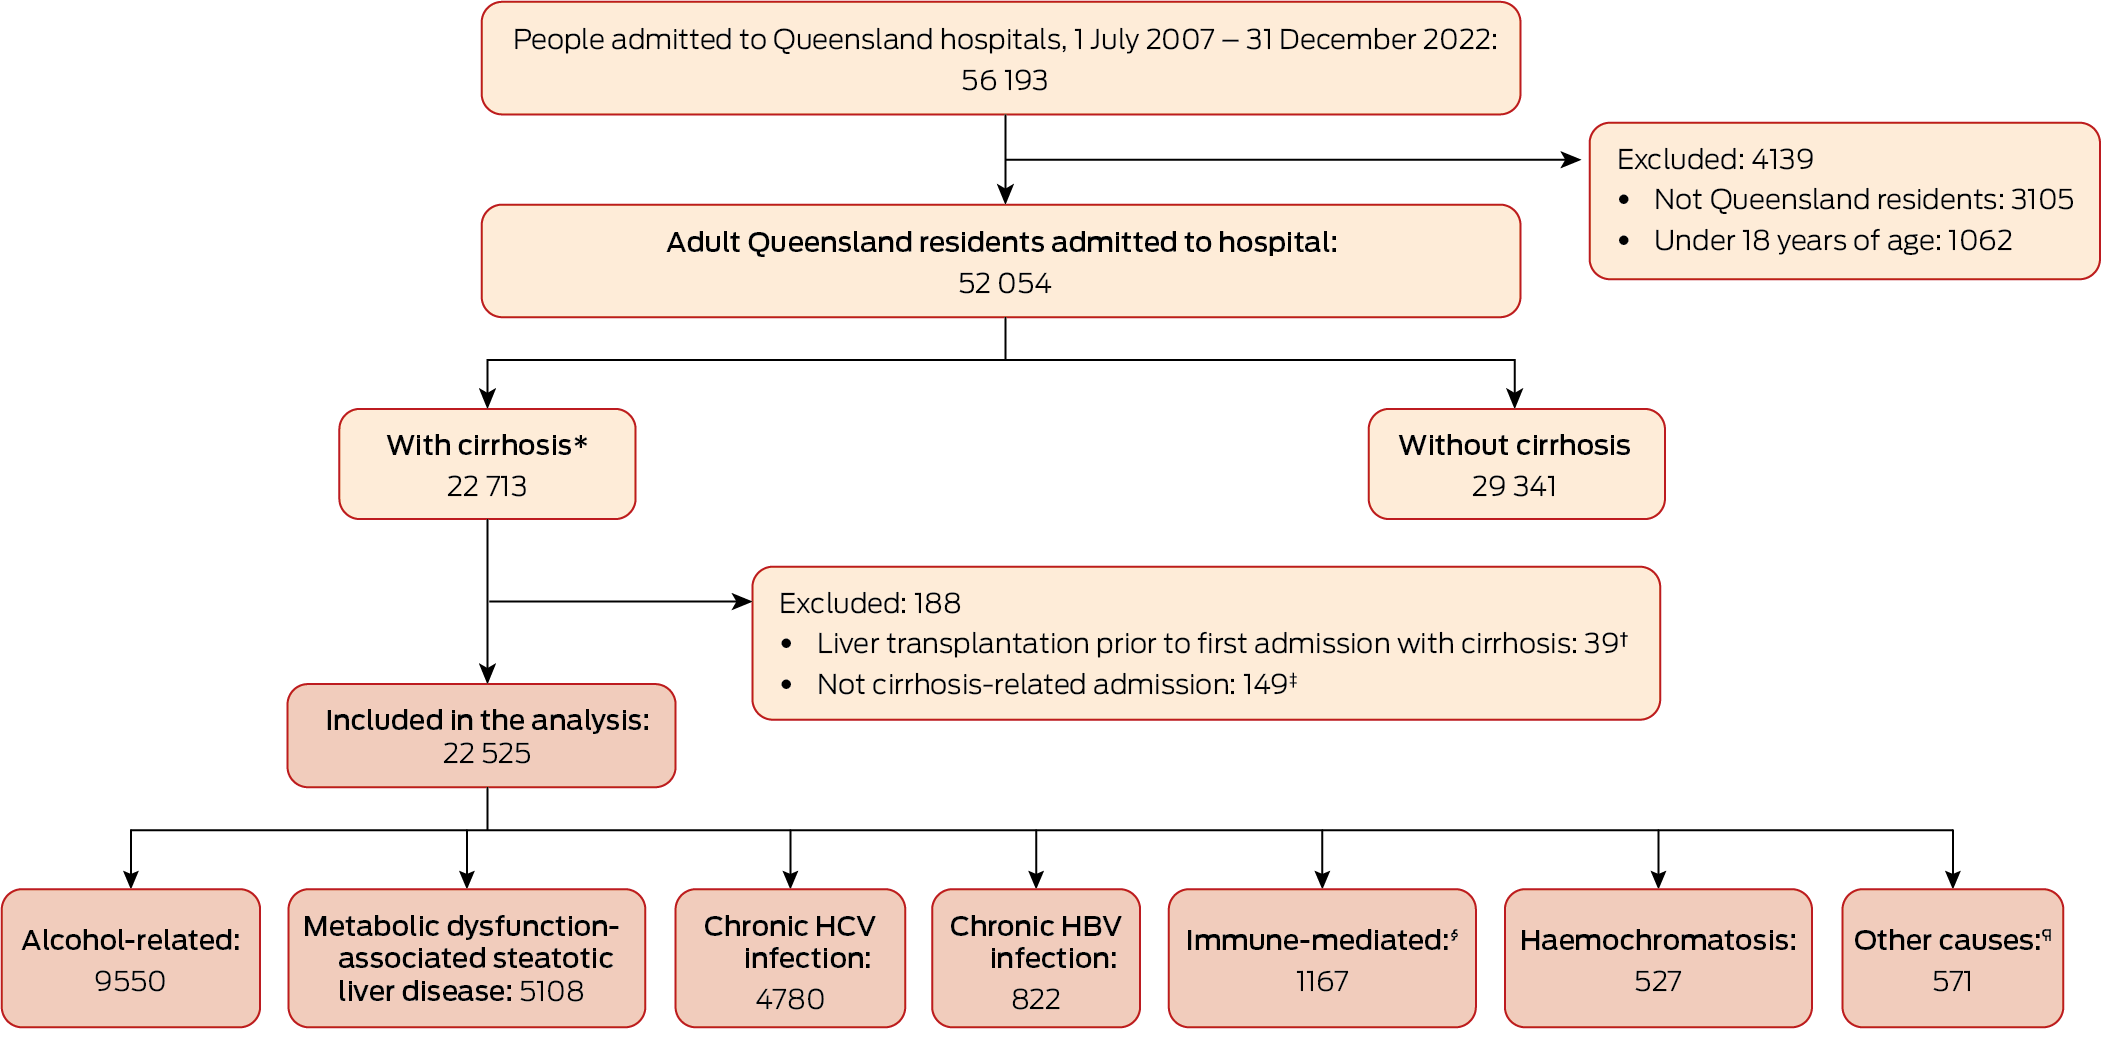
A total of 22 713 adult Queensland residents were admitted to Queensland hospitals with cirrhosis at least once during 2007–22. After excluding people who had received liver transplants prior to their index cirrhosis admissions and admissions that were not cirrhosis‐related, we included 22 525 patients in our analysis; the median follow‐up time was 6.9 (IQR, 3.5–11.1) years. Their mean age at the index admission was 61.2 (SD, 13.0) years, and 14 895 were men (66.1%). The most frequent cirrhosis aetiologies were alcohol (9550 people, 42.4%), MASLD (5108 people, 22.7%), and chronic HCV infection (4780 people, 21.2%) (Box 1).
Most people with cirrhosis related to alcohol (71.5%) or chronic HCV (74.4%) or HBV infections (70.2%) were men, as were 53.6% of patients with MASLD cirrhosis. The mean age at admission was highest for people with MASLD (69.1 years; SD, 12.6 years) and lowest for those with chronic HCV infections (54.7 years; SD, 9.6 years). More than 75% of people in each aetiology category had been born in Australia, apart from those with chronic HBV infections (353 people, 43.0%). The proportion of patients with two or more medical conditions (other than liver disease and hepatocellular carcinoma) on admission was largest for those with MASLD cirrhosis (2555 people, 50.0%). The proportion of people with cirrhosis decompensation, portal hypertension, or hepatic failure at the index admission was largest for those with alcohol‐related cirrhosis (4870 people, 51.0%) and smallest for those with MASLD cirrhosis (1519 people, 29.7%) (Box 2).
Underlying causes of death, by cirrhosis aetiology
A total of 12 387 people (55.0%) had died by 31 December 2022. The most frequent causes of death were liver‐related (6234 deaths, 50.3%), extrahepatic cancers (1438, 11.6%), and cardiovascular disease (1185, 9.6%). The proportions of liver‐related deaths were largest among people with HCV‐related (1489 deaths, 60.4%), alcohol‐related (3061, 55.4%), or HBV‐related cirrhosis (218, 54.6%) Extrahepatic cancers (507 deaths, 19.0%) and cardiovascular disease (384, 14.4%) as causes of death were most frequent among people with MASLD cirrhosis; external causes of death (accident, self‐harm, suicide, homicide) were most frequent among people with HCV‐related cirrhosis (127 deaths, 5.1%) (Box 3).
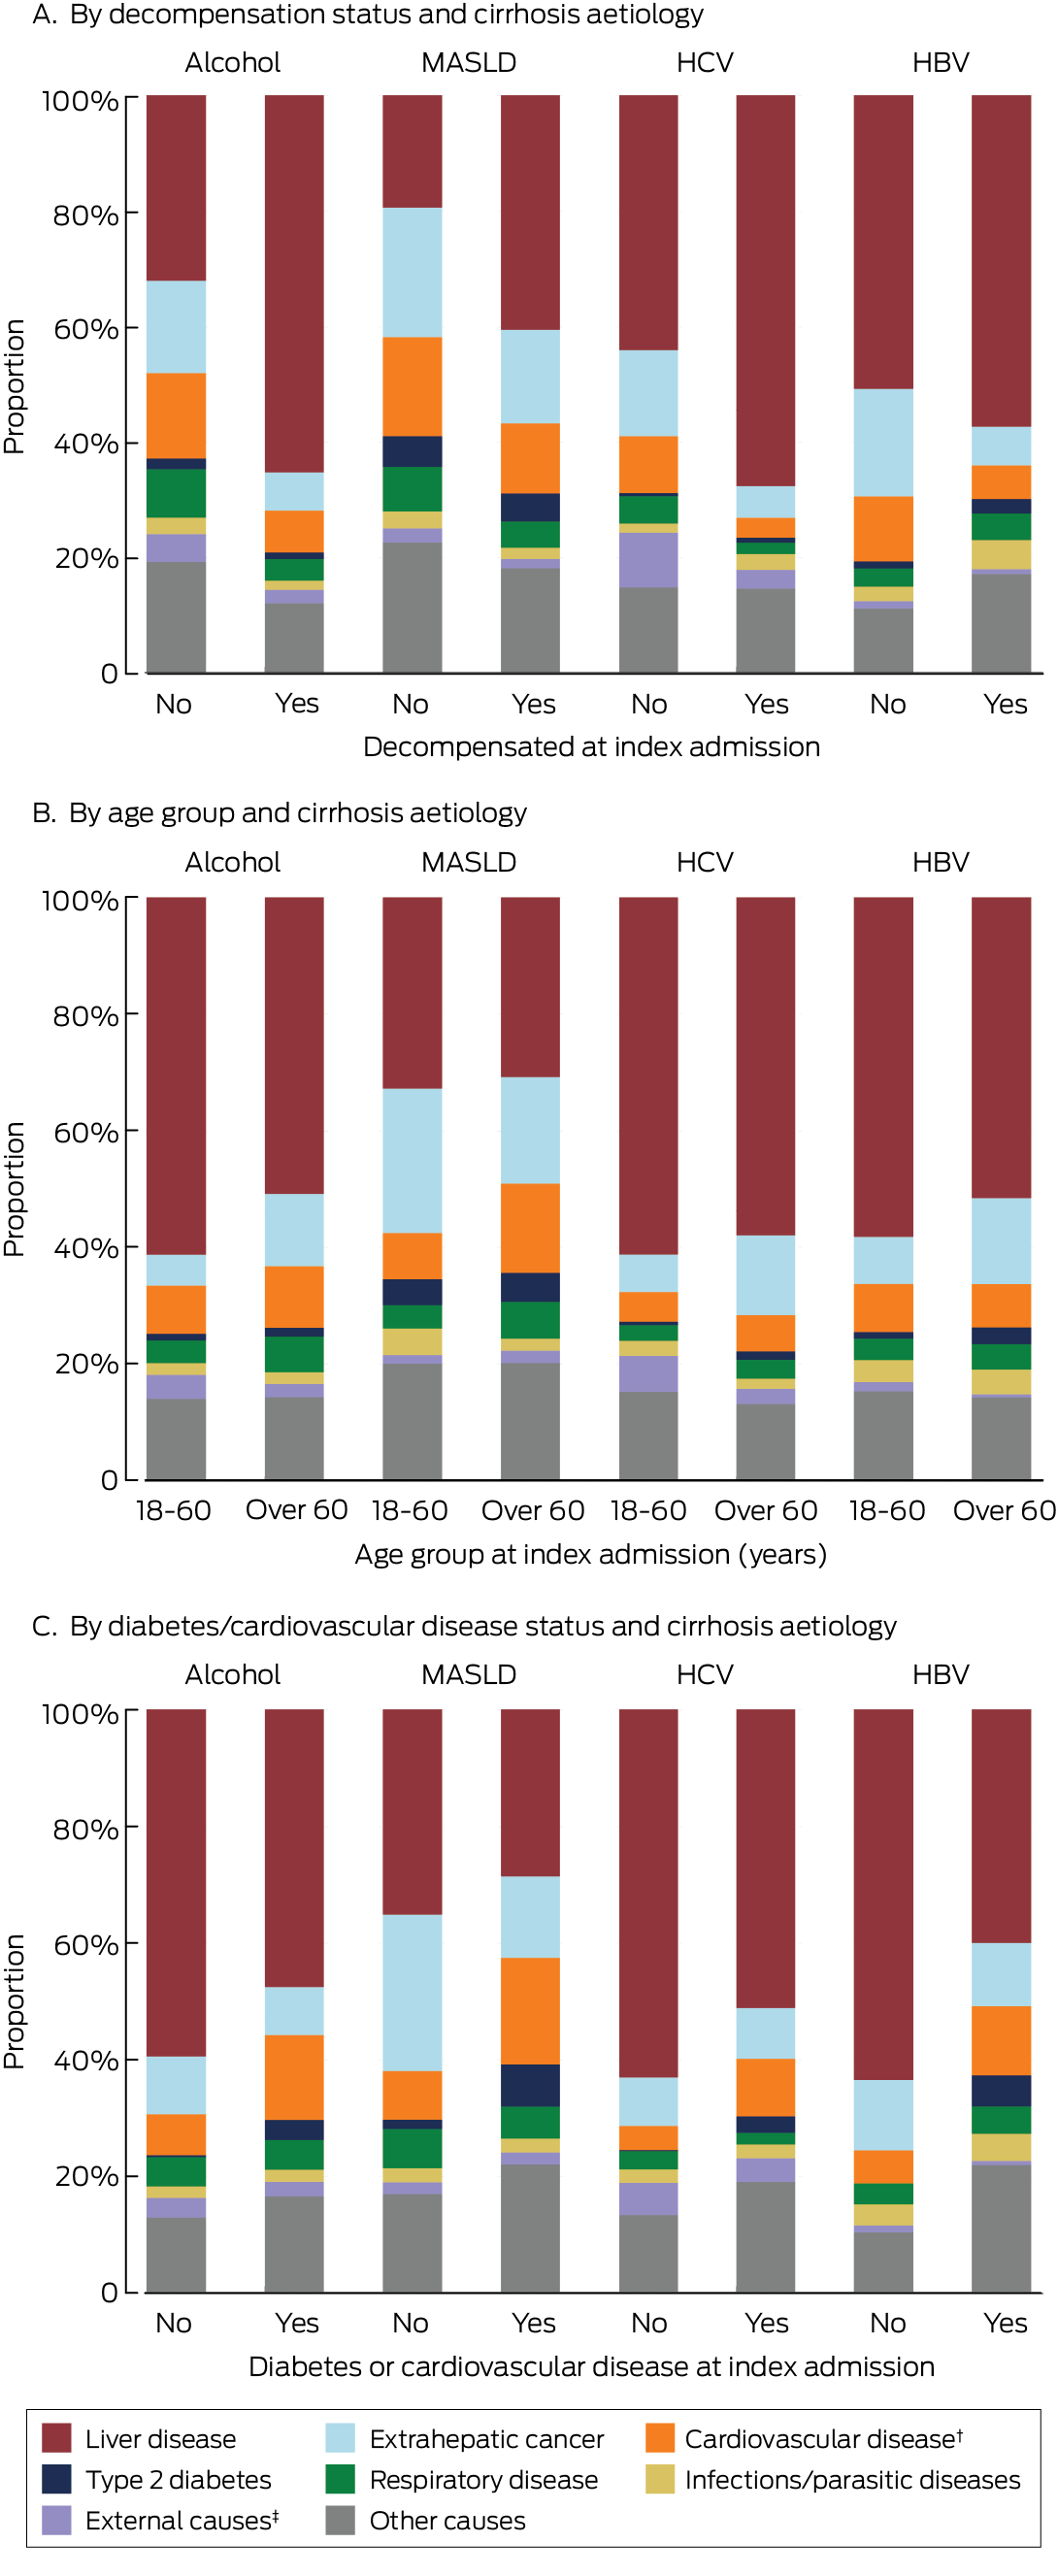
The proportion of deaths attributed to liver disease was larger for people who experienced decompensation during follow‐up than those who did not (alcohol‐related cirrhosis: 2538 of 3890 deaths [65.2%] v 523 of 1637 [31.9%]; MASLD cirrhosis: 595 of 1473 deaths [40.4%] v 230 of 1189 [19.3%]; HCV‐related cirrhosis: 1158 of 1714 deaths [67.6%] v 331 of 753 [44.0%]; HBV‐related cirrhosis: 137 of 239 deaths [57.3%] v 81 of 160 [50.6%]) (Box 4, A). Among people with alcohol‐related cirrhosis, cardiovascular disease and extrahepatic cancer were the underlying causes of death for 711 patients of 3073 over 60 years of age on admission (23.1%) and of 334 of 2454 patients under 60 years of age (13.6%) (Box 4, B). Cardiovascular disease was the cause of death for 299 of 1636 people with MASLD cirrhosis and type 2 diabetes or cardiovascular disease (18.3%). In all cirrhosis aetiology groups, liver‐related deaths were less frequent among people with type 2 diabetes or cardiovascular disease than people without these conditions; the difference was more marked among people with HBV‐related cirrhosis (with cardiometabolic risk factors: 60 of 150 deaths, 40.0%; without cardiometabolic risk factors: 158 of 249 deaths, 63.5%) (Box 4, C).
Associated and underlying causes of death, by cirrhosis aetiology
Liver‐related deaths were recorded for 1462 people with MASLD cirrhosis (54.9%), but the proportion exceeded 75% both overall and in all other aetiology groups. Cardiovascular disease was an underlying or contributing cause of death for 1129 people with MASLD cirrhosis (42.4%), 1456 people with alcohol‐related cirrhosis (26.3%), and 370 people with HCV‐related cirrhosis (15.0%). Extrahepatic cancer (672 deaths, 25.2%) and type 2 diabetes (633 deaths, 23.8%) were frequent underlying or contributing causes of death of people with MASLD cirrhosis; each proportion was lower in the other cirrhosis aetiology groups. Mental and behavioural diseases were frequent underlying or contributing causes of death of people with alcohol‐related (1645 deaths, 29.8%) or HCV‐related cirrhosis (678 deaths, 27.5%) (Box 5).
Cumulative all‐cause mortality
Cumulative two‐year mortality among people with advanced liver disease at the index admission was 46.0% (95% CI, 44.9–47.0%); for people without advanced liver disease, it was 25.4% (95% CI, 24.7–26.2%). Among people with advanced liver disease at the index admission, cumulative two‐year mortality was 47.8% (95% CI, 46.5–49.1%) for men and 42.2% (95% CI, 40.4–44.0%) for women; for those without advanced liver disease, it was 27.6% (95% CI, 26.6–28.6%) for men and 21.2% (95% CI, 20.0–22.4%) for women.
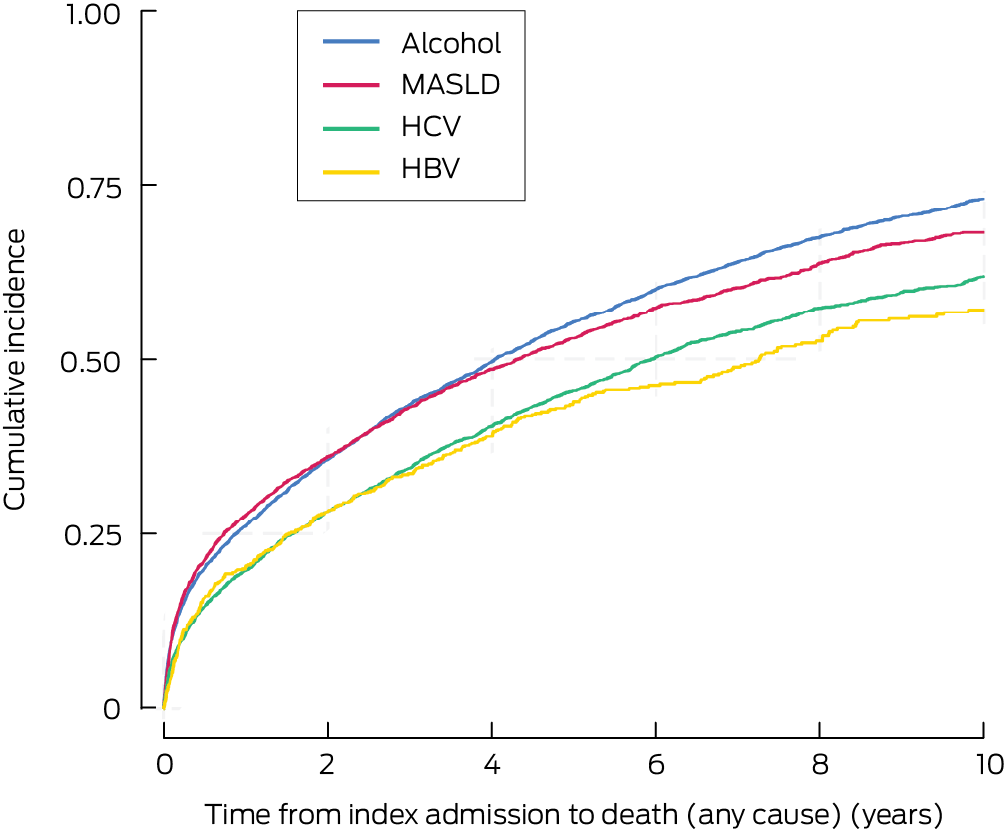
Overall cumulative ten‐year mortality was 68.3% (95% CI, 67.5–69.2%). It was highest for people with alcohol‐related cirrhosis (73.1%; 95% CI, 71.8–74.3%) and lowest for those with HBV‐related cirrhosis (57.1%; 95% CI, 52.9–61.3%) (Box 6). Compared with people with alcohol‐related cirrhosis, adjusted ten‐year mortality was lower among people with HBV‐related cirrhosis (adjusted HR, 0.83; 95% CI, 0.74–0.92) or MASLD cirrhosis (adjusted HR, 0.85; 95% CI, 0.81–0.90) (Box 7). Sensitivity analyses that excluded patients with index admissions prior to January 2012 yielded similar results (Supporting Information, table 3). Cumulative ten‐year mortality was 70.5% (95% CI, 69.5–71.4%) for men and 64.1% (95% CI, 62.6–65.5%) for women; adjusted HR, 0.85; 95% CI, 0.82–0.89).
Non‐alcoholic fatty liver disease or non‐alcoholic steatohepatitis were also coded for 1098 of 9550 people admitted with alcohol‐related cirrhosis; compared with the 8452 patients without these codes, they were less likely to die during ten‐year follow‐up (adjusted HR, 0.88; 95% CI, 0.81–0.96). Alcohol was recorded as a co‐factor for 3114 of 4780 patients with HCV‐related cirrhosis; compared with the other 1666 patients with HCV‐related cirrhosis, they were more likely to die during ten‐year follow‐up (adjusted HR, 1.27; 95% CI, 1.15–1.39). All‐cause mortality was similar for the 3982 people with HCV‐related cirrhosis but not chronic HBV infections and for the 798 people with both HCV‐related cirrhosis and HBV infections (adjusted HR, 0.91; 95% CI, 0.82–1.02).
Cause‐specific mortality
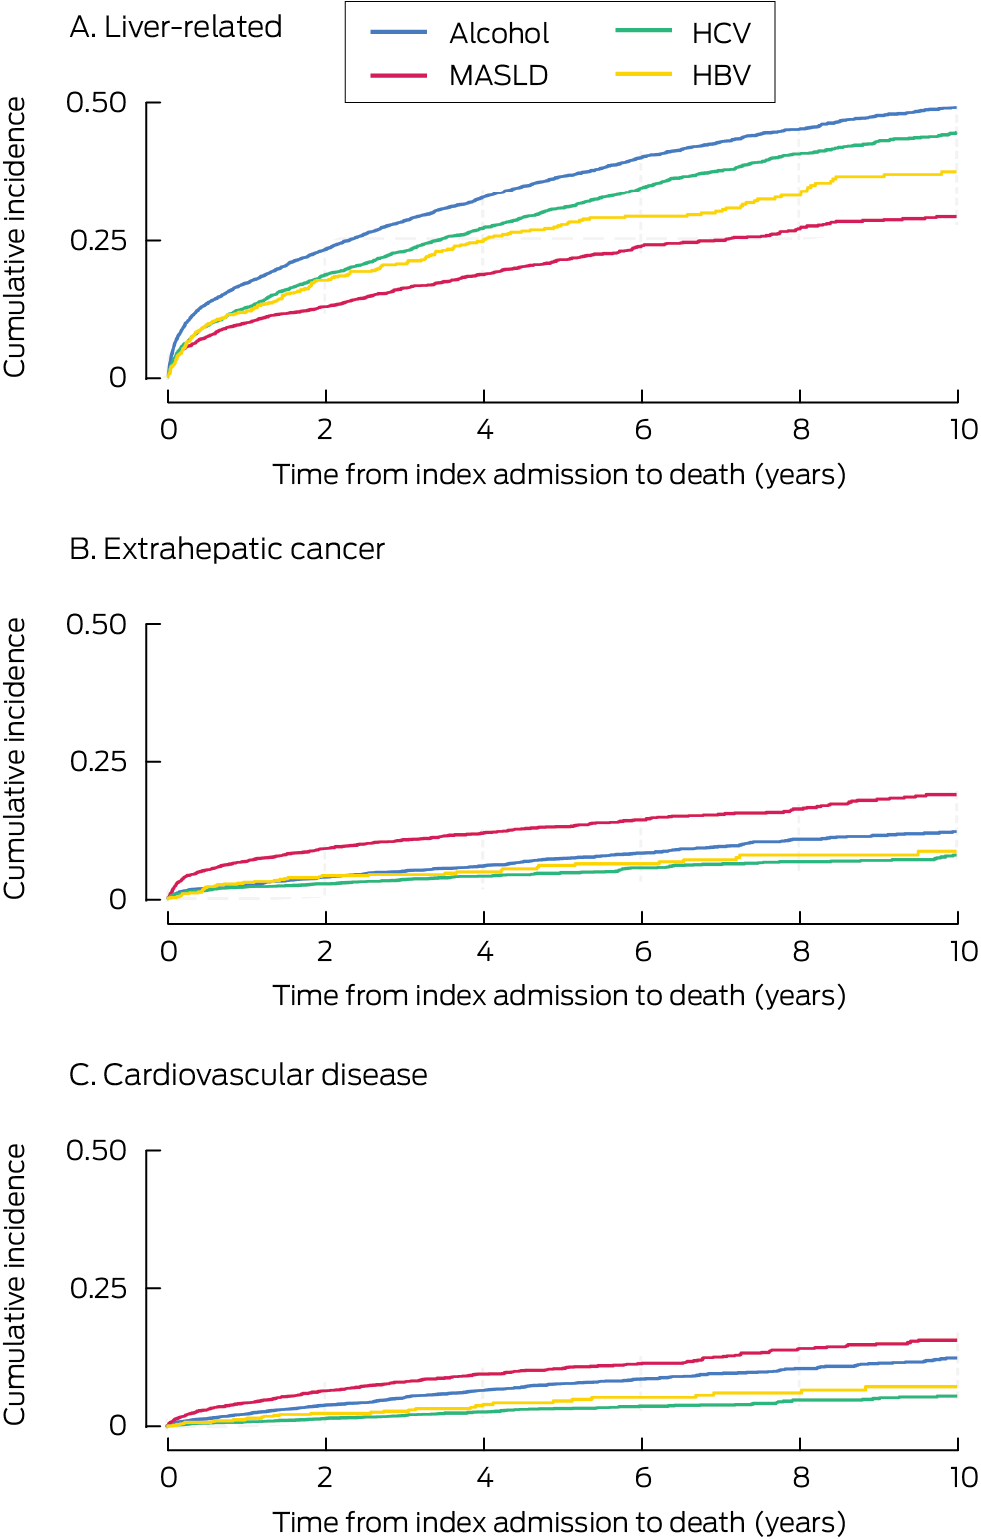
Ten‐year liver‐related mortality was highest among people with alcohol‐related cirrhosis (48.8%; 95% CI, 47.2–50.4%) or HCV‐related cirrhosis (44.3%; 95% CI, 42.3–46.3%); extrahepatic cancer mortality was highest among people with MASLD cirrhosis (18.8%; 95% CI, 16.8–20.9%); and cardiovascular disease mortality was highest among people with MASLD cirrhosis (15.6%; 95% CI, 13.8–17.7%) or alcohol‐related cirrhosis (12.4%; 95% CI, 11.1–13.8%) (Box 8).
After adjusting for socio‐demographic and clinical factors, cumulative liver disease‐related mortality (adjusted sHR, 0.88; 95% CI, 0.83–0.93) and cardiovascular disease‐related mortality (adjusted sHR, 0.71; 95% CI, 0.61–0.82) were each lower for women than men; extrahepatic cancer mortality was similar for both sexes (women v men: adjusted sHR, 0.99; 95% CI, 0.87–1.13). After adjusting for socio‐demographic and clinical factors, people with MASLD cirrhosis were less likely than those with alcohol‐related cirrhosis to die of liver disease (adjusted sHR, 0.55; 95% CI, 0.51–0.60) and more likely to die of extrahepatic cancer during ten‐year follow‐up (adjusted sHR, 1.21; 95% CI, 1.04–1.41). People with HCV‐related cirrhosis were less likely than those with alcohol‐related cirrhosis to die of cardiovascular disease during ten‐year follow‐up (adjusted sHR, 0.63; 95% CI, 0.52–0.78) (Box 9). Sensitivity analyses that excluded patients with index admissions prior to January 2012 yielded similar results (Supporting Information, table 3).
Discussion
In our large, retrospective, population‐based study of adults admitted to hospital in Queensland with cirrhosis, we found that mortality was high: 55% had died during a median follow‐up time of 6.9 years. The underlying cause of death differed markedly according to liver disease aetiology. More than 55% of people with alcohol‐ or viral hepatitis‐related cirrhosis who died during follow‐up died of liver‐related causes, but only 31% of those with MASLD cirrhosis. The causes of death were more varied among people with MASLD cirrhosis — extrahepatic cancer, 19%; cardiovascular disease, 14%; type 2 diabetes, 5% — than for other aetiologies, probably reflecting comorbidity and the higher mean age of this group.
Our findings are consistent with those of studies (albeit with only one year follow‐up after hospital discharge) in the United Kingdom16 and Denmark,17 which reported high mortality among people with cirrhosis (respectively 33% and 38%). Similar to our findings, a Canadian study found that 51% of people admitted to hospital with cirrhosis died of liver‐related causes within twelve years.18 Irrespective of cirrhosis aetiology, these findings indicate the prognostic implications of advanced liver disease and the need to develop strategies for reducing the risk of progression to decompensated disease.
Some of our specific findings highlight the unmet needs of people with liver disease, particularly those with cirrhosis. Mortality was highest among people with alcohol‐related liver disease (possibly related to continued alcohol consumption). Evidence for the safety and efficacy of alcohol dependence therapies in people with advanced liver disease is limited, and many anti‐craving medications are contraindicated or (in the case of acamprosate) require caution or dose reduction. There is some evidence for the benefit of medications such as topiramate, baclofen, and gabapentin, but they are not approved in Australia for this indication;19 only acamprosate and naltrexone are subsidised by the Pharmaceutical Benefits System. Other findings regarding causes of death of people with MASLD cirrhosis suggest that management should not only address liver‐related mortality risk, but also include cancer screening, cardiovascular disease risk reduction, and improved screening, diagnosis, and treatment of diabetes. Given the substantially higher cumulative two‐year mortality among people with advanced liver disease, improving awareness of liver disease in the community, especially in general practice, is important for increasing the screening for and diagnosis and management of liver disease so that it can be identified earlier and its progression prevented.
Current strategies for managing advanced liver disease and reducing portal hypertension with non‐selective beta‐blockers, such as carvedilol, could reduce the risk of decompensating events such as variceal bleeding, but the therapeutic window of benefit closes as liver disease advances.20,21 Approaches that bundle acute care for people with cirrhosis have been developed but not yet validated with respect to improved outcomes.22 People with decompensated cirrhosis have a variety of needs, including for dietary interventions to reverse sarcopenia, physical therapies to maintain muscle mass, and social strategies to prevent social isolation and carer stress,23 suggesting that a multidisciplinary approach is needed. Access to subspecialty care is important for improving survival with liver disease.24 In Australia, however, information about the number and distribution of hepatologists and gastroenterologists with expertise in managing liver disease is limited. Despite its prevalence and poor prognosis (poorer than for many cancers), liver disease is overlooked by policy makers who do not recognise it as a common chronic disease.25,26,27
As in other studies, we found that alcohol use was the most frequent identified cause of cirrhosis (42% of cases); the prevalence of advanced liver disease at the index admission (51%), ten‐year all‐cause mortality (73%), and ten‐year liver disease‐related mortality (49%) were all highest for this group. We have reported that hospital admissions with alcohol‐related cirrhosis rose substantially during 2007–2019.28 Public health measures to generally reduce alcohol use are important, but interventions for reducing problematic alcohol use may be needed to contain the rising morbidity and mortality associated with alcohol‐related liver disease.
Among people with cirrhosis related to MASLD, the second most frequent cause of cirrhosis in our study (23% of cases), the mean age was higher, the prevalence of other medical conditions high, the distribution by sex relatively equal, and liver disease‐related death less frequent than for cirrhosis of other aetiology (19.3% in people with compensated cirrhosis, 40.4% in those with decompensated disease). Overall mortality was similar to that for people with cirrhosis of other aetiologies because of the higher prevalence of extrahepatic cancer and cardiovascular deaths. Our findings our consistent with overseas reports that the risks of cardiovascular and non‐liver cancer death are higher for people with compensated cirrhosis caused by MASLD or with an unspecified aetiology (probably undiagnosed MASLD).18,29 This finding indicates the importance of holistic multidisciplinary care for people with MASLD, focused on preventing and treating cardiovascular disease and engaging people in relevant national cancer screening programs, alongside managing the liver disease.
Viral hepatitis was the third most frequent cirrhosis aetiology in our study, but curative therapy for HCV and antiviral therapy for HBV will reduce the prevalence of cirrhosis and liver‐related mortality caused by viral hepatitis.30 This shift is reflected in the changing indications for liver transplantation,31 and has been noted anecdotally by hospital‐based hepatologists in recent years. Most people in our study were admitted to hospital before direct‐acting antiviral medications for treating HCV infections were subsidised by the Pharmaceutical Benefits Scheme in 2016.32 Population‐based studies should consider the public health consequences of this change.
Limitations
Although we analysed population‐based data, they were retrospective in nature. Misclassification bias could be caused by variation in coding over time and between sites and coders. Data limitations prevented assessment of the severity of liver disease using Model for End‐Stage Liver Disease (MELD) or Child–Pugh scores, and we probably underestimated the number of people with compensated cirrhosis, given the diagnostic difficulties and that most hospitalised people with recognised cirrhosis have decompensated disease. These are important limitations, as severity of cirrhosis is a strong predictor of death.33 Coded data relied on information in physician death certificates, which can be inaccurate. People admitted to hospital during July 2007 – January 2012 could have been admitted to hospital with cirrhosis prior to July 2007, but sensitivity analyses excluding these patients yielded similar findings to the main analysis. As using a hierarchical algorithm to identify cirrhosis aetiology restricted classification to a single underlying aetiology for each patient, we could not examine the contribution of combinations of concomitant liver diseases. We could not adjust our multivariable analyses for factors such as smoking, alcohol use, and body mass index, which are independently associated with extrahepatic cancer and cardiovascular disease, as well as with liver disease progression. In particular, ICD‐10‐AM codes for obesity in people with cirrhosis admitted to Queensland hospitals underestimated its prevalence by 45.3%.34 Finally, the ICD‐10‐AM code R18 is not specific for ascites related to liver disease, but it has a positive predictive value of 97% and negative predictive value of 76% for identifying ascites in patients with cirrhosis.35
Conclusion
We found that ten‐year mortality among people who have been hospitalised with cirrhosis is high, and that variation in cause‐specific mortality by cirrhosis aetiology is substantial, probably influenced by coexisting medical conditions. These findings indicate that care for these patients could be improved by identifying chronic liver disease earlier, and by treating cardiovascular disease and extrahepatic malignancies in people with MASLD. Better epidemiological information, practitioner and community education, and health policy to facilitate effective care are needed to avoid preventable deaths.
Box 1 – Ascertainment of adult Queensland residents admitted to Queensland hospitals with cirrhosis, 1 July 2007 – 31 December 2022
Box 2 – Socio‐demographic and clinical characteristics of 22 525 adult Queensland residents admitted to Queensland hospitals with cirrhosis, 1 July 2007 – 31 December 2022
Cirrhosis aetiology
Characteristic
Alcohol
MASLD
HCV
HBV
Other
Total
Total number of people
9550
5108
4780
822
2265
22 525
Demographic characteristics
Sex
Men
6831 (71.5%)
2740 (53.6%)
3554 (74.4%)
577 (70.2%)
1193 (52.7%)
14 895 (66.1%)
Women
2719 (28.5%)
2368 (46.4%)
1226 (25.6%)
245 (29.8%)
1072 (47.3%)
7630 (33.9%)
Country of birth†
7
≤ 5
≤ 5
≤ 5
≤ 5
Australia
7404 (77.6%)
3854 (75.5%)
3716 (77.8%)
353 (43.0%)
1732 (76.5%)
17 059 (75.8%)
New Zealand, Oceania/Antarctica
392 (4.1%)
199 (3.9%)
269 (5.6%)
112 (13.7%)
108 (4.8%)
1080 (4.8%)
Europe and Americas
1525 (16.0%)
844 (16.5%)
555 (11.6%)
96 (11.7%)
337 (14.9%)
3357 (14.9%)
Asia, Africa, and Middle East
222 (2.3%)
208 (4.1%)
236 (4.9%)
259 (31.6%)
87 (3.8%)
1012 (4.5%)
Missing data
17
Indigenous status
Non‐Indigenous
8631 (90.6%)
4821 (94.5%)
4287 (89.8%)
671 (81.8%)
2174 (96.0%)
20 584 (91.5%)
Indigenous
899 (9.4%)
282 (5.5%)
489 (10.2%)
149 (18.2%)
90 (4.0%)
1909 (8.5%)
Missing data
20
≤ 5
≤ 5
≤ 5
≤ 5
32
Age (years), mean (SD)
60.0 (12.0)
69.1 (12.6)
54.7 (9.6)
58.4 (13.0)
63.7 (14.5)
61.2 (13.0)
Socio‐economic status (IRSD), quintile
1 (least disadvantaged)
1017 (13.4%)
577 (15.2%)
516 (12.2%)
125 (17.7%)
307 (15.5%)
2542 (13.9%)
2
1265 (16.7%)
646 (17.0%)
682 (16.1%)
132 (18.7%)
337 (17.0%)
3062 (16.7%)
3
1420 (18.7%)
727 (19.1%)
854 (20.2%)
114 (16.1%)
417 (21.1%)
3532 (19.3%)
4
1770 (23.4%)
841 (22.1%)
946 (22.3%)
124 (17.5%)
410 (20.7%)
4091 (22.4%)
5 (most disadvantaged)
2102 (27.8%)
1011 (26.6%)
1240 (29.3%)
212 (30.0%)
507 (25.6%)
5072 (27.7%)
Missing data
1976
1306
542
115
287
4226
Remoteness of residence
Major city
4265 (56.3%)
2286 (60.1%)
2562 (60.5%)
486 (68.7%)
1188 (60.1%)
10 787 (58.9%)
Inner regional
1688 (22.3%)
861 (22.6%)
937 (22.1%)
91 (12.9%)
457 (23.1%)
4034 (22.0%)
Outer regional
1337 (17.7%)
566 (14.9%)
673 (15.9%)
87 (12.3%)
277 (14.0%)
2940 (16.1%)
Remote/very remote
284 (3.7%)
89 (2.3%)
66 (1.6%)
43 (6.1%)
56 (2.8%)
538 (2.9%)
Missing data
1976
1306
542
115
287
4226
On admission
Advanced liver disease*
4870 (51.0%)
1519 (29.7%)
1639 (34.3%)
278 (33.8%)
776 (34.3%)
9082 (40.3%)
Charlson comorbidity index score
0
5561 (58.2%)
1694 (33.2%)
3324 (69.5%)
464 (56.4%)
1245 (55.0%)
12 288 (54.6%)
1
1622 (17.0%)
859 (16.8%)
636 (13.3%)
105 (12.8%)
350 (15.5%)
3572 (15.9%)
2
1100 (11.5%)
1099 (21.5%)
390 (8.2%)
114 (13.9%)
291 (12.8%)
2994 (13.3%)
3 or more
1267 (13.3%)
1456 (28.5%)
430 (9.0%)
139 (16.9%)
379 (16.7%)
3671 (16.3%)
During follow‐up
Cirrhosis decompensation
5892 (61.7%)
1994 (39.0%)
2499 (52.3%)
380 (46.2%)
1151 (50.8%)
11 916 (52.9%)
Type 2 diabetes
3187 (33.4%)
2999 (58.7%)
1231 (25.8%)
339 (41.2%)
937 (41.4%)
8693 (38.6%)
Liver transplantation
81 (0.8%)
32 (0.6%)
203 (4.2%)
31 (3.8%)
130 (5.7%)
477 (2.1%)
Deaths
5527 (57.9%)
2662 (52.1%)
2467 (51.6%)
399 (48.5%)
1332 (58.8%)
12 387 (55.0%)
HBV = hepatitis B virus; HCV = hepatitis C virus; IRSD = Index of Relative Socioeconomic Disadvantage; MASLD = metabolic dysfunction‐associated steatotic liver disease; SD = standard deviation. * Cirrhosis decompensation, portal hypertension, or hepatic failure.
Box 3 – Underlying causes of death of 12 387 adult Queensland residents admitted to Queensland hospitals with cirrhosis, 1 July 2007 – 31 December 2022, who had died by 31 December 2022, by cirrhosis aetiology
Cirrhosis aetiology
Cause of death
Alcohol
MASLD
HCV
HBV
Other
Total
Total number of deaths
5527
2662
2467
399
1332
12 387
Selected groups
Liver‐related*
3061 (55.4%)
825 (31.0%)
1489 (60.4%)
218 (54.6%)
641 (48.1%)
6234 (50.3%)
Extrahepatic cancer
516 (9.3%)
507 (19.0%)
208 (8.4%)
46 (11.5%)
161 (12.1%)
1438 (11.6%)
Cardiovascular disease
529 (9.6%)
384 (14.4%)
133 (5.4%)
32 (8.0%)
107 (8.0%)
1185 (9.6%)
Type 2 diabetes
76 (1.4%)
134 (5.0%)
19 (0.8%)
8 (2.0%)
27 (2.0%)
264 (2.1%)
Respiratory disease
279 (5.0%)
159 (6.0%)
70 (2.8%)
16 (4.0%)
56 (4.2%)
580 (4.7%)
Infections and parasitic diseases†
112 (2.0%)
64 (2.4%)
58 (2.4%)
16 (4.0%)
26 (2.0%)
276 (2.2%)
External causes of morbidity and mortality
168 (3.0%)
52 (2.0%)
127 (5.1%)
≤ 5
22 (1.7%)
373 (3.0%)
All other causes
786 (14.2%)
537 (20.2%)
363 (14.7%)
59 (14.8%)
292 (21.9%)
2037 (16.4%)
ICD‐10‐AM chapters ‡
1. Infections and parasitic diseases
114 (2.1%)
66 (2.5%)
475 (19.3%)
47 (11.8%)
27 (2.0%)
729 (5.9%)
2. Neoplasms
916 (16.6%)
798 (30.0%)
856 (34.7%)
156 (39.1%)
332 (24.9%)
3058 (24.7%)
3. Blood and immune system diseases
16 (0.3%)
12 (0.5%)
9 (0.4%)
≤ 5
9 (0.7%)
46 (0.4%)
4. Endocrine, nutritional and metabolic diseases
110 (2.0%)
180 (6.8%)
30 (1.2%)
9 (2.3%)
90 (6.8%)
419 (3.4%)
5. Mental and behavioural diseases
119 (2.2%)
45 (1.7%)
36 (1.5%)
7 (1.8%)
23 (1.7%)
230 (1.9%)
6. Diseases of the nervous system
52 (0.9%)
29 (1.1%)
12 (0.5%)
≤ 5
10 (0.8%)
103 (0.8%)
9. Diseases of the circulatory system
683 (12.4%)
522 (19.6%)
184 (7.5%)
40 (10.0%)
134 (10.1%)
1563 (12.6%)
10. Diseases of the respiratory system
279 (5.0%)
159 (6.0%)
70 (2.8%)
16 (4.0%)
56 (4.2%)
580 (4.7%)
11. Diseases of the digestive system
2816 (50.9%)
614 (23.1%)
593 (24.0%)
94 (23.6%)
546 (41.0%)
4663 (37.6%)
12. Diseases of the skin/subcutaneous tissues
32 (0.6%)
12 (0.5%)
10 (0.4%)
≤ 5
≤ 5
59 (0.5%)
13. Diseases of the musculoskeletal tissues
29 (0.5%)
21 (0.8%)
12 (0.5%)
≤ 5
17 (1.3%)
82 (0.7%)
14. Diseases of the genitourinary system
87 (1.6%)
76 (2.9%)
19 (0.8%)
13 (3.3%)
20 (1.5%)
215 (1.7%)
18. Symptoms, signs and abnormal clinical findings
57 (1.0%)
30 (1.1%)
22 (0.9%)
6 (1.5%)
14 (1.1%)
129 (1.0%)
19. Injury, poisoning, external causes
7 (0.1%)
≤ 5
≤ 5
≤ 5
≤ 5
16 (0.1%)
20. External causes of morbidity and mortality
168 (3.0%)
52 (2.0%)
127 (5.1%)
≤ 5
22 (1.7%)
373 (3.0%)
22. Codes for special purposes
≤ 5
7 (0.3%)
≤ 5
≤ 5
≤ 5
16 (0.1%)
HBV = hepatitis B virus; HCV = hepatitis C virus; ICD‐10‐AM = International Classification of Diseases, tenth revision, Australian modification; MASLD = metabolic dysfunction‐associated steatotic liver disease. * Cirrhosis, liver cancer, and chronic hepatitis. † Excludes chronic hepatitis. ‡ Total of fewer than five cases of causes of death: 7. Diseases of the eye and annexa, 8. Diseases of the ear and mastoid process, 15. Pregnancy, childbirth and puerperium, 16. Diseases in the perinatal period, 17. Congenital malformations, and 21. Factors influencing health status.
Box 4 – Underlying causes of death of 12 387 adult Queensland residents admitted to Queensland hospitals with cirrhosis, 1 July 2007 – 31 December 2022, who had died by 31 December 2022, by decompensation status during the follow‐up period, age group, and diabetes and cardiovascular status on admission, and by cirrhosis aetiology*
Box 5 – Contributing and underlying causes of death of 12 387 adult Queensland residents admitted to Queensland hospitals with cirrhosis, 1 July 2007 – 31 December 2022, who had died by 31 December 2022, by cirrhosis aetiology
Cirrhosis aetiology
Cause of death
Alcohol
MASLD
HCV
HBV
Other
Total
Total number of deaths
5527
2662
2467
399
1332
12 387
Selected groups †
Liver‐related death‡
4371 (79.1%)
1462 (54.9%)
2143 (86.9%)
320 (80.2%)*
1009 (75.8%)
9305 (75.1%)
Extrahepatic cancer
768 (13.9%)
672 (25.2%)
316 (12.8%)
71 (17.8%)
249 (18.7%)
2076 (16.8%)
Major adverse cardiovascular event
1456 (26.3%)
1129 (42.4%)
370 (15.0%)
95 (23.8%)
337 (25.3%)
3387 (27.3%)
Type 2 diabetes
614 (11.1%)
633 (23.8%)
184 (7.5%)
73 (18.3%)
199 (14.9%)
1703 (13.7%)
Infectious diseases§
642 (11.6%)
273 (10.3%)
155 (6.3%)
81 (20.3%)
153 (11.5%)
1304 (10.5%)
ICD‐10‐AM chapters ¶
1. Infections and parasitic diseases
644 (11.7%)
277 (10.4%)
1450 (58.8%)
173 (43.4%)
154 (11.6%)
2698 (21.8%)
2. Neoplasms
1230 (22.3%)
977 (36.7%)
1035 (42.0%)
190 (47.6%)
426 (32.0%)
3858 (31.1%)
3. Blood/immune system diseases
269 (4.9%)
144 (5.4%)
86 (3.5%)
19 (4.8%)
64 (4.8%)
582 (4.7%)
4. Endocrine, nutritional and metabolic diseases
984 (17.8%)
780 (29.3%)
308 (12.5%)
90 (22.6%)
410 (30.8%)
2572 (20.8%)
5. Mental and behavioural diseases
1645 (29.8%)
174 (6.5%)
678 (27.5%)
62 (15.5%)
154 (11.6%)
2713 (21.9%)
6. Diseases of the nervous system
284 (5.1%)
174 (6.5%)
101 (4.1%)
16 (4.0%)
59 (4.4%)
634 (5.1%)
7. Diseases of the eye and annexa
≤ 5
≤ 5
≤ 5
≤ 5
≤ 5
13 (0.1%)
8. Diseases of the ear and mastoid process
≤ 5
≤ 5
≤ 5
≤ 5
≤ 5
7 (0.1%)
9. Diseases of the circulatory system
2194 (39.7%)
1428 (53.6%)
659 (26.7%)
128 (32.1%)
506 (38.0%)
4915 (39.7%)
10. Diseases of the respiratory system
1330 (24.1%)
629 (23.6%)
405 (16.4%)
64 (16.0%)
257 (19.3%)
2685 (21.7%)
11. Diseases of the digestive system
4335 (78.4%)
1408 (52.9%)
1839 (74.5%)
259 (64.9%)
985 (73.9%)
8826 (71.3%)
12. Diseases of the skin and subcutaneous tissues
110 (2.0%)
60 (2.3%)
35 (1.4%)
7 (1.8%)
18 (1.4%)
230 (1.9%)
13. Diseases of the musculoskeletal tissues
158 (2.9%)
107 (4.0%)
51 (2.1%)
9 (2.3%)
73 (5.5%)
398 (3.2%)
14. Diseases of the genitourinary system
853 (15.4%)
712 (26.7%)
237 (9.6%)
76 (19.0%)
262 (19.7%)
2140 (17.3%)
17. Congenital malformations
11 (0.2%)
19 (0.7%)
≤ 5
≤ 5
7 (0.5%)
45 (0.4%)
18. Symptoms/signs/abnormal clinical findings
880 (15.9%)
434 (16.3%)
307 (12.4%)
47 (11.8%)
171 (12.8%)
1,839 (14.8%)
19. Injury, poisoning, external causes
335 (6.1%)
131 (4.9%)
185 (7.5%)
13 (3.3%)
68 (5.1%)
732 (5.9%)
20. External causes of morbidity and mortality
454 (8.2%)
199 (7.5%)
241 (9.8%)
17 (4.3%)
105 (7.9%)
1016 (8.2%)
21. Factors influencing health status
37 (0.7%)
18 (0.7%)
22 (0.9%)
≤ 5
8 (0.6%)
87 (0.7%)
22. Codes for special purposes
18 (0.3%)
17 (0.6%)
7 (0.3%)
≤ 5
≤ 5
48 (0.4%)
HBV = hepatitis B virus; HCV = hepatitis C virus; ICD‐10‐AM = International Classification of Diseases, tenth revision, Australian modification; MASLD = metabolic dysfunction‐associated steatotic liver disease. * “Liver‐related deaths” category includes deaths from chronic hepatitis (included in chapter 1: infections and parasitic diseases), liver cancer (included in chapter 2: neoplasms), as well as liver‐related deaths included in chapter 11 (diseases of the digestive system). † More than one cause is possible. ‡ Including cirrhosis, liver cancer, and chronic hepatitis. § Excluding chronic hepatitis. ¶ Total of fewer than five cases of causes of death: 15. Pregnancy, childbirth and puerperium, 16. Diseases in the perinatal period.
Box 6 – Cumulative incidence of death (any cause) among 22 525 adult Queensland residents admitted to Queensland hospitals with cirrhosis, 1 July 2007 – 31 December 2022, by cirrhosis aetiology: Kaplan–Meier curves
Box 7 – Ten‐year all‐cause mortality among 22 525 adult Queensland residents admitted to Queensland hospitals with cirrhosis, 1 July 2007 – 31 December 2022, by cirrhosis aetiology
Cirrhosis aetiology
10‐year all‐cause mortality (95% CI)
Adjusted hazard ratio (95% CI)*
Alcohol‐related
73.1% (71.8–74.3%)
1
Metabolic dysfunction‐associated steatotic liver disease
68.2% (66.4–70.1%)
0.85 (0.81–0.90)
Chronic HCV infection
61.9% (60.2–63.7%)
1.03 (0.98–1.09)
Chronic HBV infection
57.1% (52.9–61.3%)
0.83 (0.74–0.92)
CI = confidence interval; HBV = hepatitis B virus; HCV = hepatitis C virus. * Cox regression model adjusted for cirrhosis aetiology, sex, Indigenous status, decompensation event and type 2 diabetes during the follow‐up period, age, socio‐economic status and remoteness of residence, Charlson comorbidity score, and severity of liver disease at index admission.
Box 8 – Cumulative incidence of cause‐specific death among 22 525 adult Queensland residents admitted to Queensland hospitals with cirrhosis, 1 July 2007 – 31 December 2022, by cirrhosis aetiology: Kaplan–Meier curves*
Box 9 – Ten‐year cause‐specific mortality among 22 525 adult Queensland residents admitted to Queensland hospitals with cirrhosis, 1 July 2007 – 31 December 2022, by cirrhosis aetiology
Liver disease
Extrahepatic cancer
Cardiovascular disease
Cirrhosis aetiology
Mortality (95% CI)
Adjusted sHR (95% CI)*
Mortality (95% CI)
Adjusted sHR (95% CI)*
Mortality (95% CI)
Adjusted sHR (95% CI)*
Alcohol‐related
48.8% (47.2–50.4%)
1
12.1% (10.9–13.4%)
1
12.4% (11.1–13.8%)
1
Metabolic dysfunction‐associated steatotic liver disease
29.0% (26.9–31.3%)
0.55 (0.51–0.60)
18.8% (16.8–20.9%)
1.21 (1.04–1.41)
15.6% (13.8–17.7%)
1.07 (0.91–1.25)
Chronic HCV infection
44.3% (42.3–46.3%)
1.06 (0.99–1.13)
7.9% (6.7–9.3%)
0.87 (0.73–1.04)
5.5% (4.5–6.8%)
0.63 (0.52–0.78)
Chronic HBV infection
37.3% (32.9–42.0%)
0.92 (0.80–1.06)
8.5% (6.1–11.9%)
0.90 (0.65–1.24)
7.2% (4.9–10.5%)
0.72 (0.50–1.03)
CI = confidence interval; HBV = hepatitis B virus; HCV = hepatitis C virus; sHR = subdistribution hazard ratio. * Cox regression model adjusted for cirrhosis aetiology, sex, Indigenous status, decompensation event and type 2 diabetes during the follow‐up period, age, socio‐economic status and remoteness of residence, Charlson comorbidity score, and severity of liver disease at index admission.