
Our work quantifies the life cycle GHG emissions and emission reduction potential of roughly 2,000 announced hydrogen production facilities from the current year up to 2043, as provided by the IEA20, and associated envisioned hydrogen and derived final product use, from a life cycle perspective.
IEA database
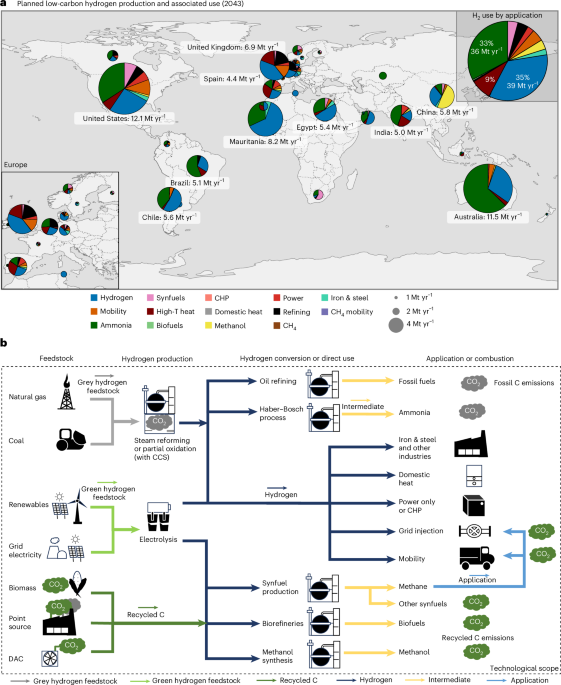
The IEA database20 provides data on, among other things, the facility planned, the country, the year of installation, the hydrogen production capacity, the application of the hydrogen and the technology used to produce the hydrogen—which can be, for example, electrolytic hydrogen using different renewable power sources, such as solar PV, or nuclear or fossil-based hydrogen via steam methane reforming or coal gasification with CCS.
The IEA database20 is used to generate LCIs for each hydrogen production facility, considering the hydrogen production technology, the derived product and the application of the hydrogen or the derived final products specified. As such, for most hydrogen production facilities, multiple hydrogen applications are given. To account for this, we evenly distribute the amount of hydrogen over the different end uses for each specific facility. We also exclude hydrogen production facilities with very low capacities (less than 10 tH2 yr−1) and facilities installed before 2019 but still not operational. Additionally, we exclude decommissioned facilities from the database to consider only facilities that are or might be generating hydrogen in the future. Nonetheless, we include 99.9% of hydrogen production capacity represented in the IEA database.
Evaluation framework
Environmental LCA24 is used to quantify GHG emissions of current and planned hydrogen production facilities up to 2043, including all relevant steps of the hydrogen value chains. The LCA database ecoinvent 3.1024 with the “allocation, cut-off by classification” system model is used as the basic background LCI to calculate LCA results. The impact assessment method Environmental Footprint v.3.1 EN15804 global warming potential35 is used to calculate life cycle GHG emissions (representing impacts on climate change), with an additional characterization factor of 11 kg CO2e per kg H2 to account for the indirect warming impact of emissions of hydrogen to the air (leakage)36.
We aim to compare the hydrogen-based applications with alternatives providing the same service or derived product against two different reference cases: a business-as-usual scenario and a low-carbon scenario considering a decarbonized global economy in which most production processes and services are directly electrified, biomass based or, if relying on fossil resources, equipped with CCS. The system boundaries of our analysis include all supply chain activities from producing the hydrogen, the facility, up to the application of the hydrogen; these hydrogen uses and applications include producing oil products (refining), ammonia production, methanol production, steel production, high-temperature heat, using hydrogen for transportation/mobility, electrical power generation, CHP generation, residential heat supply, biofuels and synfuels. Refining of fossil fuels has been excluded as an application in the decarbonization analysis of Fig. 5 since sourcing the current amount of hydrogen for refining would lead to tremendous GHG emissions, and fossil fuels need to be phased out in a low-carbon future global economy. A suitable functional unit is defined if the technology differs from the reference process. A complete overview is given in Supplementary Note 3.
We focus on hydrogen use in second-generation biofuels, namely hydrotreated vegetable oil produced from used cooking oil, which is considered waste otherwise. Hydrotreated vegetable oil production requires hydrogen for upgrading, which makes it relevant to our analysis of hydrogen demand in biofuels.
The open-source Python package premise (v.2.2.7)22 updates the LCA background data and integrates additional inventories associated with hydrogen production, use and derived products. Since the focus is on current and future hydrogen production facilities up to 2043, we produce different prospective background LCA databases using premise22, considering a 5-yr interval. For this purpose, we use a scenario from the REMIND v.3.3 model25,26. This scenario leads to less than 2 °C of mean surface temperature increase relative to pre-industrial levels, following the shared socio-economic pathway SSP237, with a remaining carbon budget of 1,150 GtC between 2018 and 2100, called ‘SSP2-PkBudg1150’. This scenario aligns with a potential hydrogen economy, which will probably only be implemented if a transformation to a low-carbon global economy materializes5. We link the hydrogen production facility with its start of operation date according to the IEA database to the LCIs corresponding to the ‘nearest’ 5-yr interval. To assess the results’ sensitivity to the background scenario, the workflow is run with a scenario with a similar climate mitigation target, but from another model, IMAGE v.3.4 SSP2-RCP2627. This additional analysis reveals that the differences between the REMIND and IMAGE scenarios remain relatively marginal since the focus is on climate change impacts. In general, the emission reduction potential based on the IMAGE scenario is slightly lower, as it relies on CO2 removal (mainly via bioenergy with CCS) to a larger extent than does the REMIND model. This CO2 removal is not associated with specific hydrogen applications though. Including other impact categories could have amplified the differences between scenarios, but this is beyond the scope of our current analysis. If we had considered additional environmental impact categories beyond climate change, the differences between scenarios would probably be much more pronounced22. This offers a potential avenue for further research to ensure an optimal integration of hydrogen applications across a broader spectrum of sustainability indicators.
Additional LCIs
We generate additional LCIs for hydrogen production considering polymer electrolyte membrane, alkaline and solid oxide electrolysers. Solid oxide and alkaline electrolysers produce hydrogen at lower pressure levels (1 and 20 bar, respectively) than do polymer electrolyte membrane electrolysers (30 bar). We account for additional compression electricity required to compress hydrogen to 30 bar using the equations provided in the work of ref. 38.
Electrolytic hydrogen is produced at multiple sites using solar PV or wind power. While the IEA reports electrolyser capacity factors of 0.3 (solar PV), 0.4 (onshore wind) and 0.55 (offshore wind), we account for regional variability by generating LCIs across a range of capacity factors—incremented by 0.025 for solar PV and 0.05 for onshore wind—since recent work5 revealed substantial differences in GHG emission factors of electrolytic hydrogen production when applying location-specific capacity factors of renewables39,40,41,42. Hence, when available, the facility’s location provided by the database is matched with location-specific capacity factors. If this information is unavailable, country-specific average capacity factors are used for solar PV and onshore wind39,41. Average country-specific capacity factors from the Global Solar Atlas41 (for solar PV) and Global Wind Atlas39 (for onshore and offshore wind) are coupled with the generated (and most suitable) LCIs for electrolytic hydrogen production using these power sources. For onshore wind, the shapefile of the World Bank43 is used for country boundaries to generate average country-specific onshore wind capacity factors. Cartopy44 has been used to generate the global geospatial maps, which are made with Natural Earth.
One crucial addition to these LCIs is the consideration of the required oversizing of renewable generation capacities and the potential integration of batteries for stand-alone electrolysers powered by dedicated renewables without a grid connection. For example, if the electrolyser has a load factor of 0.3 in the case of solar PV-based hydrogen production facilities, either solar PV systems need to be oversized (and excess power curtailed) or batteries are required to achieve the load factor of the electrolyser, since a capacity factor of 0.3 for solar PV can be reached only with difficulty. To account for oversizing (and curtailment) and potential battery deployment to increase the capacity factor (and flexibility), an optimization problem is formulated to determine the optimal renewable energy capacity, curtailment and installed battery capacity. As in ref. 5, we use nonlinear curve fittings after applying the model to 120 case studies worldwide (960 optimizations) to determine the amount of curtailment needed and battery deployment using a cost optimization of hydrogen production systems. The cost parameters of the optimization problem are adjusted according to the technology and the year of manufacture and are given in Supplementary Note 5. Finally, the corresponding LCIs are adapted to the optimization problem solution. For offshore wind-based electrolytic hydrogen production, we assume the same capacity factor of the electrolyser (0.55) as for its wind power generation. The complete procedure, including the optimization problem, is explained in Supplementary Note 1.
In addition, we generate LCIs for nuclear- (~1% of facilities), hydropower- (~2% of facilities) and grid-power- (~9% of facilities) based hydrogen production by coupling them with a country-specific electricity source. Generating these additional LCIs enables a detailed linkage of the specific hydrogen production technology within a hydrogen application of a facility. Previous literature45,46,47,48 has been used to generate the LCIs for hydrogen use in oil refining, iron and steel, and biofuel production. For hydrogen consumption by oil refining processing, we have neglected about half of the demand typically produced on site as a by-product of refining operations46. These LCIs can be found in the Zenodo repository49. Supplementary Note 3 includes the additional LCI data used to model hydrogen applications.
We generate a new LCI for each hydrogen production facility in the IEA database on the basis of the specified hydrogen applications, production methods and technologies (Supplementary Note 4). If multiple applications are specified, a separate LCI is created for each. Each facility–application pair is then linked and regionalized to the most appropriate hydrogen production source and inventory exchanges using the wurst Python package23 (Supplementary Note 4). If no direct match is found, due to typographical errors or missing data, we use the rapidfuzz package to identify the closest match. We assign location- or country-specific hydrogen production sources for renewables (solar PV and onshore wind), nuclear, hydropower and grid electricity wherever possible.
Finally, life cycle GHG emissions are calculated for each hydrogen production facility, including the associated applications of hydrogen and derived products. These emissions are compared with two reference cases to assess reduction potentials: (1) a business-as-usual scenario using current fossil-based technologies and (2) a low-carbon scenario relying on alternatives such as biomass, low-carbon electricity or CCS. For instance, hydrogen-powered trucks are compared with diesel trucks (Euro VI) in the business-as-usual case, and with battery electric trucks in the low-carbon scenario, sourcing low-carbon power. Reference technologies for all cases are given in Supplementary Note 3. For transparency purposes, we show the contribution of each sectoral transformation applied by premise (v.2.2.7)22 for all hydrogen applications. In addition, Supplementary Note 7 (and the Zenodo repository49) includes interactive Sankey diagrams that illustrate embodied GHG emissions along the hydrogen supply chain for the current and future (2040, on the basis of the REMIND scenario) contexts. A comprehensive table of alternative counterfactuals is provided in Supplementary Note 8.
Limitations
Our analysis provides decision support for specific hydrogen products and applications in different geographical regions. However, concerns remain regarding the overall feasibility of such a hydrogen economy. For example, low-carbon hydrogen production exhibits environmental trade-offs. It is energy intensive5,50,51, thus requiring a tremendous expansion of renewable energy sources and large capacities of geological CO2 storage volumes when relying on natural gas reforming with CO2 capture. Future work should extend this analysis to costs, social aspects and broader sustainability indicators, such as land, water and material utilization.
The method exhibits other limitations. First, we considered one alternative for each application of hydrogen (or derived products), which may overlook differences in end-use efficiencies (for example, fuel cells versus combustion engines versus industrial processes), potentially affecting the estimated emissions reduction. A comprehensive discussion, in the form of a table, on alternative counterfactuals for the low-carbon scenario is provided in Supplementary Note 8. Some hydrogen production facilities might have been excluded from the IEA database (such as those provided by the Bloomberg database, https://about.bnef.com/), and limited information for some others may lead to slight deviations in calculated emissions, especially when no matching LCI is found—potentially misrepresenting the actual capacity factor (see “Life cycle inventories” in Supplementary Note 3). Second, the IEA database defines the capacity factor of electrolytic hydrogen production, which we used in our energy system optimization to quantify the oversizing of renewables, curtailment and potential battery deployment, statically. Designing hydrogen production configurations optimally—including the capacity factor of the electrolyser—could further reduce costs and environmental burdens50. Finally, the analysis only partially addresses hydrogen storage and transport challenges, especially for steel-making, heat and power generation. These involve energy losses and infrastructure requirements, further affecting the feasibility of hydrogen-based applications and their environmental impact, and increasing the burden shifts between regions.