
Transition from perturbative to strong-field driven HHG in monolayer WS2
Figure 1a schematically illustrates the electronic processes in monolayer WS2 initiated under intense laser driving. In the perturbative regime, nonlinear optical processes primarily arise from excitonic multiphoton transitions at the band gaps located at the K and K′ valleys. Under intense laser fields, excitons become substantially delocalized through hybridization with higher excitonic bound states and continuum states36. Eventually, ionized electrons and holes are driven far beyond the K and K′ valleys over wide regions of momentum space, which opens additional pathways for higher-order nonlinear optical processes via intraband and interband transitions.
Fig. 1: Non-perturbative response of lightwave-driven electron-hole pairs in monolayer WS₂.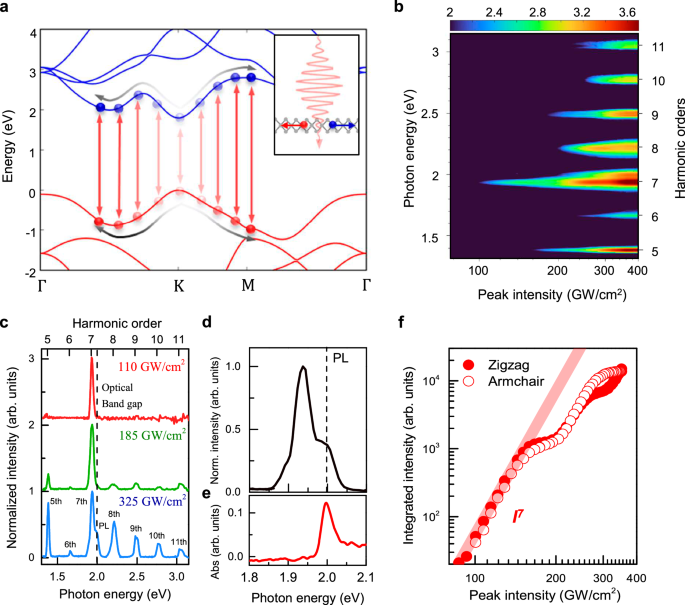
a Illustration of the electronic processes under strong laser excitation: Intense laser driving excites carriers throughout the BZ, and drives them in the respective bands. Interband recombination and intraband currents (red and gray arrows, respectively) emit HHG from various points in the BZ, including beyond K/K’ valleys. In inset is an illustration of an electrons and holes driven by laser fields. b Experimentally measured HHG spectra as a function of laser intensity from 80 to 350 GW/cm². Note that harmonic yield in (b) is plotted in a logarithmic scale. The spectra display markedly different profiles in the perturbative and non-perturbative regimes, showing onset of HHG plateau at higher driving, and the resonant 7th harmonic appearing in much lower intensities. c Line-cuts of HHG spectra from (b). d Photoluminescence spectra showing clear excitonic signatures with 1 s exciton resonance at 2 eV. e Reflection contrast spectrum indicating absorption near 2 eV, associated with the 1 s exciton resonance. f Measured integrated 7th harmonic yield as a function of laser intensity (obtained from (b)), showing a kink feature arising for both zigzag and armchair orientations. Note that (f) is plotted in a logarithmic scale.
We fabricate large-area, high-quality, WS2 monolayers using a gold-assisted exfoliation method37. To further reduce external defects, the exfoliated monolayer WS2 is encapsulated with hexagonal boron nitride on sapphire substrates via a dry transfer process38. Our home-built femtosecond laser system provides linearly-polarized, mid-infrared pulses with ~ 120 fs duration at 100 kHz repetition rate. We intentionally set the photon energy at ~ 0.28 eV (4500 nm) to match the 7-photon resonant exciton transition at the band edge. The laser power and polarization are precisely controlled and analyzed using polarization optics. HHG spectra are recorded with an electron-multiplying charge-coupled device to achieve a high signal-to-noise ratio. Owing to the combined advantages of high sample quality and high repetition rate, we can sensitively observe the quantum interference features from the perturbative to the non-perturbative regimes, as will be shown below. Additional details on sample preparation, laser setup, and a comparison of HHG spectra with and without hBN encapsulation are provided in the Supplementary Information (SI).
We now investigate HHG in monolayer WS2 as a function the driving intensity. HHG signals are collected and integrated for both parallel and cross-polarization components with respect to the driving laser fields. HHG spectra exhibit markedly different profiles depending on the laser intensity (see Fig. 1b, c). At ~ 110 GW/cm2 (red solid line in Fig. 1c), strong 7th harmonic signals are observed at 1.93 eV, while all other harmonic orders—including lower harmonic orders—are nearly absent. This selective enhancement arises from excitonic resonances at the K and K’ valleys. The reflection contrast spectrum (Fig. 1e) and HHG spectrum (Fig. 1d) show absorption and photoluminescence peaks at 2 eV, respectively, originating from 1 s exciton resonances at the optical gap. The 7th harmonic signal is located near 1 s exciton resonances with a small detuning of 70 meV. Up to ~185 GW/cm2 laser driving, the yield of 7th harmonic in Fig. 1f scale as ∝ I 7 with respect to laser peak intensity (I). A similar intensity dependence is observed for photoluminescence under mid-infrared laser excitation (see SI), indicating that all optical processes observed in this regime are primarily mediated by the 7-photon transitions to the resonant excitonic state. Such excitonic enhancement has been experimentally reported for second harmonic generation in TMD monolayers and heterostructures39,40. Recent theoretical studies predict that excitonic resonances can also strongly enhance high-order harmonic generation26,36,41,42, in agreement with our experimental observations. At higher driving intensity ( >185 GW/cm2), an HHG plateau spanning 5–11th harmonics emerges (Fig. 1b, c). Under these conditions, the HHG yield becomes non-perturbative, including for the 7th harmonic—the main observable analyzed in this study. Notably, Fig. 1f reveals a pronounced kink at ~200 GW/cm2, which is not expected from the perturbative response, and which we will analyze with theory later on.
The crystal orientation dependence of the 7th harmonic yield also indicates the transition from the perturbative to the non-perturbative regime. Figure 2b–f present the integrated yield as a function of the angle between the laser field and the WS2 zigzag direction (see the illustration in Fig. 2a). The crystal axis of WS2 is determined from polarization analysis on even order harmonics (see SI). Polarization analysis confirms that the 7th harmonic is absent for the polarization component perpendicular to the driving laser field, as expected from HHG dynamical mirror-symmetry selection rules20,43 (see SI). At a laser intensity of ~ 125 GW/cm², dominated by the perturbative response from excitonic resonances, no apparent dependence on crystal orientation is observed (i.e., an isotropic response). However, in the non-perturbative regime, harmonic signals exhibit strong 60° periodic modulation, which becomes increasingly pronounced as the laser intensity rises from ~ 235 to 380 GW/cm², accompanied by significant changes in modulation depth and phase (with 60o periodicity, as expected from crystal symmetry44) – Initially, polar plots show stronger harmonic yields along the armchair direction, but as the laser intensity increases the polar plot rotates by 30°, revealing stronger yields along the zigzag direction. Figure 2f is consistent with previous works20,21 in extreme laser intensities (>1 TW/cm2). The systematic modification of polar plots is indicative of a change in laser excitation regime, and potentially also the physical mechanisms dominating HHG, as will be discussed below.
Fig. 2: Crystal orientation dependence of the 7th harmonic generation yield.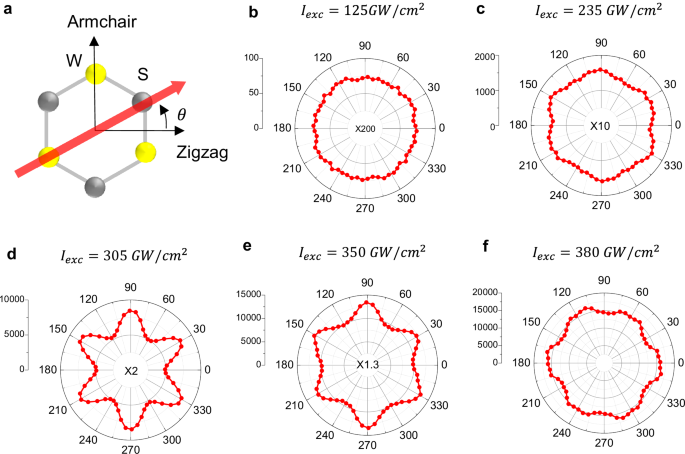
a Schematic of the monolayer WS₂ crystal structure and laser polarization axis (red arrow). The x(y)-axis corresponds to the zigzag (armchair) directions, respectively. The angle θ represents the counterclockwise rotation of the excitation laser polarization relative to the zigzag axis. b–f Crystal orientation dependence of seventh harmonics at increasing laser peak intensities: b 125 GW/cm², c 235 GW/cm², d 305 GW/cm², e 350 GW/cm², and f 380 GW/cm². For low driving power the harmonic response is isotropic and perturbative. At higher intensity in the transition to non-perturbative HHG, a distinct six-fold pattern emerges with emission along the armchair direction. At yet higher intensity the six-fold pattern is slightly less pronounced and rotated by 30°, exhibiting stronger harmonic intensity along the zigzag direction. The harmonic signals in (b), (c), (d), and (e) are magnified by factors of 200, 10, 2, and 1.3, respectively, to clearly visualize the pattern evolution at lower laser intensities.
Laser intensity-dependent quantum interference in the 7th harmonic spectra
Figure 3c presents a 2D color map of high-spectral-resolution 7th harmonic spectra from monolayer WS2 driven in the zig-zag direction as a function of laser intensity (nearly identical spectra are observed along the armchair direction, see SI). There are three key surprising results here, which form the main findings of this letter: (i) At ~ 150 GW/cm² where non-perturbative responses emerge from the laser-field-driven carriers, a very significant peak broadening arises. (ii) At slightly higher powers ( ~200 GW/cm2) multiple distinct peaks emerge from the sharp peak that is characteristic of lower intensity driving. At yet higher intensities, ~250 GW/cm², these split peaks converge, resulting in a broader recombined spectral profile. (iii) This evolution is accompanied by a notable kink in the integrated yield of the 7th harmonic (see Fig. 1f and Fig. 3a) over the same laser intensity range, whereby the yield does not increase with increasing driving intensity.
Fig. 3: Quantum interference in harmonic generation.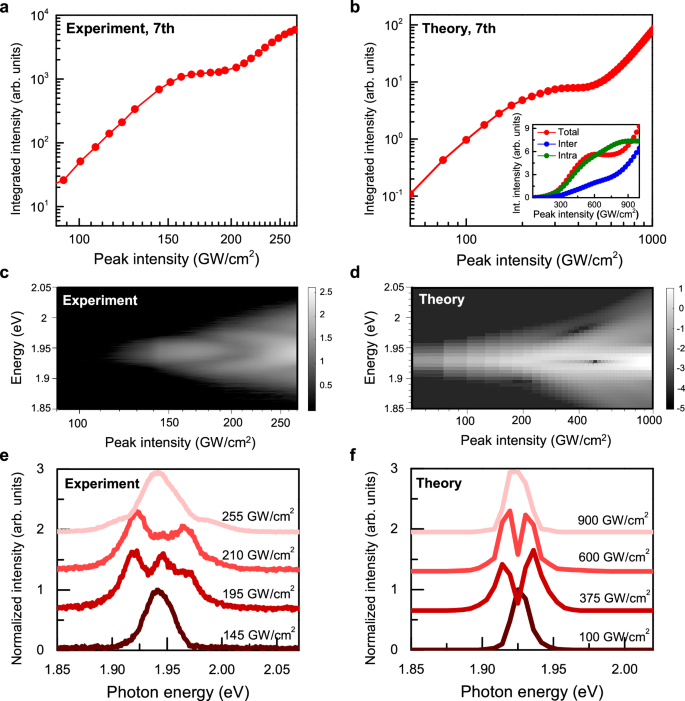
a The 7th harmonic yield vs. peak intensity in the zigzag direction (same as Fig. 1(f)). b Theoretical calculation of the 7th harmonic yield vs. peak intensity under laser excitation along the zigzag direction. We use a pulse duration of ~200 fs to resolve the peak splitting in (f). We confirm that nearly the same behavior is observed for a pulse duration of ~120 fs, corresponding to the actual experimental value (inset). The total current (red line) can be decomposed into intraband (green line) and interband (blue line) components, demonstrating that the kink arises from quantum interference between interband and intraband transitions. c Experimental and d theoretical 2D color map of the 7th harmonic spectra as a function of peak intensity under excitation along the zigzag direction, respectively. The color is plotted on a logarithmic scale. e Normalized 7th harmonic spectra at specific laser peak intensity corresponding to 145, 195, 210, and 255 GW/cm², which are linecuts of (c). At low laser field strength, a single peak is observed, but as the field strength increases, this single peak begins to broaden and split into multiple peaks, indicating the emergence of an interference between different electron pathways or transitions. As the field strength further increases to 255 GW/cm² and beyond, the formation of shoulder peaks becomes more pronounced potentially due to more complex quantum pathways or transitions. f Theoretical calculation of normalized 7th harmonic spectra at the specific laser peak intensity corresponding to 100, 375, 600 and 900 GW/cm², which is the linecut of (d). The calculated spectra exhibit interference patterns that closely resemble the experimental observations, particularly in the peak broadening and the emergence of multiple peaks at higher field strengths. All calculations were performed using the Tight Binding model, which was employed for solving the Semiconductor Bloch Equations.
In the perturbative regime, harmonic spectral profiles are primarily dictated by the driving pulse shape, typically exhibiting Gaussian-like profiles43. Beyond the perturbative regime, however, the spectral profile can also be affected by interference between multiple quantum pathways of charge carriers that emerge on sub-laser-cycle timescales. Specifically, interference between distinct quantum pathways can produce spectral fringes, including peak splitting, that reflect the complex dynamics of charge carriers (as has been observed due to other mechanisms in bulk systems10,45,46,47). Thus, we hypothesize that these phenomena all arise from multiple quantum path interferences. The main question is then which paths dominate the response of WS2 in this regime?
To address this question, we perform exhaustive theoretical calculations based on several levels of theory. First, ab-initio time-dependent density functional theory (TDDFT) simulations are performed and compared with the experiment. Unfortunately, due to the very long-wavelength driving TDDFT fails to reproduce the dominant experimental features. This arises primarily because TDDFT does not include sufficient dephasing channels, which are highly relevant and can significantly alter the HHG spectra in our conditions48 (because a single driving field period is ~ 15 fs, meaning dephasing occurs already within a single laser cycle, with recent dephasing times expected to be ~ fs on average49). Nonetheless, the TDDFT simulations allow us to conclude that in our conditions contributions from electronic correlations and higher- or lower-order conduction and valence bands are expected to be minor in the overall response (see SI). Consequently, we develop a simple two-band model based on a tight-binding (TB) Hamiltonian (with an approach similar to that in refs. 50,51 see SI), which we employ in semiconductor Bloch equations (SBE) in the length gauge in a density matrix formalism52,53 (given in a.u):
$$\begin{array}{c}\frac{\partial }{\partial {{\rm{t}}}}{\rho }_{{vv}}({{\bf{k}}},t)={{\rm{i}}}{{\bf{E}}}(t)\cdot \left[{{{\bf{d}}}}_{{{\bf{cv}}}}\left({{\bf{k}}}\right)\,{\rho }_{{cv}}^{*}\left({{\bf{k}}},t\right)-{{{\bf{d}}}}_{{{\bf{cv}}}}^{*}\,{\rho }_{{cv}}({{\bf{k}}},t)\right]\\ \frac{\partial }{\partial {{\rm{t}}}}{\rho }_{{{\rm{cv}}}}\left({{\bf{k}}},t\right)=\,-{{\rm{i}}}\left[\begin{array}{c}({\varepsilon }_{{CB}}\left({{\bf{k}}}\left(t\right)\right)-{\varepsilon }_{{VB}}\left({{\bf{k}}}\left(t\right)\right)-\frac{i}{{T}_{2}}){\rho }_{{cv}}\left({{\bf{k}}},t\right)\\+{{\bf{E}}}\left({{\rm{t}}}\right)\cdot \left(\begin{array}{c}\left({{{\bf{d}}}}_{{{\bf{cc}}}}\left({{\bf{k}}}\right)-{{{\bf{d}}}}_{{{\bf{vv}}}}\left({{\bf{k}}}\right)\right){\rho }_{{{\rm{cv}}}}\left({{\bf{k}}},{{\rm{t}}}\right)\\+{{{\bf{d}}}}_{{{\bf{cv}}}}\left({{\bf{k}}}\right)\left(2{\rho }_{{{\rm{vv}}}}\left({{\bf{k}}},t\right)-1\right)\end{array}\right)\end{array}\right]\end{array}$$
(1)
where \({{\bf{k}}}(t)={{{\bf{k}}}}_{0}+\frac{1}{{{\rm{c}}}}{{\bf{A}}}(t)\), with \({{{\bf{k}}}}_{0}\) the crystal momentum at \(t\,\)= \(0\), and \({{\bf{E}}}({{\rm{t}}})\) the electric field vector (in the dipole approximation), which is connected to the vector potential via: \(-{\partial }_{{{\rm{t}}}}{{\bf{A}}}(t)={{\rm{c}}}{{\bf{E}}}(t)\), and \({{\rm{c}}}\) is the speed of light. In Eq. (1), \({\rho }_{{ij}}\) is the density matrix, \({\varepsilon }_{{CB}/{VB}}\) is the band eigen-energy, \({{{\bf{d}}}}_{{{\rm{ij}}}}\) are transition dipole matrix elements, and \({{{\rm{T}}}}_{2}\) is the phenomenological dephasing time (taken as 5 fs49). From the density matrix we obtain the time-dependent current, \({{\bf{J}}}\left(t\right)={{{\bf{J}}}}_{{{\bf{intra}}}}\left(t\right)+{{{\bf{J}}}}_{{{\bf{inter}}}}(t)\) (separated to inter- intra-band contributions):
$${{{\bf{J}}}}_{{{\bf{i}}}{{\bf{n}}}{{\bf{t}}}{{\bf{r}}}{{\bf{a}}}}(t) =-\mathop{\sum }\limits_{{{\bf{k}}}\in {{\rm{BZ}}}}[{\rho }_{vv}({{\bf{k}}},t){{{\bf{p}}}}_{{{\bf{v}}}{{\bf{v}}}}({{\bf{k}}}(t))+{\rho }_{cc}({{\bf{k}}},t){{{\bf{p}}}}_{{{\bf{c}}}{{\bf{c}}}}({{\bf{k}}}(t))]\\ {{{\bf{J}}}}_{{{\bf{i}}}{{\bf{n}}}{{\bf{t}}}{{\bf{e}}}{{\bf{r}}}}(t) =-\mathop{\sum }\limits_{{{\bf{k}}}\in {{\rm{BZ}}}}2{{\rm{Re}}}[{\rho }_{cv}({{\bf{k}}},t){{{\bf{p}}}}_{{{\bf{v}}}{{\bf{c}}}}({{\bf{k}}}(t))]$$
(2)
where \({{{\bf{p}}}}_{{{\bf{ij}}}}\) are the momentum matrix elements. All momentum and dipole matrix elements, as well as band energies, are obtained through analytical expressions from the TB Hamiltonian, which is optimally fitted to DFT bands throughout across entire BZ with an accurate 14th-order nearest-neighbor Hamiltonian (where spin is neglected and with the gap at K/K’ offset to match experimental values, as it is often underestimated in DFT). From \({{\bf{J}}}\left(t\right)\) we compute the HHG spectrum as \({{{\rm{I}}}}_{{{\rm{HHG}}}}\left(\Omega \right)={\left|\int {{\rm{dtf}}}\left(t\right){\partial }_{{{\rm{t}}}}\,{{\bf{J}}}\left(t\right){{{\rm{e}}}}^{-{{\rm{i}}}\Omega {{\rm{t}}}}\right|}^{2}\), with \({{\rm{f}}}\left(t\right)\) being a super-gaussian window function. For all additional technical details of the propagation and numerical procedures see the SI.
Figure 3b, d, f present numerical results employing the SBE-TB formalism, showing strong agreement with the experiment. The simulations correctly predict the kink in the 7th harmonic yield vs. peak intensity (Fig. 3d). A pulse duration of ~ 200 fs is employed to resolve the peak splitting in Fig. 3d. In the inset of Fig. 3d, we confirm that nearly the same behavior is observed for a pulse duration of ~120 fs, corresponding to the actual experimental value. The total current (red line) can be decomposed into intraband (green line) and interband (blue line) components, elucidating that this effect originates from quantum interference between interband and intraband emission channels—a feature absent in either channel alone and requiring their complete or partial destructive interference. This is the first observation to our knowledge of such clear interferences in 2D systems. We note that the onset intensity of this effect is overall higher in the theory, likely due to excitonic effects not captured in our simulations. Excitonic resonances can enhance carrier excitation even at lower laser intensities. Strong Coulomb interactions also give rise to tightly bound excitons in real space, which in turn promote greater momentum-space delocalization of excited photo-carriers, even without laser-field-driven intraband excitations. According to recent studies54, exciton–phonon and exciton–plasmon scattering processes can provide finite momentum to the carriers. Furthermore, strong-laser-field-driven exciton ionization processes36 can open additional HHG pathways that are not captured by the current theory. To accurately address the issues above, time-resolved photoemission spectroscopy or time-resolved absorption spectroscopy under identical mid-infrared excitation can provide direct access to the probe excitonic states and carrier scattering dynamics in the time domain. However, such an investigation goes beyond the scope of the present study.
Theoretical analysis of HHG in monolayer WS2
At the next stage, our theory reproduces the peak broadening and splitting dynamics vs. laser intensity (see Fig. 3a–d)). Note that here we employed much longer driving laser pulses in order to obtain sufficient spectral resolution (~200 fs FWHM), but otherwise employed the same conditions as in the experiment. In the simulations, such long timescale dynamics are necessary to be able to resolve peak splitting on an energy scale of ~0.02 eV. Our theoretical analysis reveals that the splitting and converging dynamics do not arise solely due to interference of interband and intraband channels, as the effect appears in each channel separately (see SI for 7th harmonic spectrum from interband and intraband channels). To gain further insight, we perform a comprehensive k-resolved analysis of the HHG yield, and uncover that at the onset of the peak splitting, a substantial portion of the BZ is excited (comparing occupations in Fig. 4a, b, middle panel). Indeed, at high laser powers, electrons occupy not only regions near K/K’ valleys, but also towards \(\Gamma\) and M points. The HHG emission from these regions is comparable to that from the K/K′ valleys and, under certain conditions, can be even stronger. Mathematically, this is clear due to the relatively low optical gap throughout the BZ (e.g., the gap at \(\Gamma\) is ~ 3 eV, only ~1 eV higher than the gap at K/K’). The detailed spectral profiles are determined by the magnitudes and phases of the HHG emission, which depend on specific laser excitation conditions including finite beam size, temporal and spectral pulse profiles45,55. Nevertheless, this result clearly indicates that the peak splitting originates from quantum interference of laser-field-driven carriers occupying multiple k-points including regions near \(\Gamma\) and M points.
Fig. 4: Theory of peak splitting in HHG from WS2.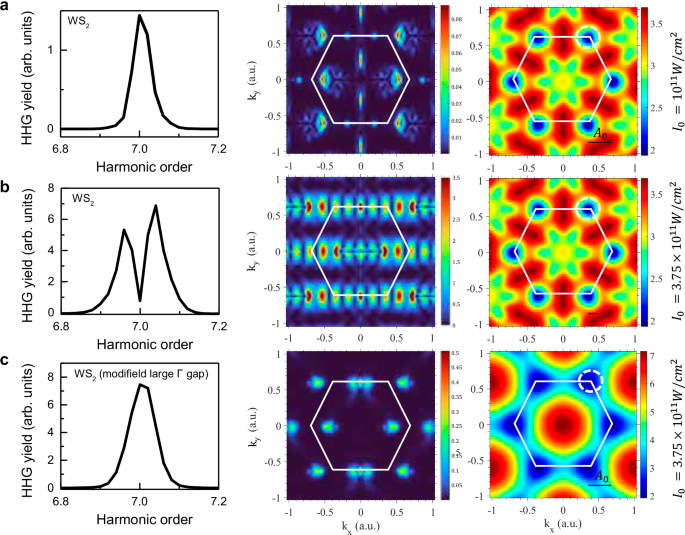
a SBE simulated 7th harmonic spectrum (left), showing no onset of peak splitting at lower power (100 GW/cm2). Middle panel shows the k-resolved contributions to this peak, indicating mostly localized charge carrier excitation and emission from the K/K’ valleys. Right panel shows the optical gap throughout the BZ in this system. The color is plotted on a linear scale for both middle and right panel. b Same as (a) for higher driving power (375 GW/cm2) where there is peak-splitting occurring. Here, emission is contributed form delocalized regions in the BZ, including from Γ and M. The evenly spaced interference pattern in k-space presumably indicates regions with constructive/destructive interference due to the phase of the harmonic emission. c Same as (b) but with the modified TB model (see text) that reproduced the electronic structure in WS2 only near the K/K’ valleys (see right panel), where peak splitting does not occur. The white hexagon shows the outline of the first Brillouin zone edge.
This conclusion is further validated by performing additional simulations where the TB Hamiltonian is modified to reproduce the correct electronic structure only near K/K’ valleys, while the gap is artificially increased towards \(\Gamma\) and M to suppress their contribution (see right panels in Fig. 4b, c). Indeed, in these conditions, the peak splitting phenomena are completely suppressed at identical laser power, corroborating that interference of emission between different points in the BZ accounts for the physical mechanism of peak splitting (and that specifically the K/K’ valleys, including their Berry curvature, cannot alone account for the effect). The peak closing dynamics at yet higher driving is seen to arise due to increased dominance of the intraband emission channel where the split peak converges.