
Strong magnon-phonon coupling
The low magnetic damping of YIG is contingent on high-quality monocrystalline films, typically grown on gadolinium gallium garnet (GGG) substrates35. Consequently, conventional integration of magnetic thin films into SAW delay lines on piezoelectric substrates36,37 is not feasible. To overcome this limitation, we employed a ZnO/YIG bilayer with GGG as the substrate, leveraging the demonstrated efficiency of SAW-mediated SW generation in ZnO/YIG heterostructures38. One-port SAW resonators were then fabricated on the ZnO layer, using electron-beam lithography. The piezoelectric ZnO interconverts elastic strain and voltages thereby providing an interface between the generating or detecting electrical circuitry and the SAW mode. The resonator features two opposing, shorted Bragg mirrors and a double-electrode interdigital transducer (IDT) centered between the refractors, which act only on the acoustic mode due to ZnO’s piezoelectricity. The IDT and Bragg mirrors were composed of 5 nm Ti and 30 nm Au. The dimensions of the resonator are given in Fig. 2a, and the sample stack including layer thicknesses is shown in Fig. 2c. Our acoustic resonator is defined on an extended bilayer sample (Fig. 2b) and thus occupies a small fraction of the available space to which the hybridized excitations are confined by the resonator. This contrasts sharply with the typical concept and design in magnon-photon systems39,40, in which the magnons and photons are confined separately by their respective full sample spaces.
Fig. 2: Magnon-polaron formation in acoustic resonator.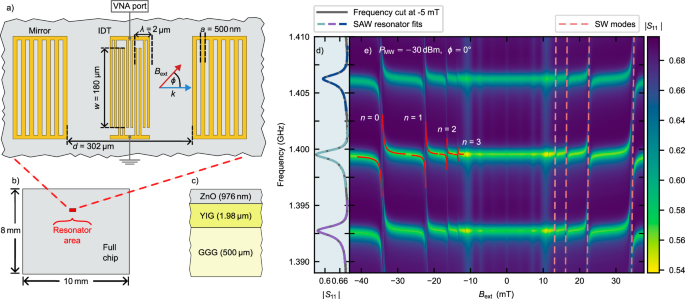
a Schematic top view of the fabricated one-port SAW resonator. Mirrors have 100 electrodes each, and the IDT consists of 20 finger pairs. Key dimensions: aperture (w), mirror finger spacing/width (a), IDT finger spacing/width (a/2), resonator length (d). The IDT is connected to the port of a VNA. The electrodes forming the resonator are patterned onto an extended multilayer. b Schematic top view of the chip, with the resonator region highlighted by a red rectangle. The resonator occupies only a small fraction of the total chip area. c Side view schematic of the material stack. d ∣S11∣ reflection parameter of the uncoupled resonator, showing three high-Q SAW resonances fitted to Eq. (3). e ∣S11∣ reflection parameter as a function of frequency and Bext. Anticrossing positions align with calculated SW modes (light red dashed lines). Anticrossing of the central high-Q mode is fitted to Eq. (1) for the first four SW modes to obtain coupling strength g.
Spatially resolved microfocused Brillouin Light Scattering spectroscopy confirms the supported SAW wavelength within the resonator to be λ = 2.09 μm, agreeing with the defining geometrical restriction (Supplementary Note 1A). To characterize the system eigenmodes, the IDT was connected to a vector network analyzer (VNA), and reflection parameter (S11) measurements were performed with the angle ϕ between the SAW wave vector k and the external in-plane magnetic field (Bext) fixed at ϕ = 0° (see Fig. 2a). All measurements discussed here were conducted at a low microwave power of −30 dBm to ensure the system remained within the linear regime. Figure 2d shows the unperturbed resonator’s response at Bext = −5 mT, where no SAW-SW coupling is observed. The resonator exhibits three distinct acoustic modes within its first stopband.
For further analysis, we focused on the central high quality factor (high-Q) SAW mode, which exhibited a resonance frequency of ~1.4 GHz and a quality factor Q = 1093 ± 8, determined from the fit to Eq. (3). From this total quality factor, the SAW loss rate (κp) was determined using the relationship κp = ωp/Q, resulting in a value of κp/2π = (1.28 ± 0.01) MHz, where ωp is the angular frequency of the central high-Q mode.
When the external magnetic field Bext is varied, additional field-dependent modes appear alongside the three aforementioned SAW resonator modes. These modes are symmetric with respect to the magnetic field direction, meaning they occur identically at positive and negative field values, as seen in Fig. 2e. In the range between −12 mT and +12 mT the magnetic excitations do not significantly interact with the SAW and are directly excited via the microwave currents in the electrical structures38. The dashed lines mark the hybridizing phonon-magnon modes. These arise when the magnon-phonon resonance conditions are fulfilled, leading to multiple anticrossings, highlighted by the solid lines in Fig. 2e. The observation of these avoided crossing features in the reflection data demonstrates that the strong magnon-phonon coupling limit is reached. We identify the specific magnon modes that hybridize with the SAW phonons by comparing the experimentally observed anticrossing positions with theoretically calculated SW dispersion curves for the YIG film (dashed lines in Fig. 2e). We calculate these theoretical dispersions following the approach laid out by Kalinikos and Slavin41,42, computed for a fixed in-plane k-vector equivalent to the SAW wave vector. Our calculation disregards the complex pinning conditions and anisotropies, which we compensate for with a small field shift.
The most pronounced anticrossing occurred at the highest magnetic field, which corresponds to the fundamental (n = 0) backward volume spin wave mode. Additionally, we observed clear anticrossings associated with the first three perpendicular standing spin wave (PSSW) modes (n = 1, 2, 3), thereby demonstrating coupling of phonons also to higher-order spin wave excitations.
To quantify the coupling strength (g) between the SAW and these SW modes, we fitted the observed anticrossings in the frequency spectrum to the theoretical expression including damping of the uncoupled modes39:
$${\tilde{\omega }}_{\pm }=\frac{{\tilde{\omega }}_{{{\rm{p}}}}+{\tilde{\omega }}_{{{\rm{m}}}}}{2}\pm \frac{1}{2}\sqrt{{({\tilde{\omega }}_{{{\rm{p}}}}-{\tilde{\omega }}_{{{\rm{m}}}})}^{2}+4{g}^{2}}\,,$$
(1)
where \({\tilde{\omega }}_{{{{\rm{p}}}}/{{\rm{m}}}}={\omega }_{{{{\rm{p}}}}/{{\rm{m}}}}-i{\kappa }_{{{{\rm{p}}}}/{{\rm{m}}}}\) are the complex angular frequencies of the phonon and magnon, respectively, including their decay rates κp/m. The resulting hybridized eigenfrequencies of the coupled system, corresponding to the upper and lower magnon-polaron branches, are denoted by \({\tilde{\omega }}_{\pm }\).
Within the narrow frequency window considered, the magnon frequency varies approximately linearly with magnetic field, in agreement with the calculated SW dispersion (dashed light-red lines in Fig. 2e). Accordingly, we model the magnon angular frequency as ωm = γBext + c, with γ = 28 ⋅ 2π, GHz T−1 the gyromagnetic ratio of YIG and c a constant frequency offset accounting for magnetic anisotropies.
The strongest coupling is observed with the fundamental SW excitation. The extracted coupling strengths for modes n = 0 − 3 are summarized in Table 1.
Table 1 Observed coupling strength g at ϕ = 0° for the fundamental SW excitation and the first three PSSWs
To fully characterize the coupling regime, we determined the magnon loss rate (κm) by analyzing the n = 0 SW mode, yielding κm/2π = (1.24 ± 0.02) MHz. A detailed description of this evaluation, together with a discussion of additional magnetic features in the anticrossing region, is provided in Supplementary Note 3. Comparing the loss rates with the coupling strength, we confirm that our system operates within the strong coupling regime, with a cooperativity of C = g2/(κmκp) = 14.5 ± 1.2 for the hybridization of the fundamental (n = 0) magnon mode with its corresponding SAW mode.
Our observed coupling strength agrees well with the calculations of our theoretical model (Section “Angle dependence of coupling”), which assumes that the magnon mode is restricted to the magnetic volume within the resonator. This agreement indicates that, in the strong coupling regime, the resonator confines the hybridized magnon-polaron, thereby giving rise to new coupled magnetoelastic boundary conditions43,44. Our theoretical model further attributes the observed reduction in the coupling strength for higher SW modes [Table 1] to a decreasing wavefunction overlap with the SAW mode.
Angle dependence of coupling
We further studied the angular dependence of the coupling strength by varying the angle ϕ between the external magnetic field and the wave vector of the excited high-Q SAW mode. We varied the angle in 3° steps and measured the resulting anticrossing behavior. Figure 3a–c shows the anticrossing with the fundamental SW mode n = 0 for three exemplary angles 0°, 30°, 60°. The red dashed lines represent fits to Eq. (1), from which the coupling strength (g) was determined. The error bars reflect the standard deviations of the fitted parameters as determined by the nonlinear least-squares regression. Evidently, the coupling strength depends on ϕ.
Fig. 3: Angle dependence of coupling strength.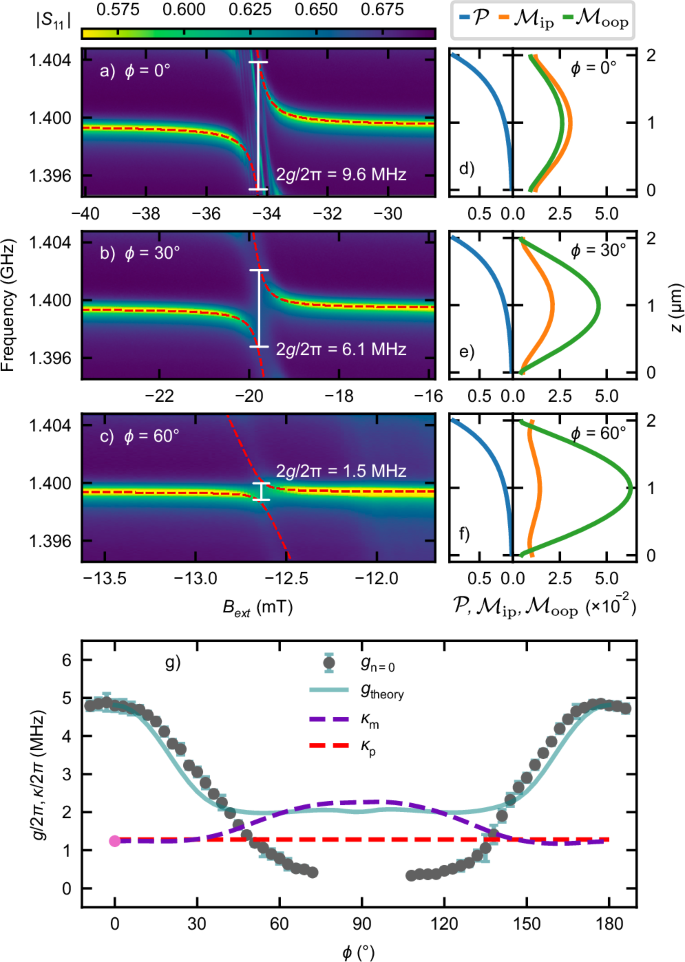
a–c ∣S11∣ reflection parameter as a function of frequency and Bext, showing the anticrosing between the central high-Q SAW mode and fundamental n = 0 SW mode at ϕ = 0°, 30°, 60°. The dashed red lines are fits to Eq. (1). d–f Depiction of the modeprofiles \({{\mathcal{P}}},\,{{{\mathcal{M}}}}_{{{\rm{ip}}}},\,{{{\mathcal{M}}}}_{{{\rm{oop}}}}\) of the phonon and magnon. The magnon mode ellipticity changes substantially with ϕ. g The experimentally measured (g) and theoretically calculated (gtheory) magnon-phonon coupling strengths in dependence of ϕ are shown for the spin wave mode n = 0. The theory shows excellent agreement around 0° and 180°. The red and purple dashed lines show the loss rates of magnons and phonons, respectively. The single pink data point indicates the directly measured magnon loss rate at 0°.
Before interpreting this ϕ-dependence, we describe the key features of our experimental design and our theoretical model detailed in the Methods section. In designing our hybrid system, we have chosen the thicknesses of the piezoelectric and the magnetic layers in the micrometer regime because the SAW mode decays on this length scale45. In this manner, our design maximizes the overlap between SAW and SW modes, as is also corroborated by our theory. In order to capture the key physics, we modeled the displacement profile (\({{\mathcal{P}}}\)) of the standing SAW mode in the resonator as an exponential decay from the surface, accounting for a general three-dimensional acoustic displacement. As demonstrated in refs. 38,46, the excited SAW modes in YIG/ZnO, despite being Rayleigh-type, exhibit shear displacement components which can further be enhanced by the resonator.
The SW mode profiles, which, unlike the SAW profile, depend on ϕ, were extracted from TetraX47,48 simulations. We define \({{{\mathcal{M}}}}_{{{\rm{oop}}}}\) as the out-of-plane magnetization component and \({{{\mathcal{M}}}}_{{{\rm{ip}}}}\) as the component orthogonal to the saturation magnetization, which lays in the film plane. The equilibrium magnetization is assumed to be parallel to Bext due to the in-plane anisotropy in YIG being small. The simulated profiles are shown in Fig. 3d–f for the three exemplary angles and detailed simulation parameters are given in Supplementary Note 7. The ellipticity of the SW mode profile changes with increasing angle.
As a key result of our study, Fig. 3g displays the measured (data points) and calculated (solid line) coupling strength as a function of ϕ for the fundamental SW excitation (gn=0). The angle dependence of the observed higher order couplings is shown in Supplementary Note 5. We observe good quantitative agreement between measurement and calculation. The only fitting parameters in the theoretical analysis are the SAW decay length into the substrate and the ratios between the different displacement components, since we do not have access to these via experiments or simulation. Nevertheless, the obtained values of these parameters agree well with the general expectations (Supplementary Note 7E).
Our device allows tuning between the strong and weak coupling regime as ϕ is varied. The transition occurs when g becomes smaller than the maximum loss rate. The loss rates κp, κm in our system are shown by red and purple dashed lines in Fig. 3g. A notable aspect of our system is the close proximity of κp and κm, a characteristic that capitalizes on the low SW damping in YIG.
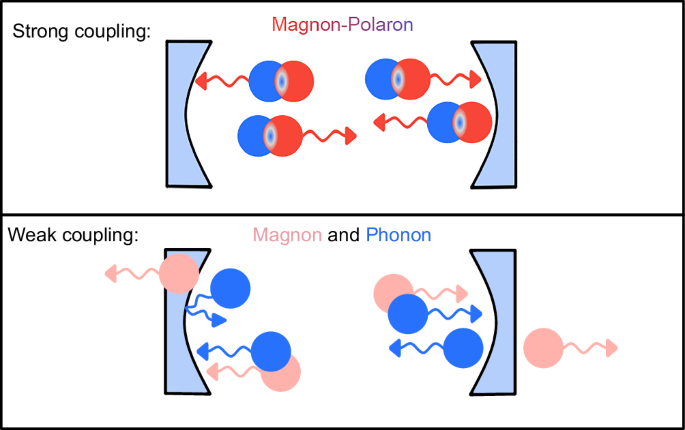
Our theoretical model takes two key features into account that allow us to understand and adequately reproduce the observed ϕ-dependence of g. First is the mode overlap. Due to the micrometer range thickness of our piezoelectric and magnetic layers, the SW modes significantly change their spatial dependence with ϕ. Consequently, the wavefunction overlap between the SAW and SW modes is also modified with ϕ. Second is the SW ellipticity. Since the components of the strain tensor couple differently to the orthogonal SW dynamical magnetizations, a change in SW ellipticity with ϕ appears to dominantly influence the g vs. ϕ curve. Employing our theoretical model, the observed ϕ-dependence further shows that the shear strain component dominates the SAW mode supported by the resonator. As ϕ increases, the experimentally observed coupling strength (Fig. 3g) decreases more strongly than predicted by our theoretical model, which assumes the phonon and magnon to be confined to the area of the resonator. This additional reduction of coupling strength is in accordance with an increased uncoupled magnon mode volume due to magnon leakage out of the acoustic resonator as depicted schematically in Fig. 1 and discussed in more detail in Supplementary Note 7. These two features that underlie our observations have not been addressed previously and further suggest future avenues for progress, especially by examining the boundary conditions and the hybridization effect.
Coupling dynamics in time domain
The SAW resonator’s standing wave formation and the magnon-polaron hybridization occur on comparable timescales. Thus, the ringing of the cavity phonons and the Rabi-like oscillations of the magnon-polaron bear a similar frequency. While Rabi-like oscillations have been reported in cavity magnon-polaritons15,49, our hybridized magnon-phonon system thus uniquely allows for the simultaneous observation of these Rabi-like oscillations and the transient evolution of the resonator response.
To access the system’s time-domain behavior, we performed an inverse Fourier transform on the complex frequency-domain S11 data, obtained from the 0° measurement presented in Fig. 2e, for each applied magnetic field value Bext. The resulting time-domain representation, \(| {\hat{S}}_{{{\rm{11}}}}|\), is shown in Fig. 4a and is equivalent to a conventional time-domain reflectometry signal34. In field regions where SAW-SW coupling is negligible, we observe distinct passes of the excited SAW through the resonator, manifesting as periodically spaced horizontally aligned lines that decay exponentially in amplitude. This represents the transient response of the SAW resonator. A corresponding cut along the vertical blue dashed line in Fig. 4a is shown in Fig. 4c (blue line). The periodicity and amplitude decay of these passes allow us to extract key SAW propagation parameters, such as the decay length lp = 757 μm and group velocity vgSAW = 2382 m s−1, as detailed in Supplementary Note 1D.
Fig. 4: Time dependence of coupling and Rabi-like oscillations.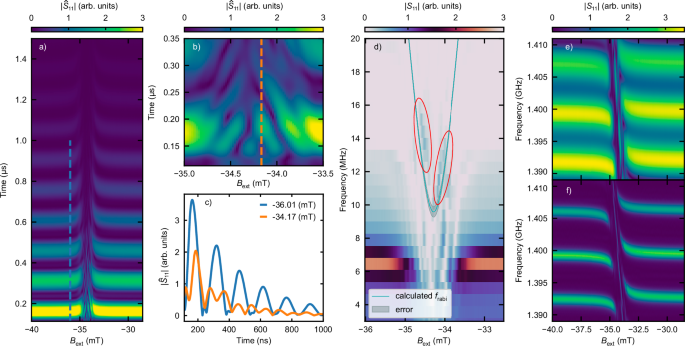
a Time-domain representation of the \(| {\hat{S}}_{{{\rm{11}}}}|\) reflection parameter as a function of time and Bext. b Close-up view of Rabi-like oscillations. The dashed orange line indicates the on-resonant time trace used for comparison with the off-resonant case in (c). c Comparison of on-resonant (orange dashed line from (b)) and off-resonant (blue dashed line from (a)) time traces, illustrating the change in oscillation frequency. d Frequency-domain representation of ∣S11∣, obtained via Fourier transform of a smaller region of interest in time-domain data. The broad horizontal line indicates the SAW resonator frequency. The plotted light blue line represents the calculated Rabi frequency and its numerical error is displayed in light gray. Red ellipses highlight the Rabi frequency signatures in the back-transformed ∣S11∣ parameter. e, f Time-gated ∣S11∣ reflection parameter showing different numbers of SAW passes: e 3 passes, f 11 passes. A clear dependence of the quality factor on the number of gated passes is observed.
Conversely, in field regions where coupling occurs (see the close-up view in Fig. 4b), we observe Rabi-like oscillations, an expected signature of a strongly coupled system. An exemplary linecut of the coupled behavior is shown by the orange line in Fig. 4c), revealing a clear change in oscillation period compared to the uncoupled case. Here, the formation of the magnon-polaron becomes apparent within the transient response of the resonator.
Consistent with the Rabi theory, we observe a change in the oscillation frequency when the energy gap between the two systems is detuned. In our system, this detuning is controlled by the applied external magnetic field strength, which shifts the spin wave dispersion. The theoretically predicted steady-state Rabi frequency frabi can be evaluated using information solely from the frequency domain analysis presented in Section “Strong magnon-phonon coupling”, specifically the detuning δ and the coupling strength g, according to50:
$${f}_{{{\rm{rabi}}}}=\sqrt{4{(g/2\pi )}^{2}+\delta },\,\,\delta=\frac{\gamma }{2\pi }| {B}_{{{\rm{ac}}}}-{B}_{{{\rm{ext}}}}| \,.$$
(2)
Here, Bac denotes the magnetic field at which the anticrossing is centered. The linear relationship assumed for the detuning with the difference between Bext and Bac is justified by the linear change of the SW frequency with magnetic field in this small frequency range, as explained in Section “Strong magnon-phonon coupling”. The calculated frabi is displayed by the blue line in Fig. 4d.
To compare the Rabi frequency from this simplified steady-state model, derived from frequency domain data, with time-domain observations, we performed a Fourier transform to back-transform a smaller region of interest of the time-domain dataset to the frequency domain. The resulting color-coded graph is shown in Fig. 4d. In regions where coupling is absent, the frequency of the SAW ringing is visible as a broad horizontal line at 6.5 MHz. This frequency is in accordance with the expectations from the SAW group velocity and the resonator dimensions. In regions where coupling is present, we identify frequency components in accordance with the Rabi frequency, highlighted by two red ellipses.
Comparing the calculated frabi from the frequency domain with these highlighted frequency components, we find reasonable agreement with this simplified analysis. The discrepancies can be attributed to several factors. Firstly, the polaron formation occurs concurrently with the establishment of the SAW mode within the resonator, leading to mutual influence and affecting the emergent polaron. Secondly, additional spurious magnetic signals within the anticrossing region influence the time-domain response of the resonator. The most prominent of these is the direct SW excitation (Supplementary Note 3) at the anticrossing center. Consequently, in the anticrossing center, the theoretically predicted hat-like shape (Supplementary Note 6) is interrupted by a minimum in the \(| {\hat{S}}_{{{\rm{11}}}}|\) signal right at Bac, caused by this direct SW excitation. The magnetic-field dependent contrast at lower frequencies in Fig. 4d is attributed to these spurious uncoupled magnon modes.
Finally, we demonstrate the ability to artificially manipulate the cooperativity of the system. This is achieved by applying a window function to a selected number of SAW passes within the resonator and subsequently performing a Fourier transformation to obtain the frequency-domain data. Figure 4e, f shows the frequency-domain signals for 3 and 11 gated SAW passes, respectively, with electromagnetic crosstalk removed (observed on different timescales). A clear broadening of the frequency linewidth of the SAW is observed, indicating that the quality factor decreases with a reduced number of gated passes, which in turn decreases the cooperativity. This illustrates how influencing the transient resonator response can artificially alter the resonator loss rate resulting in a change of cooperativity.
This analysis demonstrates the efficacy of our time-domain method for investigating coupling dynamics, employing readily applicable mathematical techniques detailed in the Methods section, and confirms a comprehensive understanding of the SAW resonator’s behavior.
Discussion
We have demonstrated the hybridization of a magnon-polaron in a virtually infinite magnetic medium, marking a key advance beyond the conventional regime of propagating-mode coupling. Central to our approach is the use of an acoustic cavity that confines the hybrid excitation when the constituent magnon and phonon modes are strongly coupled, similar to an analogous phenomenon in light-matter interaction11.
By accounting for both wavefunction overlap and SW ellipticity, our theoretical framework captures the angle-dependent coupling strength observed in the experiments.
The use of a single-crystalline YIG film is essential for attaining comparable loss rates for SAWs and SWs, both below 1.5 MHz—a notable milestone not previously reached in SAW-SW coupling.
In addition, the low phononic group velocity in our system offers a unique opportunity to resolve the coupling dynamics in the time domain. The observation of Rabi-like oscillations provides direct evidence of strong magnon-phonon interaction shaping the temporal response of the SAW resonator. This capability opens new avenues for time-resolved studies and coherent control of hybrid magnon-phonon states through tailored dynamical driving schemes. Moreover, by implementing dissipation engineering strategies18,25, it may become possible to further suppress magnon-polaron losses and extend the coupling to additional excitations in solid-state platforms, thereby broadening the potential of this on-chip approach.