
Most of the freshwater in the United States isn’t in rivers or lakes. It’s underground, hidden at different depths, and it can change dramatically from one place to the next.
A new study offers a much sharper picture of that buried supply, using a blend of direct measurements and artificial intelligence to estimate groundwater depth across the continental U.S. at an unusually fine scale.

The map suggests there are about 306,000 cubic kilometers of groundwater – more than 13 times the volume of all the Great Lakes combined. The total isn’t wildly different from earlier estimates, but the detail is.
The researchers say the model reveals shallow groundwater pockets that older, coarser maps tended to miss. These areas could affect irrigation, infrastructure, conservation, and local water planning.
Filling gaps in groundwater records
The work was led by researchers at Princeton University and the University of Arizona. Their basic challenge was simple to describe and hard to solve: groundwater measurements are uneven.
Researchers closely monitor some regions, while others have few data points.
Study senior author Reed Maxwell is a professor of engineering and applied science at Princeton University.
“Given all the things we do know about the planet, we don’t actually know how much water we have,” said Professor Maxwell.
“And since most of it’s in groundwater, knowing how much surface water we have is only about 1% of the total. That’s where this becomes a hard problem. That’s where it becomes an interesting science problem.”
To build the map, the team pulled together more than a million direct measurements of groundwater depth, then paired them with regional climate and geologic information.
The combined dataset was used to train machine-learning models that could predict groundwater depth in places where no measurements exist.
A hyper-detailed groundwater grid
Instead of describing groundwater at a broad county or watershed level, the researchers went extremely granular.
They divided the continental U.S. into a grid of more than 8 billion squares, each about 30 meters on a side. A groundwater depth estimate was produced for every one of them.
Depth alone isn’t the same as volume, though. The team combined the depth map with estimates of porosity.
A porosity measure reflects how much open space exists in underground rock and sediment and how much water they could plausibly store. This “hyper-resolution” approach is what sets the work apart.
Many national-scale groundwater models relied mainly on physics-based equations describing subsurface water movement. These models typically operated at around one-kilometer resolution.
The new AI method is far more fine-grained, and the researchers argue it captures local variation that older approaches smooth over.
Deciphering long-term measurements
One tricky part is time. Researchers analyzed groundwater measurements from 1895 to 2023, with more than half of the locations measured only once.
That means the map isn’t a snapshot of a single year. The team used all available data to build the best estimate possible.
“We had to [combine data from different time periods] to have enough to use a purely data-driven approach. These problems need big data, and we needed a lot of observations to be able to have a reliable model,” said Maxwell, who is also a professor of civil and environmental engineering at the High Meadows Environmental Institute.
The map can hint at patterns linked to groundwater pumping, especially in heavily farmed regions, but the team is careful about how far they push that interpretation.
Researchers expect trends like drawdown to become clearer with more repeated measurements over time.
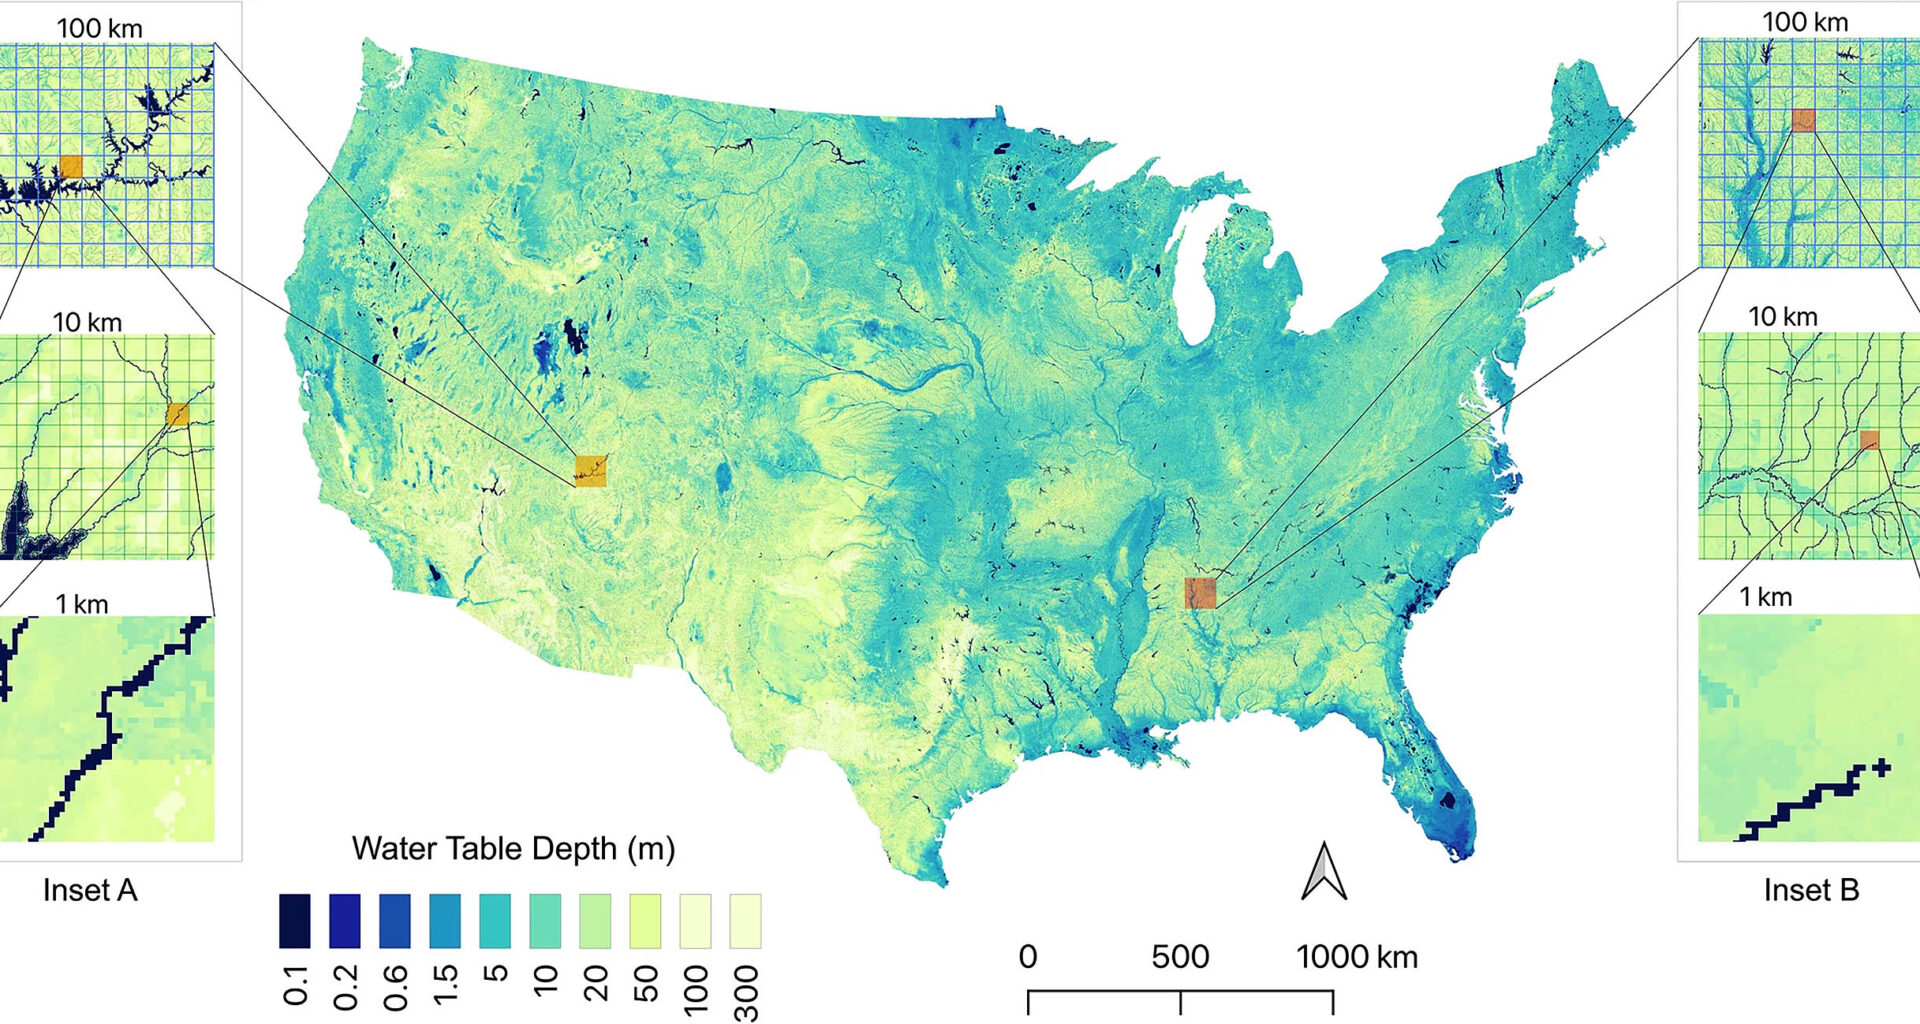
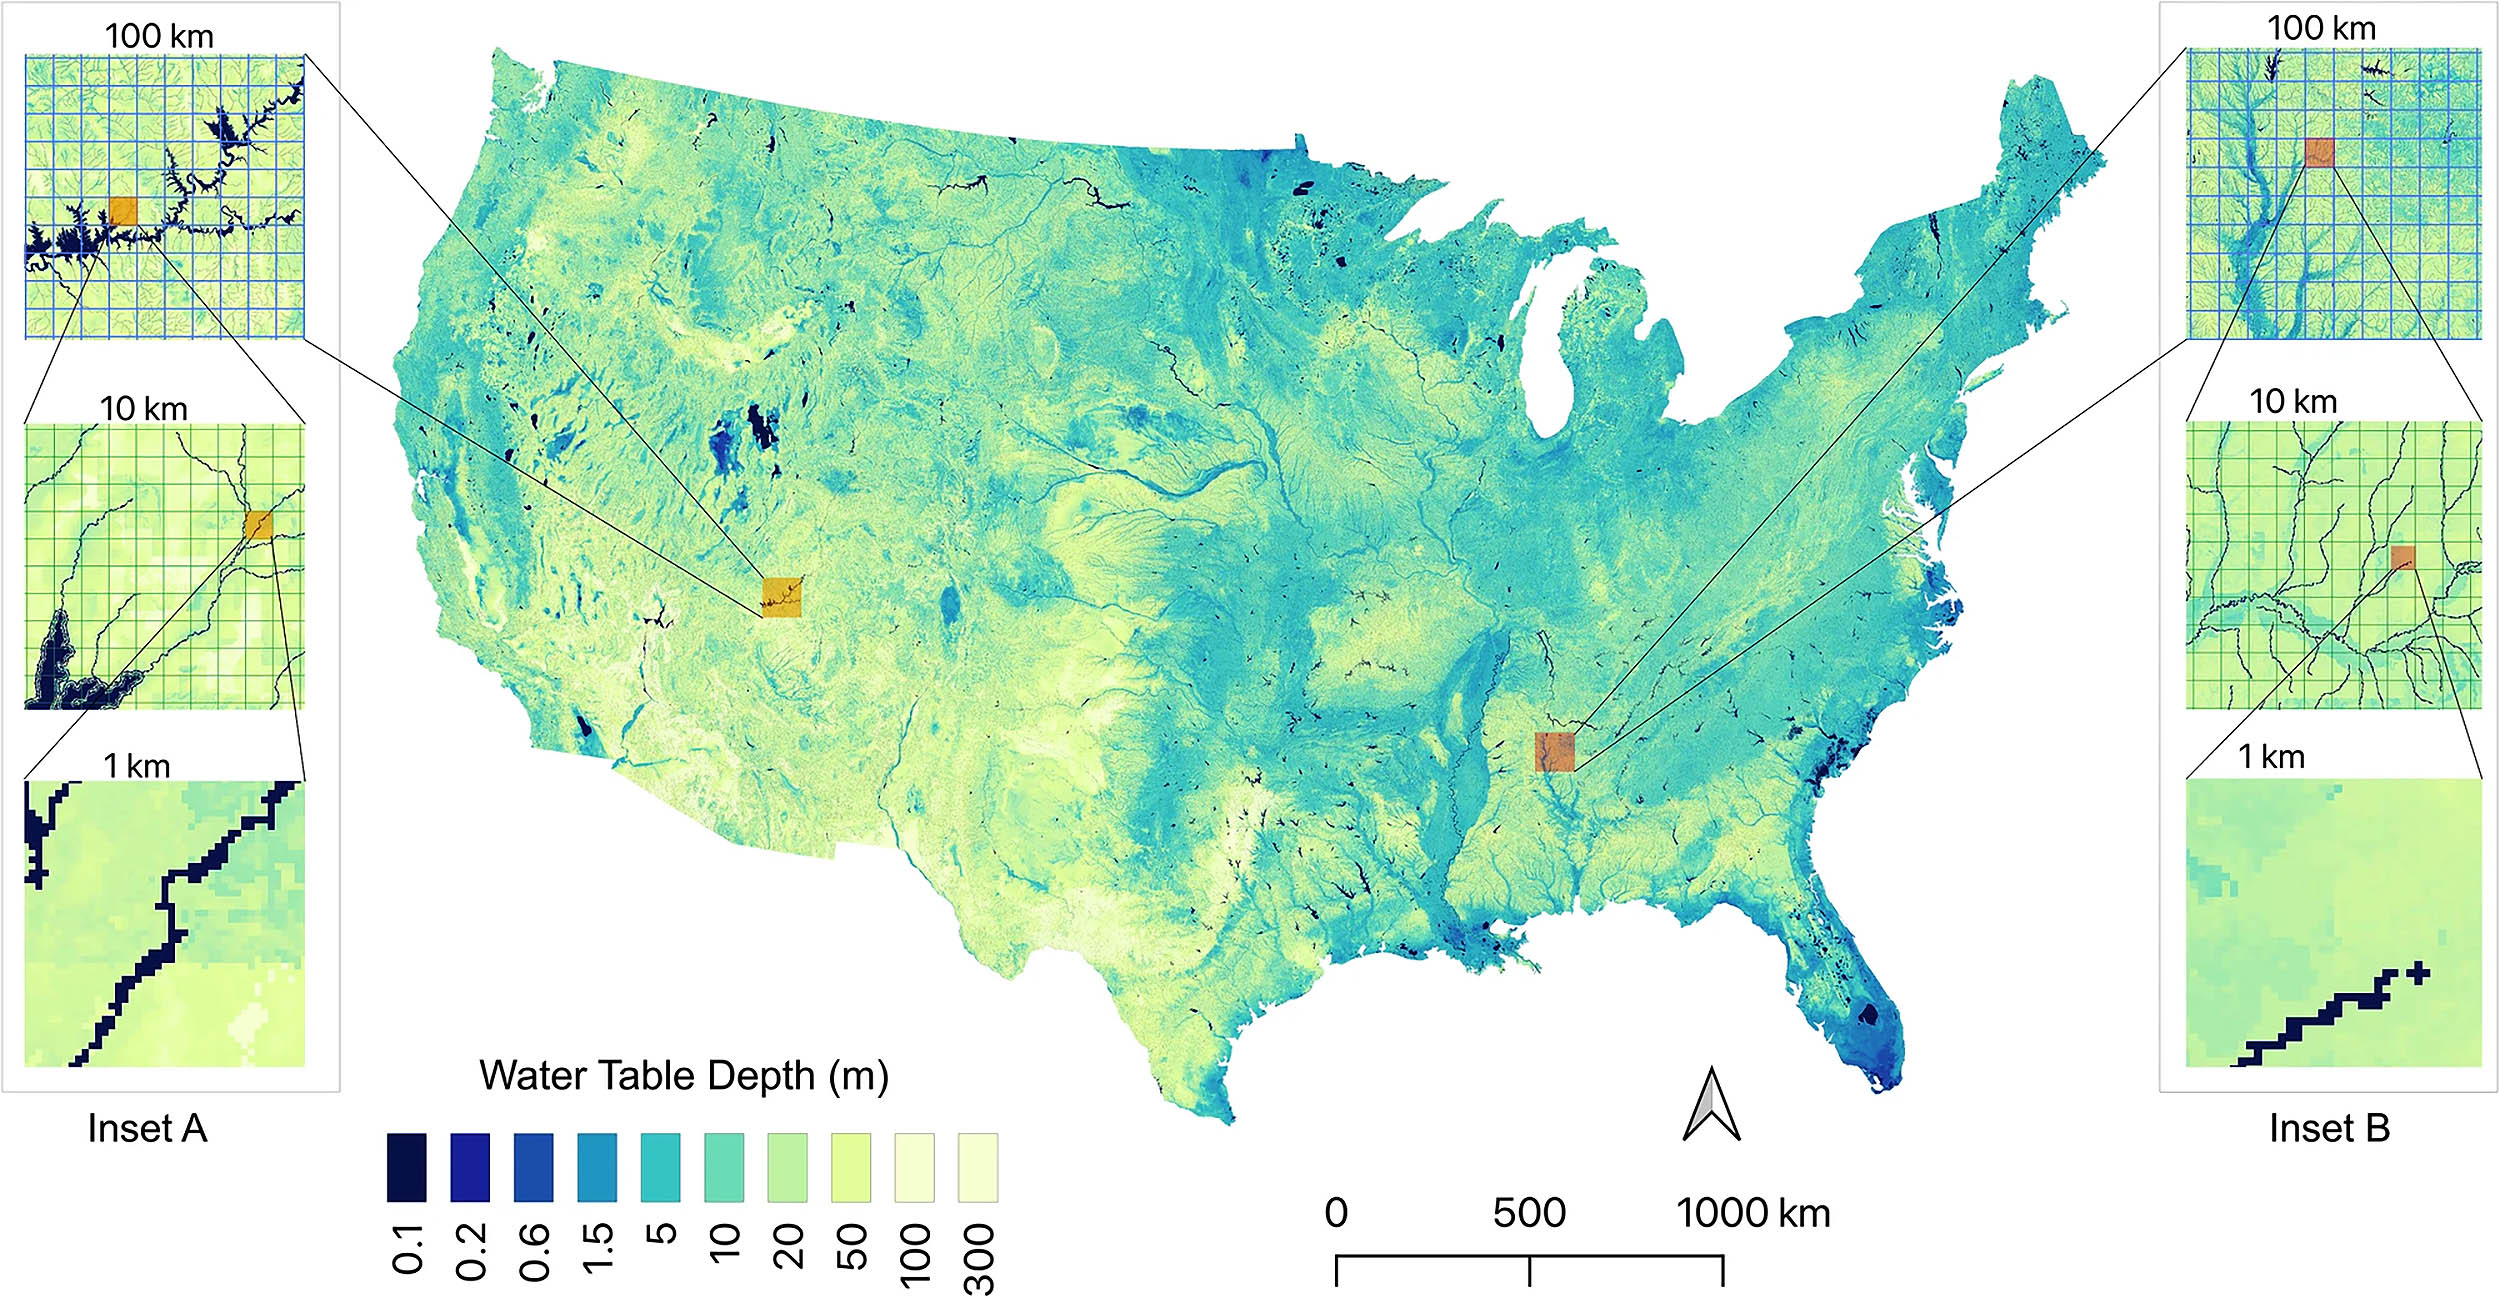 This product is national in scope and covers 7.3 M km2 yet provides detail at one arc-second (~30 m) resolution. Insets A and B demonstrate these changes in scale, starting at a pixel 100 km on a side, scaling down to show the range of water table depths (WTD) present in even a 1 km cell. Note the log scale in this figure. Credit: Princeton University. Click image to enlarge.Recognizing the model’s limits
Another key feature of the map is that it quantifies uncertainty. Rather than assigning a single groundwater depth to each location, the researchers also estimated how reliable those predictions are across different regions.
This information is crucial for decision-makers, since it shows where the map is well supported by data and where estimates should be treated more cautiously.
To calculate this uncertainty, the team used a machine-learning approach known as a random forest.
“For each location, the method uses 300 decision trees. Each of these trees is trained slightly differently and is trying to solve the same problem,” said study co-author Peter Melchior, an assistant professor of astrophysical sciences at Princeton.
“So, they find different solutions to it. If you have a full forest of them, you can use the variation between them as an estimate of the underlying uncertainty.”
The uncertainty tends to be higher in the western U.S. than in the East. That’s especially important because the West often has deeper water tables and relies heavily on groundwater for drinking water and irrigation.
Everyday water decisions
This isn’t just a national accounting exercise. The researchers argue that the usefulness of a 30-meter map shows up at the scale where people actually make choices.
For example, much of U.S. agriculture depends on center-pivot irrigation: a large rotating sprinkler system fed by a single well.
Those systems make a lot of small, repeated decisions, such as where to drill, how deep to draw water from, how vulnerable the supply might be.
“It’s this local decision [of how to irrigate] that is made millions of times,” Maxwell said. He argues that older models often missed the shallow groundwater that can make or break agricultural planning, while the new approach is built to detect it.
“There’s a wide range of people who need to understand how much [groundwater] there is, how deep it is, how accessible it is,” he added. “And those are just the immediate management needs that’ll be met by this.”
According to study lead author Yueling Ma, researchers focused on geochemistry and water quality have already shown interest in using the dataset to guide their own modeling.
Sharing data publicly
The model outputs are publicly available through the team’s HydroFrame platform, which is part of a broader effort called HydroGEN. The goal is to make hydrology tools easier to access and apply, not just for specialists.
Laura Condon is a co-author of the study and a professor of hydrology and atmospheric sciences at the University of Arizona.
In her view, the mix of experts involved in the study helped turn research ideas into something usable, with a strong focus on software and user experience.
The team is also starting to adapt the approach beyond the U.S., including work in parts of Europe, Australia, and Brazil.
The challenge, they note, is that many regions have far less monitoring data than the United States. But that’s also where better modeling could have the biggest payoff.
“The idea is to build this community globally, with the hope that as the model gets more generalized and more robust, it becomes a foundational machine-learning model for groundwater,” Maxwell concluded.
The study is published in the journal Communications Earth & Environment.
—–
Like what you read? Subscribe to our newsletter for engaging articles, exclusive content, and the latest updates.
Check us out on EarthSnap, a free app brought to you by Eric Ralls and Earth.com.
—–