
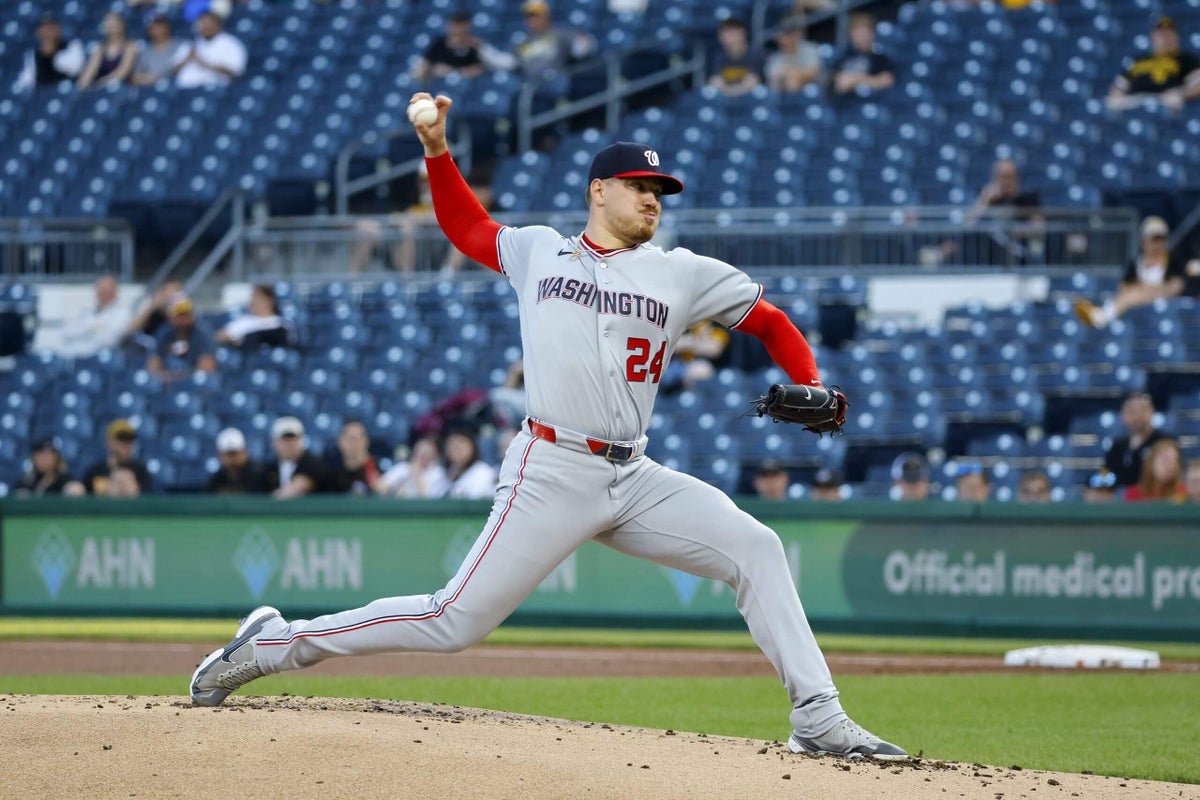
PITTSBURGH — The Nationals are an enigma. Their offense is a steamroller. Their pitching staff has often run out of steam — no more so than in Monday night’s 16-5 loss to the Pirates, which began with command issues from Cade Cavalli and ended with outfielder Joey Wiemer grinning on the mound as he lobbed pitches towards home.
Though a 16-game sample is still too small for absolutes and conclusions, there are meaningful metrics from a fascinating start to this new era. Here are six numbers — some predictive, others significant — that have defined Washington’s season so far and are worth watching moving forward:
1. Cade Cavalli’s in-zone rate: 41.2 percent.
In the second inning, Cavalli looked to his dugout, then to the Pittsburgh sky. This is the last thing he wanted: For his manager to walk up those steps because his command rendered the intoxicating stuff obsolete.
Cavalli offered promise to a rotation that needed it. He got the Opening Day nod because of it. He moved further to the third-base side of the mound and dropped his arm slot a bit to keep hitters even further off-kilter. Command wasn’t an issue last season, nor was it a problem this spring. It’s been one now.
“Yeah, I’m not sure,” Cavalli said when asked why the problem arose. “I believe I’m going to (throw strikes) again. Not pressing any panic button yet.”
Manager Blake Butera said he could tell Cavalli was “fighting his delivery” a bit, but couldn’t pinpoint one issue. They’ll review the tape on Tuesday.
2. James Wood’s in-zone contact rate: 84 percent
The best hitters in MLB do not have to make contact. But there is always a certain point when hitters miss so frequently on pitches inside the zone that it becomes untenable.
For Wood, any prolonged stretch last year where his in-zone contact rate was below 80 percent spelled trouble. Before July 4, he had a .958 OPS and an 84.7 percent in-zone contact rate. From July 4 on, he had a .660 OPS and a 76.8 percent in-zone contact rate. This year, he’s back up where he needs to be.
In fact, what makes this metric even more compelling is that he is whiffing far more often on pitches outside the zone. It all points to a player who understands his superpower: Keeping his barrel through the zone as long as possible, and crushing the baseball when it arrives in that sweet spot.
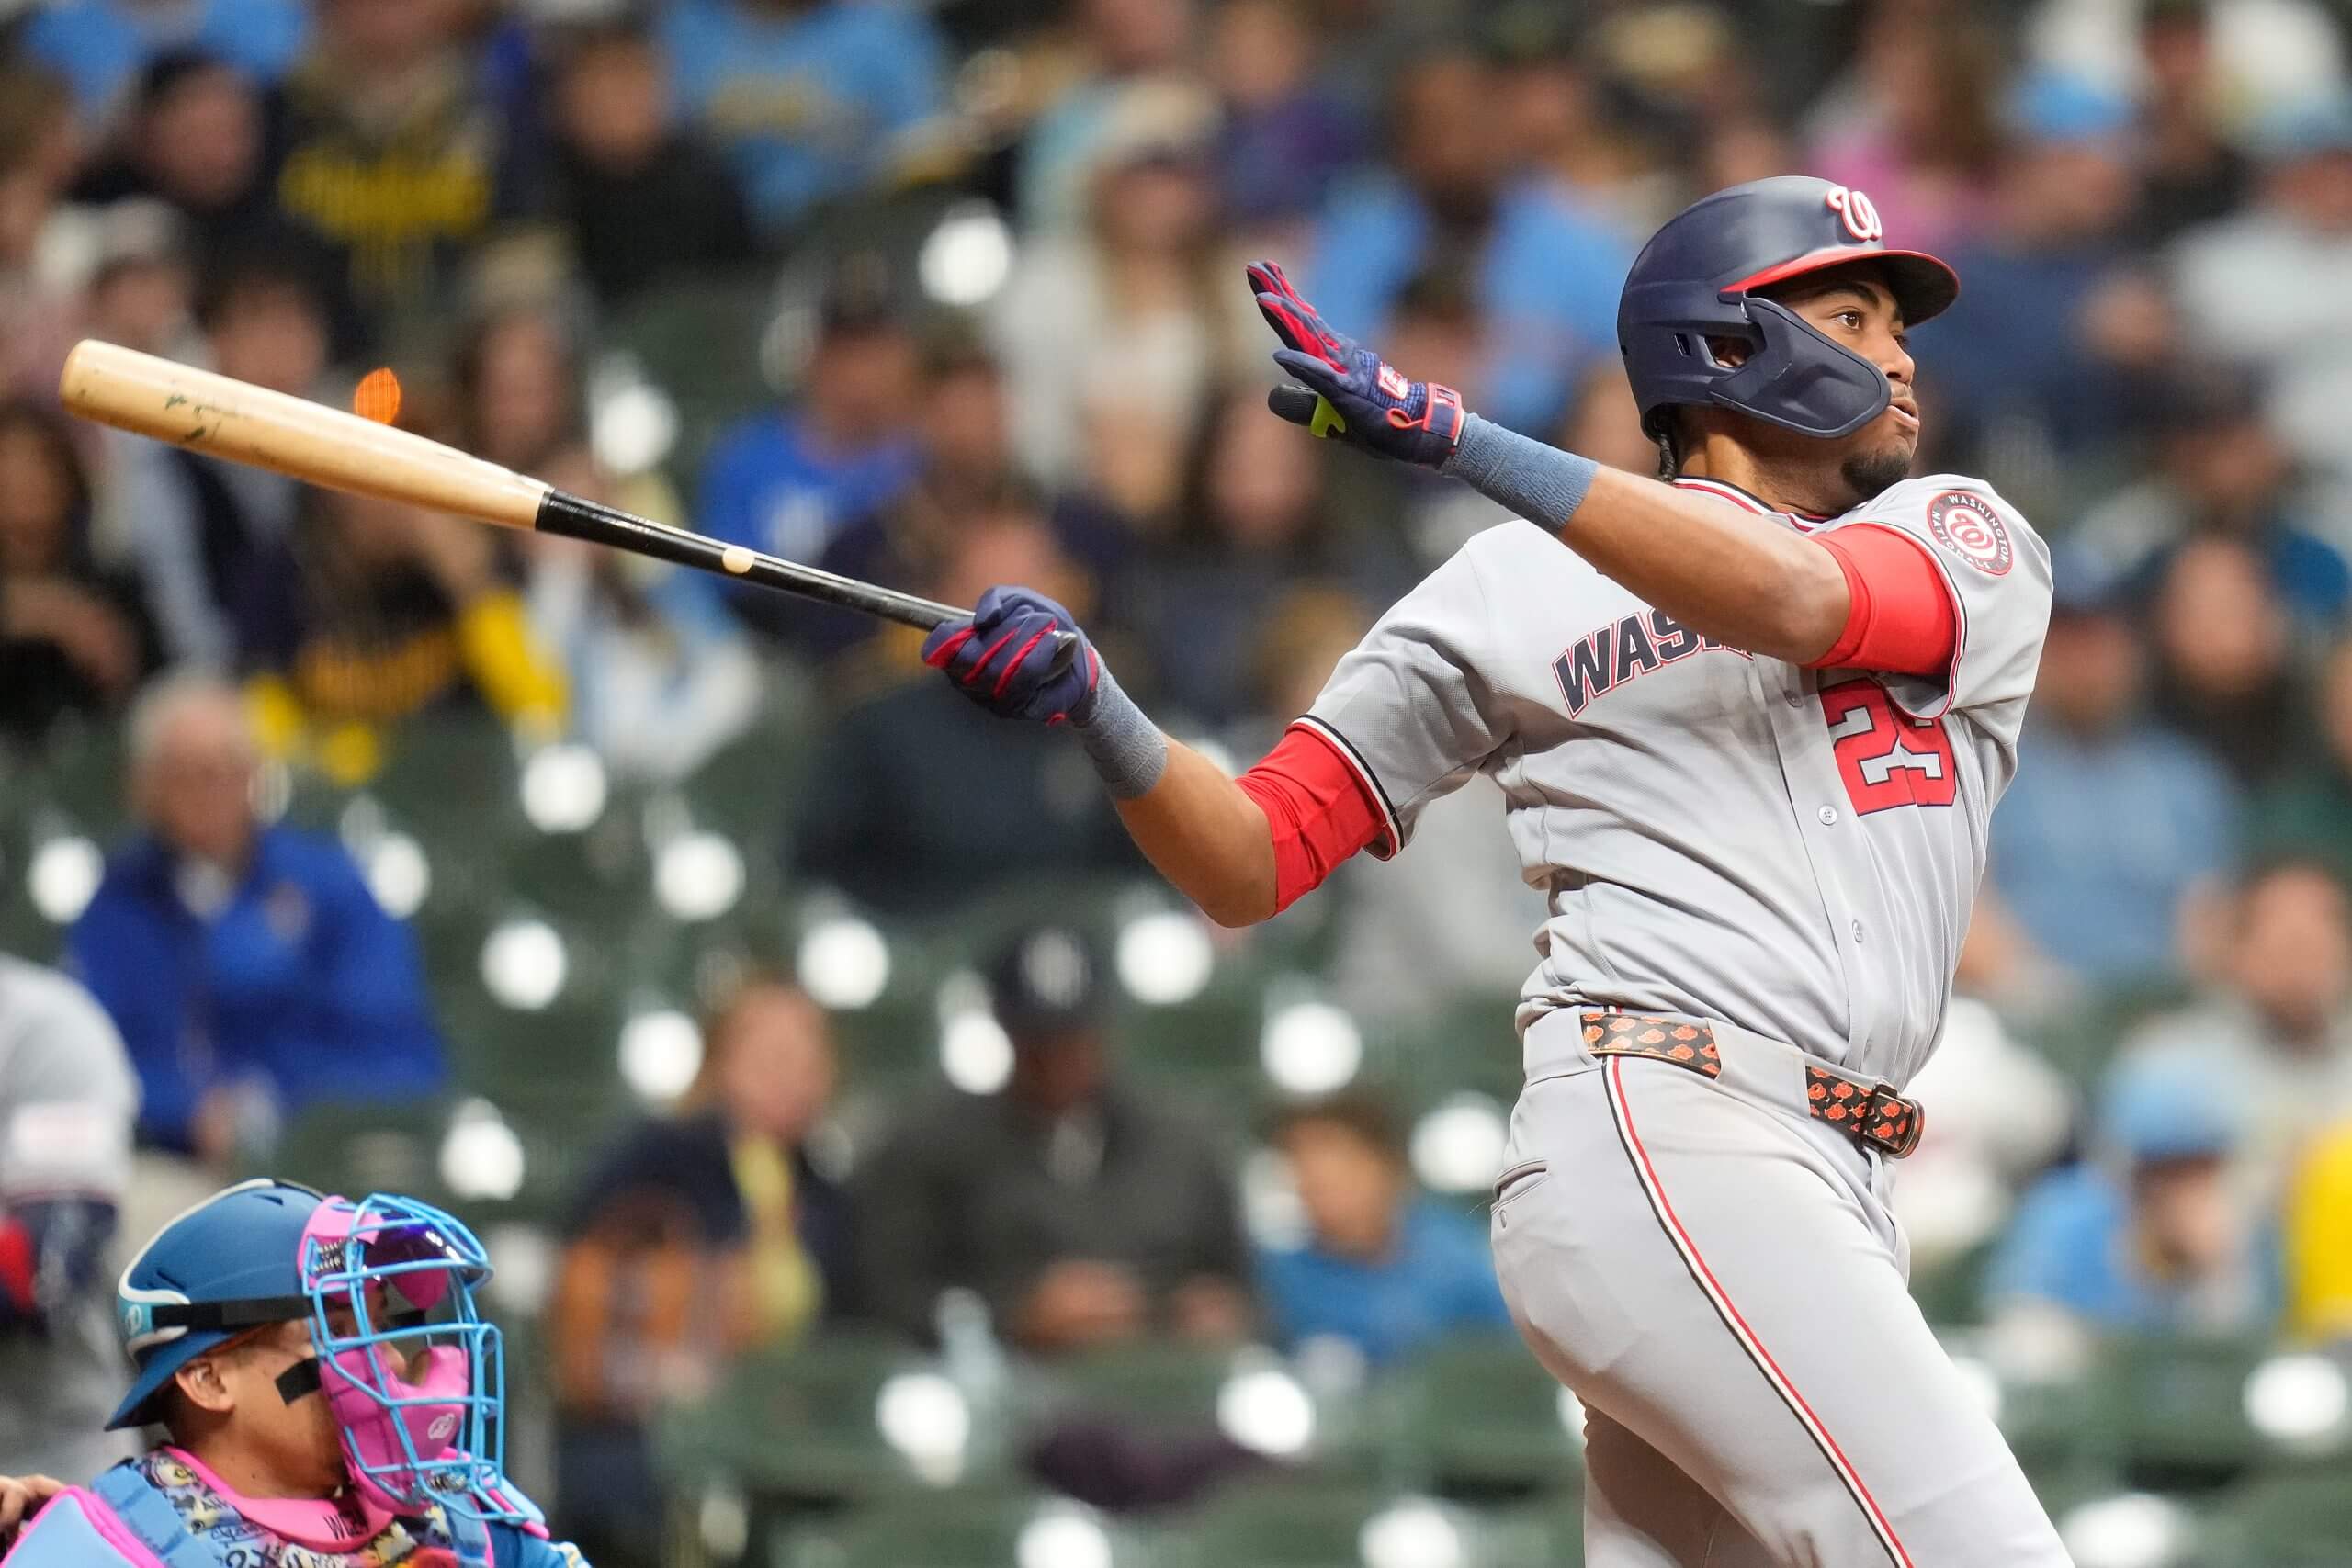
Through the early part of the season, James Wood has a higher OPS than he did at the All-Star break last year. (John Fisher / Getty Images)
For all the hand-wringing about Wood’s 4-for-36 start to the year, he has a higher OPS (.997) than he did at the All-Star break last year (.915). Among hitters who have seen at least 100 pitches in the zone, Wood’s .810 slugging percentage on those pitches ranks sixth. Last year, he ranked 14th.
3. Catcher framing runs: 2
Here is where the Nationals catching group has ranked in Statcast’s catcher framing metric in the six seasons since they won the World Series: 30th, 25th, 28th, 28th, 28th, 29th. Over those six seasons, their catchers have been worth minus-79 framing runs.
Through 15 games in 2026, they rank fourth — and can make that number minus-77.
In spring training, Butera stated in no uncertain terms that framing is a developmental item that can improve quickly with the right instruction. It should be treated, then, as a barometer for development. So far, they’ve nailed it.
Why does this matter? The Nationals have cost themselves dozens of runs over the years with poor framing. Keibert Ruiz has struggled forever in this facet, and he’s made a massive leap. Moreover, the team acquired top prospect Harry Ford this winter and acknowledged that he had the most room to grow as a receiver. Now, they have shown they can teach it.
4. CJ Abrams pull-air rate: 25 percent
Some metrics feel unsustainable. After he sent a 99.5 mph heater from Paul Skenes into the right-field seats on Monday, it’s safe to say this one feels feasible.
There is a nonchalance with which Abrams describes his ability to pull the baseball. Sometimes, it happens when he is trying to hit the ball to the opposite field. Ultimately, he’s just relaxed at the plate and uber-prepared heading into each at-bat.
“It’s been there, but being able to swing at pitches I can do it with is big,” Abrams said. “In the past, I would kind of swing at balls outside the zone. I’m shrinking it this year.”
That’s good news for the Nats. Abrams is a good power and contact hitter, but those have never been his outlier tools at the big-league level. Some of the most valuable hitters in baseball are not the lumbering sluggers, but players like Abrams who can consistently pull the ball in the air. Abrams is sticking to that swing, and not budging, no matter how many breaking balls teams throw him (and there are a lot of them).
The most popular pitch in MLB has seemed to dictate every Nats game this season. The offense is crushing fastballs. The pitching staff is getting crushed by those same heaters.
Washington is throwing far fewer heaters this year, hoping its pitchers lean into throwing their very best stuff. That is great when it works, but it hasn’t dissuaded teams from going up to bat with a plan to hit the fastball anyways. It is why the Nats pitching staff ranks 29th in MLB in this metric. The offense, which ranks second in the same metric, is trying to make up ground.
6. Relievers K/9: 7.09
Relief pitchers throw harder than starters. They inherit runners, who can’t score if the baseball isn’t put in play. In short, relievers must strike out hitters. This is the job.
Washington’s relievers are not doing that job. In the ninth inning on April 1 against the Philadelphia Phillies, they got six batters to two strikes, and none struck out. In the eighth inning on April 5 against the Los Angeles Dodgers, they faced three batters with a runner on third and fewer than two outs, threw nine pitches and didn’t miss a single bat. On April 7, when the St. Louis Cardinals sent the tying run to the plate in the eighth, they couldn’t miss a bat.
Each time, that flipped the game from a win to a loss.