
The cavity optomechanical system
In what follows, we build our cavity optomechanical system around the μHBAR seen in Fig. 1a. The μHBAR is an FP resonator for bulk acoustic phonons, supporting a series of high-Q-factor Gaussian modes. The μHBAR is created by shaping the surfaces of a 500-μm-thick z-cut α quartz substrate into a plano-convex geometry using a reflow-based fabrication process33. The μHBAR has a 100-mm radius of curvature and cavity length of 500 μm, forming a stable Gaussian-beam resonator for longitudinal bulk acoustic phonons. This design produces fundamental longitudinal acoustic modes with a waist radius of 31 μm at 12-GHz frequencies, corresponding to a motional mass of 7.5 μg (refs. 33,44). At 1,550-nm wavelengths, mode matching with a Gaussian laser beam permits mode-selective coupling to phonon modes near the Brillouin frequency (12.65 GHz), as dictated by the phase-matching condition for acousto-optic Bragg scattering42.
Fig. 1: Brillouin-based optomechanical system.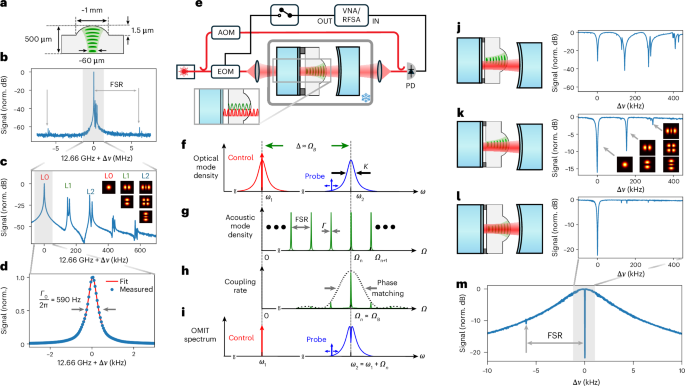
a, Schematic of a μHBAR. b, Optically driven acoustic response of the μHBAR, showing acoustic resonances with a 6.04-MHz FSR. c, High-resolution measurement of the driven acoustic response, showing Hermite–Gaussian modes (L0, L1, L2) with 140 kHz transverse mode spacing. d, Driven response of the fundamental (L0) acoustic mode showing a linewidth of Γ0/2π = 590 Hz at 7 K. e, Schematic of the cavity optomechanical system; the μHBAR was positioned within an optical FP optimized for acousto-optic mode matching and cooled to 13.6 K. Light in the upper apparatus arm was frequency shifted by an acousto-optic-modulator (AOM), creating an LO for heterodyne detection. Light in the lower arm was modulated by an electro-optic modulator (EOM), generating a probe tone for OMIT/OMIA measurements. The transmitted light was mixed with the LO and detected by a high-speed photo detector (PD); detected signals were analysed with a vector network analyser (VNA) during OMIT/OMIA measurements (switch closed) and a radio frequency spectrum analyser (RFSA) during spontaneous measurements (switch open). Inset: phase-matched optomechanical coupling achieved when two adjacent optical modes had a frequency separation matching the phonon frequency and the spatial periodicity of their interference (red) matched that of the phonon mode (green). f–i, Phase matching and spectral filtering used to realize single-mode coupling. Within the optical FP spectrum (f), two modes separated by the Brillouin frequency (ΩB) enable resonantly enhanced optomechanical scattering. g, A uniform phonon-mode spacing of the fundamental μHBAR modes. h, Modulation of the optomechanical single-photon coupling rate (go) produced by phase matching near the Brillouin frequency. i, The single-mode OMIT spectrum resulting from phase matching and filtering in this system. j–l, OMIT traces for different μHBAR alignments within the FP, from misaligned (j) to partially misaligned (k) and optimally aligned (l); optimal alignment (l) yielded single-mode (L0) coupling with >20-dB suppression of higher-order (L1, L2 and so on) modes. m, Broad OMIT scan at optimal alignment (l), showing selective coupling to the fundamental acoustic mode, while suppressing adjacent modes at Δν = ±6 MHz (Supplementary Information Section VIII). norm., normalized.
The μHBAR’s phonon-mode spectrum was independently measured at cryogenic temperatures using non-invasive laser-based Brillouin spectroscopy of the type described in ref. 48. As seen from the measured phonon-mode spectra (Fig. 1b–c), this resonator supports families of longitudinal modes, with an FSR of 6.04 MHz and a transverse mode spacing of 140 kHz. Measurements of the fundamental phonon mode at T = 7 K (Fig. 1d) reveal a phonon Q-factor of 21 million (590 Hz linewidth) at 12.66 GHz, corresponding to an f–Q product of 2.7 × 10¹⁷ Hz, a key figure of merit that characterizes decoupling of a resonator from its thermal environment1. Similar μHBAR resonators have yielded record f–Q products of 3.13 × 10¹⁸ Hz, corresponding to 6.2-ms coherence times48. Hence, with optomechanical control, such long-lived phonons could become a compelling quantum resource. However, conventional cavity optomechanical techniques based on sideband-resolved coupling become impractical due to the high frequencies of the Brillouin-active phonon mode (~12 GHz) and relatively small zero-point coupling rates (g0/2π < 20 Hz) produced by photo-elastic coupling to these massive phonon modes.
To address this challenge, we used resonant enhancement of the Brillouin interaction to dramatically boost the optomechanical coupling rates43. The μHBAR was placed inside a high-finesse (F ≈ 3,000) plano-concave optical FP resonator (Fig. 1e) with a mode spacing (Δω = ω2 − ω1) that matched the frequency of the Brillouin-active phonon mode (Ωn) falling within the Brillouin phase-matching bandwidth. This permits the incident pump photons to be scattered between the optical cavity modes by the Brillouin-active phonon mode through resonant intermodal scattering (Fig. 1f–i). When pumping either optical mode, resonant enhancement of the intracavity photon number (nc) dramatically increases the optomechanical coupling rate (\(g={g}_{0}\sqrt{{n}_{\rm{c}}}\)) to the macroscopic μHBAR resonator phonon modes43. We show that such resonantly enhanced coupling schemes enable cooperativity of C > 1 at microwatt power levels and efficient quantum control of these massive, high-Q-factor phonon modes.
The mode spectrum of the optical FP resonator was designed to create a substantial sideband asymmetry, as needed for quantum control of the μHBAR phonon modes. Weak intracavity reflections created by the quartz μHBAR surfaces result in non-uniform optical mode spacing43. This non-uniform mode spacing was used to shape the spectrum and control scattering processes43. By selecting two optical modes (ω1, ω2) within this non-uniform spectrum that satisfy the condition for resonant scattering (ω2 − ω1 ≈ ΩB), with spacings between adjacent mode pairs that are detuned from resonance, we inhibited unwanted scattering processes43. This symmetry breaking resulted in a large (>1,000-fold) difference between the Stokes and antiStokes (AS) scattering rates, allowing us to virtually eliminate the Stokes or AS interaction by resonantly exciting an appropriately chosen optical mode (Supplementary Information Section III). However, even when these conditions are satisfied, numerous μHBAR phonon modes can mediate scattering between these optical cavity modes. As seen in Fig. 1h, Brillouin scattering permits coupling to multiple longitudinal mode families (Ωn−1, Ωn, Ωn+1) within the Brillouin phase-matching bandwidth (dashed line), centred around the Brillouin frequency (ΩB). Hence, control of an individual phonon mode requires new strategies to suppress scattering to unwanted phonon modes.
Selective coupling to a single-phonon mode was achieved using phase matching in conjunction with mode matching and spectral filtering within the cavity optomechanical system. By designing the optical cavity to have a linewidth (κ/2π ≈ 4 MHz) smaller than the acoustic FSR (~6 MHz), we used the spectral filtering from the optical cavity to effectively restrict the coupling to an individual mode family. However, the use of this triply resonant coupling scheme necessitated matching of the cavity mode spacing (ω2 − ω1) to the frequency of the Brillouin-active phonon mode (Ωn) with very high precision (<1 MHz). The optical cavity mode spacing was adjusted to match the frequency of the fundamental Gaussian mode of interest using piezo-actuation of the cavity length (see Supplementary Information Sections I A and III for details). When the resonance condition (ω2 − ω1 = Ωn) was met, this system yielded an optomechanically induced transparency (OMIT) spectrum of the type sketched in Fig. 1i (refs. 1,43).
The experimental OMIT spectra of Fig. 1j–m were obtained by resonantly pumping the red mode (ω1) with the control laser while a probe tone, generated by intensity modulation of the control laser, was swept through the blue cavity mode (ω2) to perform a transmission measurement. Pound–Drever–Hall locking was used to precisely align the control laser frequency to the red mode while the transmitted probe light was measured using heterodyne detection using the apparatus of Fig. 1e (see Supplementary Information Section I B for further details). The OMIT spectrum of Fig. 1m shows that spectral filtering by the cavity mode greatly suppressed coupling to other mode families, revealing an individual OMIT dip (or dips) centred at the frequency of the optical resonance. However, high-resolution measurements of the OMIT spectrum reveal coupling to the fundamental (L0) as well as unwanted higher-order spatial modes (L1, L2, L3) within a given mode family (Fig. 1j).
To minimize coupling to higher-order acoustic modes, we precisely matched the optical and acoustic field distributions, allowing mode-selective coupling to the fundamental (L0) Gaussian mode. Using an optical cavity length of 12 mm and a 15-mm mirror radius of curvature, we realized a fundamental optical mode with an intensity waist radius (39 μm), closely matching that of the μHBAR acoustic field amplitude (31 μm), as necessary to selectively couple to the fundamental (L0) Gaussian phonon mode. To precisely align the μHBAR within the optical FP resonator for optimal coupling, the crystal was mounted on a flexure stage that permitted fine tuning of the μHBAR position (see Supplementary Information Section II A for details). As seen from Fig. 1k,l, precise trimming of the μHBAR position to optimize the transverse alignment of optical and acoustic modes led to a substantial reduction in coupling to higher-order acoustic modes. In the case of optimal alignment (Fig. 1l,m), efficient coupling to the fundamental Gaussian mode at 12.607 GHz was achieved, with >20 dB of suppression of all other acoustic resonances, enabling single-mode quantum control.
Note that the position of the μHBAR affects the spectrum of the optical cavity modes during this alignment process. Hence, following the repositioning of the μHBAR, a pair of optical modes at a slightly different wavelength fulfils the condition for resonant coupling. Because the Brillouin frequency is wavelength dependent, the exact frequency of the phonon modes observed in the OMIT spectra of Fig. 1j–m also varied slightly with each alignment. For this reason, the OMIT spectra are presented as functions of detuning from the fundamental acoustic mode of the relevant mode family (Supplementary Information Section II B).
Ground-state cooling of μHBAR phonons
In what follows, we use this cavity optomechanical system to perform ground-state cooling. We begin by introducing the system Hamiltonian and key quantities to describe the cooling process. In the case of optimized single-mode coupling, the interaction Hamiltonian for our system becomes \({{\mathcal{H}}}_{{\rm{int}}}=-\hslash {g}_{0}({\hat{a}}_{1}{\hat{a}}_{2}^{\dagger }{\hat{b}}_{n}+{\hat{a}}_{1}^{\dagger }{\hat{a}}_{2}{\hat{b}}_{n}^{\dagger })\) in the rotating wave approximation43. Here ℏ is Plank’s constant, \({\hat{a}}_{1}\) (\({\hat{a}}_{2}\)) is the annihilation operator for the red (blue) mode with angular frequency ω1 (ω2), \({\hat{b}}_{n}\) is the annihilation operator phonon mode with angular frequency Ωn and g0 is the single-photon coupling rate for resonant intermodal scattering produced by an individual μHBAR phonon mode43.
Resonant pumping of this system produces the familiar beam splitter and squeezing Hamiltonians. When pumping the red mode, the substitution \({\hat{a}}_{1}\,\to \,{\alpha }_{1}\) yields a linearized beam-splitter Hamiltonian of the form \({{\mathcal{H}}}_{{\rm{B.S.}}}\,=\,-\hslash \widetilde{g}({\hat{a}}_{2}^{\dagger }{\hat{b}}_{n}+{\hat{a}}_{2}{\hat{b}}_{n}^{\dagger })\), where \(\widetilde{g}={g}_{0}{\alpha }_{1}\) is the effective coupling rate and α1 is the amplitude of the coherent state in mode \({\hat{a}}_{1}\). Similarly, when pumping the blue mode, the substitution \({\hat{a}}_{2}\to {\alpha }_{2}\) yields a squeezing Hamiltonian of the form \({{\mathcal{H}}}_{{\rm{Sq.}}}=-\hslash \widetilde{g}({\hat{a}}_{1}{\hat{b}}_{n}+{\hat{a}}_{1}^{\dagger }{\hat{b}}_{n}^{\dagger })\), where \(\widetilde{g}={g}_{0}{\alpha }_{2}\) is the effective coupling rate and α2 is the amplitude of the coherent state in mode \({\hat{a}}_{2}\). The cooperativity for this optomechanical system is \(C=4| \widetilde{g}{| }^{2}/({\varGamma }_{0}\kappa )=4| {g}_{0}{| }^{2}| \alpha {| }^{2}/({\varGamma }_{0}\kappa )\), where ∣α∣2 is the intracavity photon number (nc) produced through resonant pumping43. Hence, resonant enhancement of the photon number (nc) enables much larger effective coupling rates (\(\tilde{g}\)) and cooperativities than are feasible using conventional sideband-resolved optomechanical pumping schemes1,31,43.
To quantify the coupling rate (g0) and the fundamental linewidth of the phonon mode (Γ0) within our cavity optomechanical system, we began by performing power-dependent OMIT and optomechanically induced amplification (OMIA) measurements. The OMIT (OMIA) spectra of Fig. 2a,b were obtained by resonantly pumping the red (blue) mode with the control laser while a probe tone, generated by intensity modulation of the control laser, was swept through the blue (red) cavity mode at frequency ω2 (ω1) to perform transmission measurements; during such measurements the non-resonant, lower (higher) sideband generated by the modulator had negligible impact, as it was rejected by the optical cavity. As before, Pound–Drever–Hall locking was used to ensure that the control laser remained on resonance with the appropriate cavity mode during each measurement. The transmitted optical carrier and probe tone were collected by a collimator and combined with a fixed, frequency-shifted local oscillator (LO) to enable heterodyne measurement of the transmitted probe-wave.
Fig. 2: OMIT and OMIA measurements.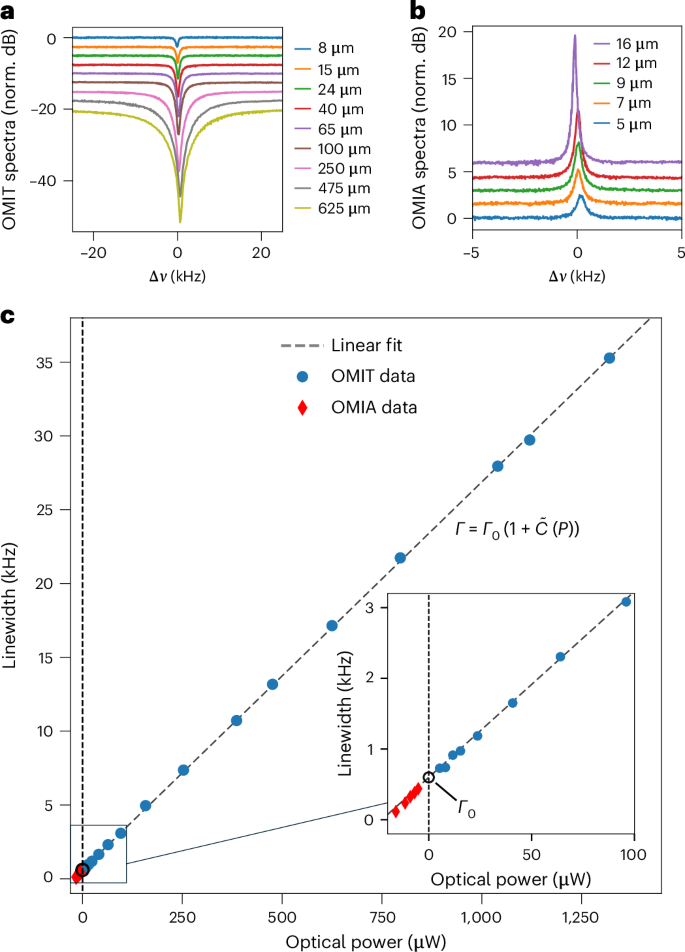
a, OMIT traces for several transmitted optical power levels showing broadening of the OMIT dip with increased power (each trace is artificially offset by 2.5 dB for better visibility). b, OMIA traces for several transmitted optical power levels showing narrowing of the OMIA peak with increased power (each trace is artificially offset by 1.5 dB for better visibility). c, Each OMIT (OMIA) trace was fitted to a Lorentzian and the evaluated linewidths are plotted as a function of transmitted power in blue circles (red diamonds). OMIA data is reflected to negative powers to enable single linear fit (dashed line) of the entire dataset. Inset: magnified view of the low-power-levels region. The black circle marks the fitted fundamental linewidth Γ0 = 2π × 600 Hz.
Next, we analysed these data to extract the parameters of the optomechanical system. OMIT measurements taken at control laser powers between 7 μW and 1.3 mW are shown in Fig. 2a. The optical power for each trace was measured in transmission to ensure that it is representative of the intracavity photon number (see Supplementary Information Section V for further details). Figure 2b shows measured OMIA traces for a series of transmitted control laser power levels below C = 1, which marks the onset of optomechanical self-oscillation.
To extract the effective damping rate of the phonon mode at each optical power, we first fitted these experimental traces to the Lorenzian form predicted from the OMIT and OMIA response, yielding the data seen in Fig. 2c. We then fitted these extracted power-dependent linewidths to the theoretical damping rates given by Γ±(C) = Γ0 ± Γopt = Γ0(1 ± C) predicted for OMIT (Γ+(C)) and OMIA (Γ−(C))1,43. Because C is proportional to the intracavity photon number, Γ+(C) (Γ−(C)) increases (decreases) linearly with optical power for the case of OMIT (OMIA) measurements. To enable a single linear fit for the entire dataset, the OMIA data was reflected to negative power levels, as seen in Fig. 2c. The linear fits of the data reveal a fundamental linewidth of Γ0 = 2π × 600 (±30) Hz. Unity cooperativity (C = 1) was achieved at transmitted power level of 22.8 ± 1.2 μW, corresponding to a single-photon coupling rate of g0 = 6.08 ± 0.03 Hz. Hence, mode-selective coupling to the high-Q-factor μHBAR phonon modes permitted us to achieve C = 1 with optical powers that are orders of magnitude smaller than those required in previous studies31. (For a complementary dataset demonstrating unity cooperativity at 11 μW transmitted power levels, see Supplementary Information Section VIII.)
To perform laser cooling, we resonantly pumped the red mode (ω1) with the control laser while measuring the spontaneous AS light emitted from the blue mode (ω2); during these measurements, the probe tone was turned off. The frequency-shifted optical local oscillator was combined with the transmitted light to perform heterodyne spectral measurement of spontaneously scattered AS light. These spectra were acquired using a high-speed photodetector and an electrical spectrum analyser. The optical local oscillator was amplified and passed through a high-rejection narrow-bandwidth filter to enable a shot-noise limited detection. Figure 3a–c shows examples of spontaneously measured AS spectra with increasing control laser powers of 24 mW, 386 mW and 1.3 mW, respectively; each trace is averaged over 4,000 acquisitions. The traces were fitted to Lorentzian lineshapes (dashed red lines) from which the linewidths and areas (shaded red) were extracted. For increasing optical powers, the AS linewidth broadens in a manner that is consistent with increasing optical damping of the phonon mode; these measurements also show a change in the peak brightness of the AS Lorenzian spectrum that is consistent with a reduction in phonon population (Supplementary Information Section IV). The complete dataset of spontaneous AS spectra can be found in Supplementary Information Section VIII.
Fig. 3: Laser cooling measurements.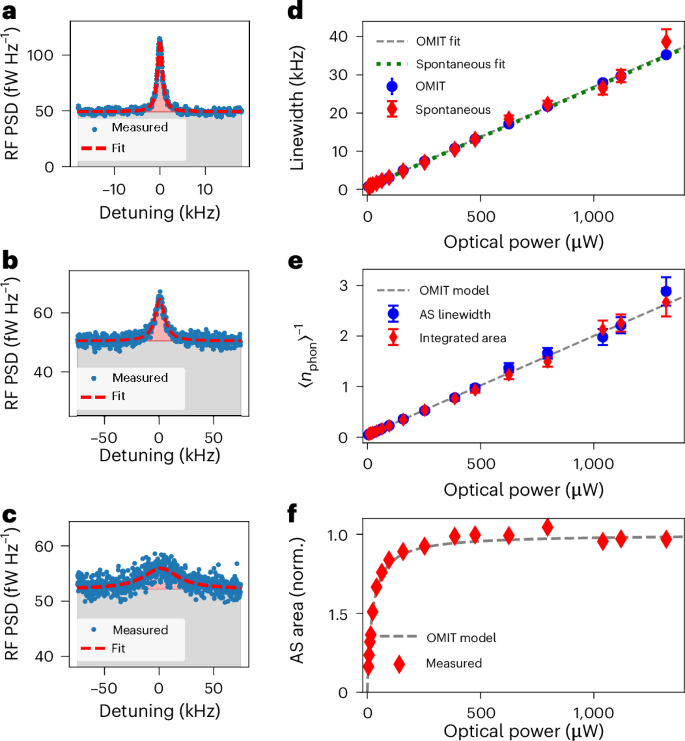
a–c, Spontaneous measurements of the RF power spectral density (PSD) of the heterodyne-detected AS light scattered by the cooling process for growing control power levels of 24 mW (a), 386 mW (b) and 1.3 mW (c). The measured traces (blue) were averaged over 4,000 acquisitions and fitted to Lorentzians (red dashed line), and the extracted linewidths and areas (shaded red) were used to evaluate the cooled phonon population. The background levels (shaded grey) match the expected increase due to shot noise and show no notable heating of the mode by the control laser (Supplementary Information Sections IV and VII). More spontaneous AS cooling traces can be found in Supplementary Information Section VIII. d, Extracted Lorentzian linewidths of spontaneous measurements for different control powers (red diamonds) show excellent agreement with the linear fit and the OMIT measurements (blue circles). Error bars denote standard deviation of linewidth obtained by a Lorentzian fit. e, Starting from 〈n〉 = nth, the actively cooled steady-state phonon population was deduced from the measured linewidth (blue circles) and area (red diamonds) of each trace. Calculations yield values in good agreement with the analytical model (grey dashed line). The lowest phonon population for transmitted power of 1.3 mW was 〈n〉 ≈ 0.36 phonons. Error bars denote standard deviation of the phonon population estimation for each calculation method. f, Measured (diamonds) normalized areas of the AS traces show good agreement with the OMIT-based model of \(\tilde{C}(P)/(1+\tilde{C}(P))\).
Using these spectra, in conjunction with the measured parameters of the cavity optomechanical system, we quantified the reduction in the phonon population produced by laser cooling. The linewidths extracted from the AS spectra after accounting for the spectrum analyser detection bandwidth (diamonds) are plotted in Fig. 3d, demonstrating consistency with those extracted from OMIT measurement (circles) at each power level. The area of the Lorenzian AS resonance, which is proportional to the emitted AS photon flux, also follows the predicted \(\tilde{C}(P)/(1+\tilde{C}(P))\) dependence, as seen in Fig. 3f. Here \(\tilde{C}(P)\) is the linear fit of cooperativity as a function of transmitted power, extracted from the OMIT data.
Next, we used these measurements to estimate the phonon occupation number. Owing to the unique features of our system, sideband asymmetry measurements27,28,44,50,51,52 were inaccessible (Supplementary Information Section IV). Therefore, we based the thermometry measurements on the available linewidth and area of the measured AS spectra. Under the influence of the cooling laser, the phonon occupation could be expressed as 〈n(C)〉 = nth[Γ0/Γ+(C)] = nth/(1 + C) (ref. 1), where nth is the occupation of the phonon mode at thermal equilibrium. The thermal population, nth, was taken to be 22.4 for all spontaneous measurements, which is consistent with an in-situ measurement of the μHBAR temperature (13.6 K). Using Γ0 and Γ+(C) derived from OMIT and spontaneous lineshapes, respectively, we evaluated this expression to find the phonon occupation versus cooling power, as shown in Fig. 3e. We used the OMIT data, rather than the spontaneous measurements, to characterize the fundamental linewidth of the phononic mode owing to the higher confidence of the fit.
Alternatively, the phonon population could be estimated based on the AS spectrum area (that is, AS photon flux), using the expression \(\langle n(P)\rangle ={n}_{{\rm{th}}}[\tilde{{\mathcal{V}}}(P){\varGamma }_{+}(P)/4\tilde{C}(P){\varGamma }_{0}]\). Here \(\tilde{{\mathcal{V}}}(P)\) is the AS peak brightness normalized to 1 at C = 1, Γ+(P) is the measured spontaneous linewidth and \(\tilde{C}(P)\) and Γ0 are the experimentally derived cooperativity as a function of transmitted power and the fundamental linewidth, respectively, both extracted from the high confidence OMIT measurements. As seen in Fig. 3e, the estimated phonon population based on the spectral area (diamonds) shows good agreement with that from the measured linewidth (circles); these data are also consistent with the trend line (dashed) obtained by evaluating \(\langle n(P)\rangle ={n}_{{\rm{th}}}/(1+\tilde{C}(P))\) using the power dependence of the cooperativity estimated from OMIT measurements. See Supplementary Information Section IV for derivations of the above quantities and details of data analysis.
These data demonstrate laser cooling of the μHBAR to the ground state. At the highest cooling power (1.3 mW), a phonon occupation of <0.4 was reached; the phonon occupation was estimated from the AS spectra using the spectral linewidth (circles) and area (diamonds), yielding an occupation of 0.35 ± 0.034 and 0.375 ± 0.04, respectively. Although lower phonon occupation numbers are likely to be achievable, the appearance of higher-order phonon modes (L1) within the AS spectrum at powers above 1.3 mW complicated phonon occupation measurements at higher powers. Observe that agreement between the theoretical and experimental phonon occupation seen in Fig. 3e was achieved at all control powers without a correction to the bath temperature, indicating a negligible degree of absorption-induced heating through these experiments. Note that, at P = 1.3 mW, this system reached an effective quantum cooperativity of Cq = C/nth = 2.58, indicating operation in the quantum coherent regime14.
To prevent unintentional noise-induced phonon heating during these measurements, a high-rejection (60 dB) filter was used before the cavity, to suppress any spontaneous photons and reduce phase noise at 12.6-GHz offset frequencies. Estimates based on the measured laser noise levels indicate that any heating caused by residual laser noise had a negligible effect, adding fewer than 2 × 10⁻⁴ phonons to the phonon population at the maximum power levels used (see Supplementary Information Sections VI–VII for details).