
OUR long-term analysis of the Queensland cattle market, adjusted for inflation, has identified that the July average of the market was the 75th percentile of monthly prices over the last 20 years, see below graph. The equivalent July average for the EYCI was the 78th percentile.
This analysis uses monthly averages, so while the average of the market for July was the 75th percentile for Queensland, current prices are over the 80th percentile, and cows are over the 90th percentile.
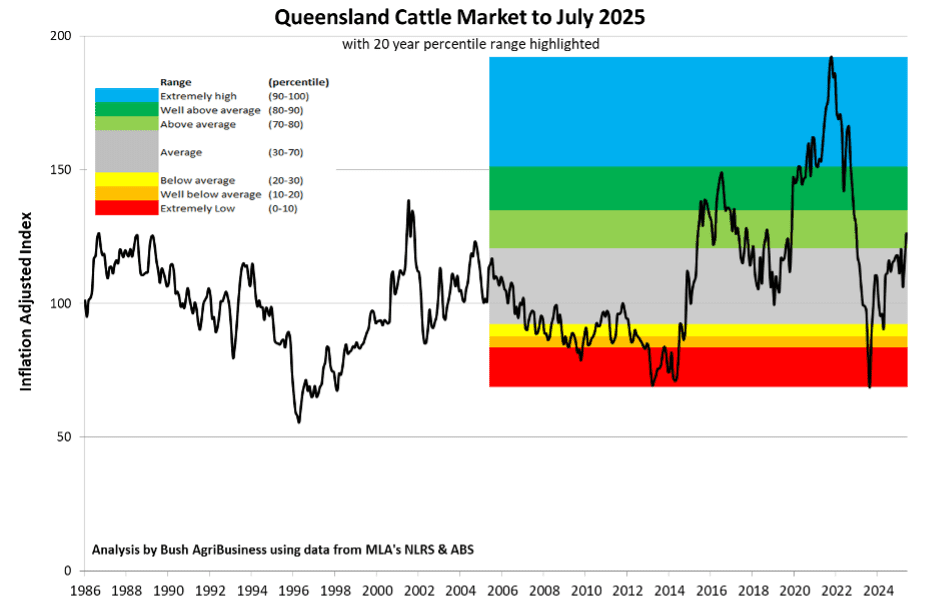
The graph shows that there has been more volatility in recent years than across the nearly 40 years of data in the analysis. It went from the highest of long-term prices in December 2021 to the lowest of the last 20years in October 2023, over just 22 months. It also shows that while current beef prices do seem high, when looked at with the effect of inflation removed, prices in July 2025 were exactly the same as they were in November 1986.
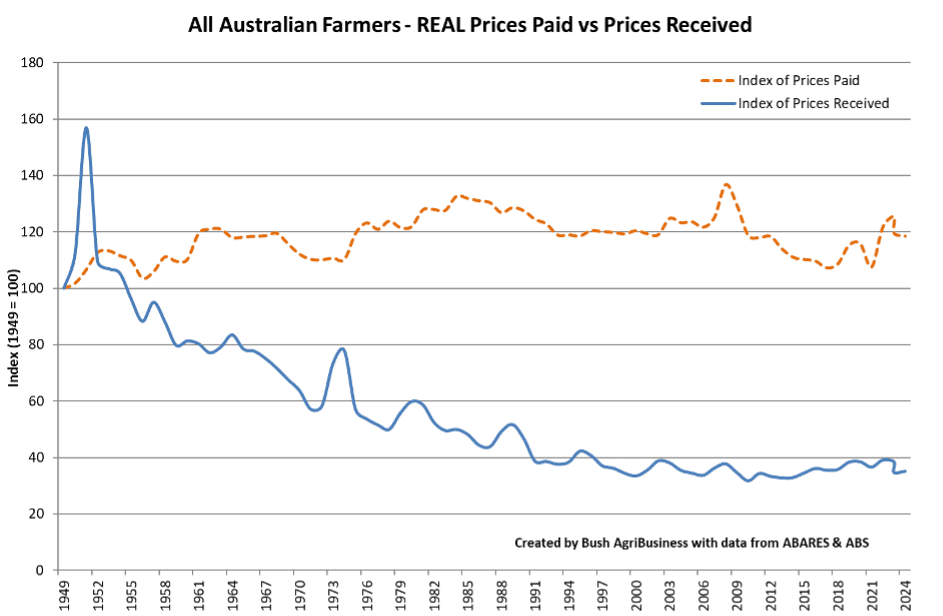
We adjust the data for inflation to express the real change in purchasing power over time, even though the relative costs of some inputs have changed, total agricultural input costs, on average, increase at the general rate of inflation in the economy. This is shown in the below graph, which graphs an index (starting at 100 in 1949) of prices paid for inputs and prices received for outputs, both in real terms, for all Australian farmers up to 2025. This shows that prices paid (input costs) have been relatively stable in real terms over time. Price received declined in real terms for the first 40 years of the data set, but have been relatively stable for the past 35yrs. The stable terms of trade (prices of input and outputs) are good news for agriculture as it means productivity gains can go straight to the bottom line, rather than being necessary to stay ahead of declining terms of trade.
Back to beef prices and the key question is what does this all mean, beyond a colourful graph? Having a historical context for current prices in real terms is important in understanding the current market. Knowing where the current market is can help with budgeting; rather than try and guess the price for each sale for the coming financial year, we suggest using price deciles. This only requires one guess, which decile the year is going to average, and whilst that is still a guess, it can be informed by the historical context and does allow you to test the impact on the budgeted outcome if different price deciles are chosen.
Below is a current price decile table for Queensland, some client budgets we’ve looked at recently have been using the 7th decile (70th percentile) for their FY26 budgeting.
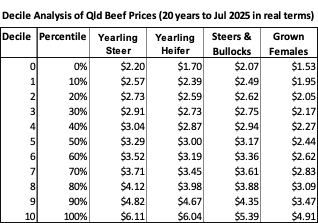
Knowing where the current market is can also help assess price risk in any trades, e.g. if you’re buying animals at 8th decile prices, you can see what selling them at different deciles will do for the economics of the trade.
Also, cow prices being in the top decile of 20yr prices presents hard to resist opportunity to cash in any that preg test outside your ideal window.
Beyond that, others may read the tea leaves and make bold predictions on the future, but all that can be said with confidence is that the market could go up, go down or stay the same, and will do all three at different times going forward.

Ian McLean, Bush Agribusiness Managing Director
It will be those beef producers that with efficient and productive beef businesses that will have the lowest cost of production and enjoy the highest margins in the future. At Bush AgriBusiness, we specialise in helping profit focussed beef producers understand and improve the efficiency and productivity of their business so as to maximise their margins through the full price cycle.