
At the end of the 2025 NRL season the Newcastle Knights had scored 338 points.
At the conclusion of Round 10, 2025 the Newcastle Knights have scored 272 points.
Not only are they only just 62 points behind last season’s full season total after just 10 games, they’ve scored more than double last year’s total at the same point of the season.
Justin Holbrook deserves significantly more credit than he’s receiving currently for the turnaround with the ball in Newcastle. It’s an incredible comeback to first grade after he was unceremoniously shown the door in 2023 by the Titans for Des Hasler. Titans CEO Steve Mitchell at the time defended the change with this statement.
“We are here to bring success to the Gold Coast and in order to do so we feel that this is the change necessary to deliver on our promise which is to win premierships.”
Spoiler: they did not.
Holbrook is still the last person to coach a Gold Coast side in the finals, and probably will be for the foreseeable future. And now he has a chance to extract revenge on his former employer this weekend at Magic Round, armed with an incredibly potent Newcastle attack.
After suffering through an incredible dire 2025 campaign, Holbook has let this young Knights side loose with the ball and the points are flowing. They scored 61 tries in total last season, this year they have 50 already.
Regular Eye Test readers will remember the below chart from last season. I would regularly update the average point scored by the 2025 Knights compared with the 2016 Knights, where there was less than a single point between their season average. This was despite the 2025 Knights playing in an inflated point scoring universe and the 2016 Knights being awful.
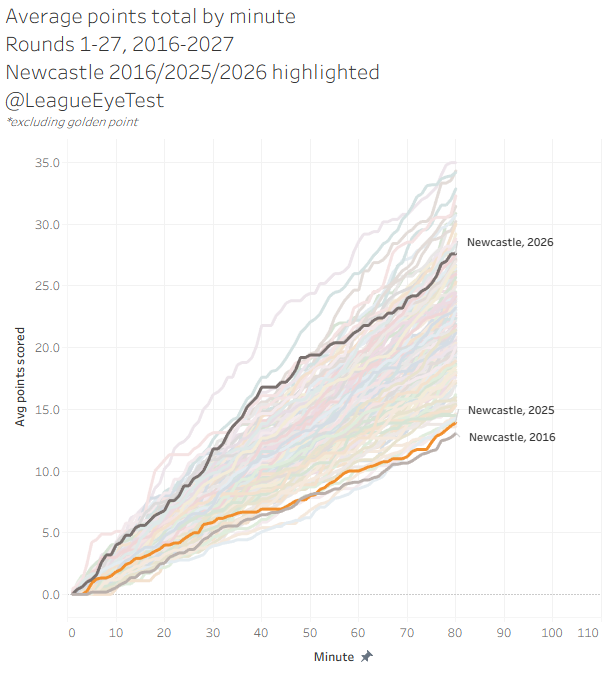
As you can see with the addition of 2026 data, the Knights are scoring substantial improvement in points per game, and up to half time they’re one of the best point scoring teams in the last decade. Of course they can’t play the Dragons every week, and you’ll lose more than you win giving up 38 to Souths. But overall, the team has improved dramatically with the ball from last season, and as usual I have the numbers to show you where.
Jason Oliver stated on Rugby League Writers after their Round 9 win over Souths that “this team looks genuinely good”, and I absolutely agree with him. I still have some reservations on them defensively which I’ll get to later. But the way Holbrook has quickly integrated Dylan Brown into their spine has resulted in an attractive attacking style of football that Knights fans may have forgotten was possible outside of the back half of the 2023 season. Oliver has Brown’s influence in their attack covered here.
The Newcastle attack has improved and unsurprisingly so have their margins. For the first time since 2020 the club is sitting on a positive margin after 10 rounds. Yes it’s only 4 points, or 0.4 per game but it’s a start.
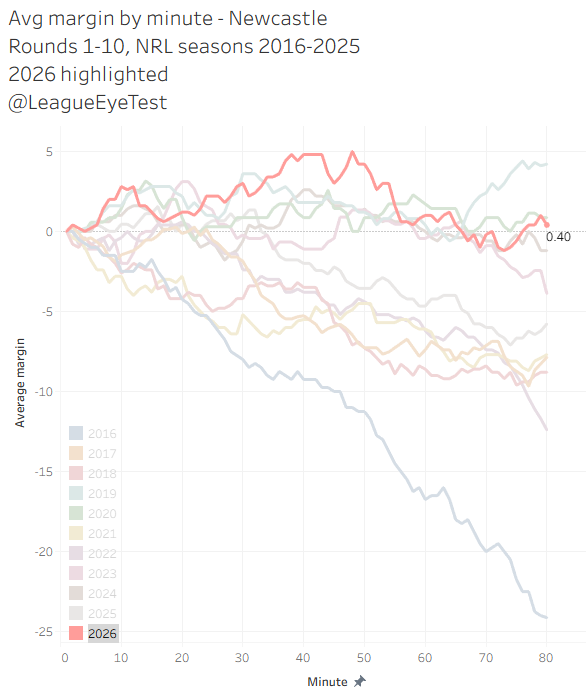
They are showing issues conceding points late in matches, as their average margin peaks right after half time at +5.0 before drifting down to +0.4. Still, it shows there is progress being made.
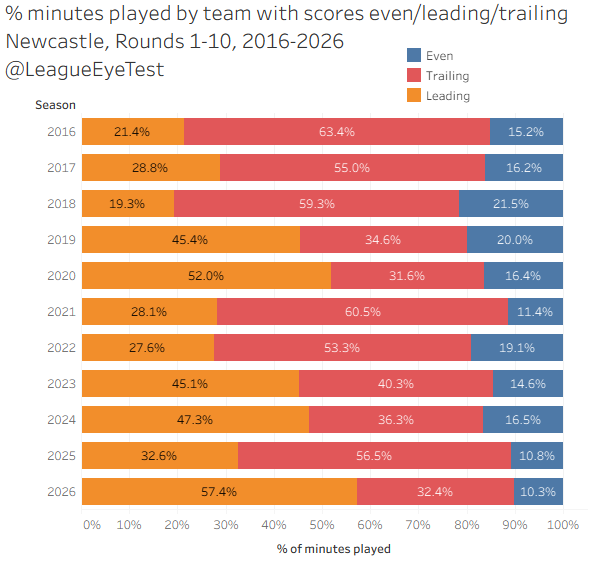
Newcastle have led for 57.4% of minutes in 2026, which ranks fourth in the NRL behind Penrith, Manly and the Warriors. That is the highest mark for the club since the Nathan Brown reign of terror in 2016, and nearly the exact inverse of 2025 where the trailed in 32.6% of minutes after 10 rounds.
If we compare the actual points scored by the Knights to their expected point average using this sites expected point model (ETxP), Holbrook has made an incredible turnaround. After 10 rounds in 2025, the Knights were dead last by this metric, at -21% against expected, when the league average was +24%.
Keep in mind that this expected point number is best thought of as a measure of field position, and the comparison to actual points is used to gauge how well they’re using their field position.
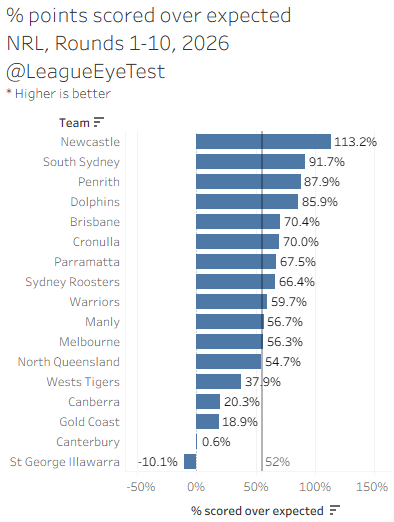
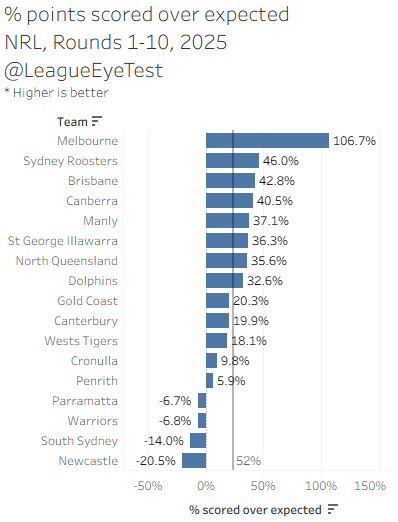
Fast forward to 2026 and the Knights are now +113%. Let that sink in. They’re better than South Sydney, Penrith, the Roosters or the Dolphins. No team is converting field position with a low expected point value into actual points better than Newcastle. And no team was worse than converting any field position into points last season than Newcastle. If Holbrook was doing this in Sydney we’d be hearing significantly more about it. They’ve won more games than either Manly or the Tigers, and done so in style.
Thank you for reading The Rugby League Eye Test. Subscribe below to receive new posts in your inbox and support independent rugby league content.
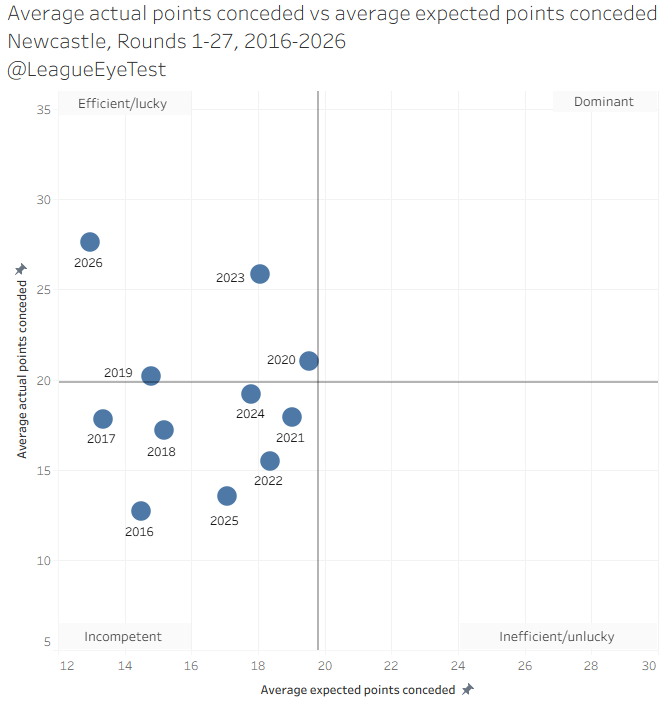
When comparing average expected points against average points conceded, after a decade of sitting in the incompetent quadrant of my efficiency charts, they’re now firmly “Efficient/Lucky”, and as the season evolves that lucky tag can be removed.
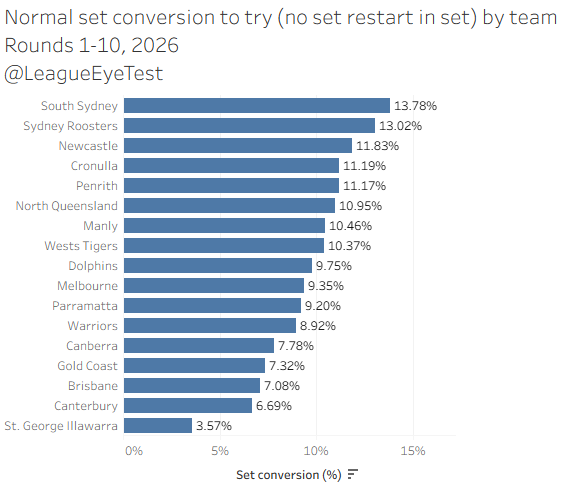
From a set conversion point of view, only the Roosters and Rabbitohs have a better percentage of traditional sets (without a set restart) converting to tries at 11.8% than Newcastle this season.
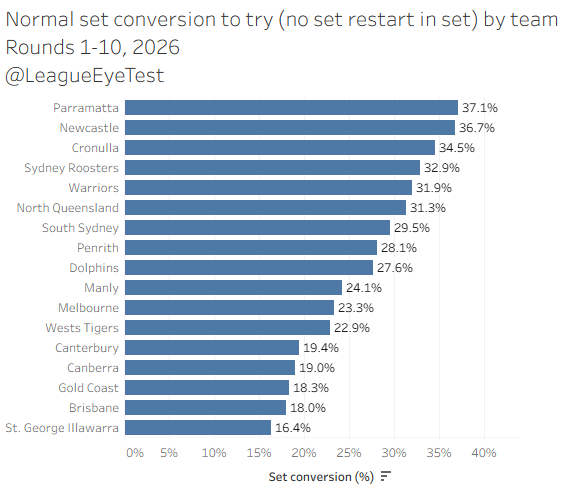
However, if you split that into halves, they’re second in the NRL from their own half at 7.6% and 36.7% starting in an opponents’ half. Souths are good starting in their own half, but not past half way. The Roosters are great starting in opponents’ halves, but slightly less so from their own. Newcastle, are elite in both.
Newcastle aren’t as strong converting adjusted sets, or those including a set restart (which increase the probability scoring a try by 2.4x), where they rank 12 in the competition. They are much better from their own half with a set restart, where they rank 7th, which may indicating they need a bit of a runway to work with.
How efficient they are can be seen by not needing long strings of possession to create points. Their average consecutive play the balls is just 3.04, the lowest in the NRL, while their percentage of consecutive play the balls above eight is the second lowest at 5.28%.
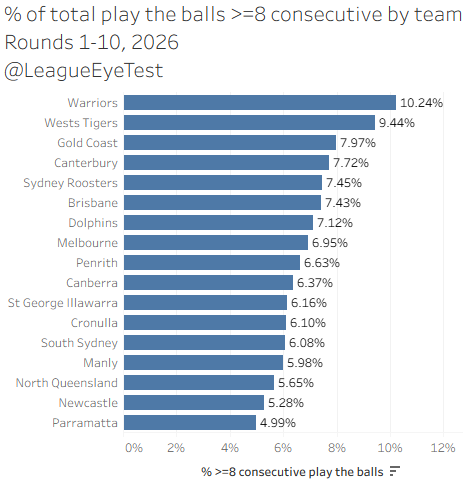
For converting these long strings of play the balls, only Canterbury, Gold Coast and Cronulla have scored fewer tries this season from a string of eight or more consecutive play the balls. For a team that has scored 50 of them, that’s incredibly impressive that so few of them need long phases of play.
It doesn’t just stop here. Newcastle leads the league in tries scored from their own half (11) , and have the second longest distance from the start of a play to a try in the NRL this season.
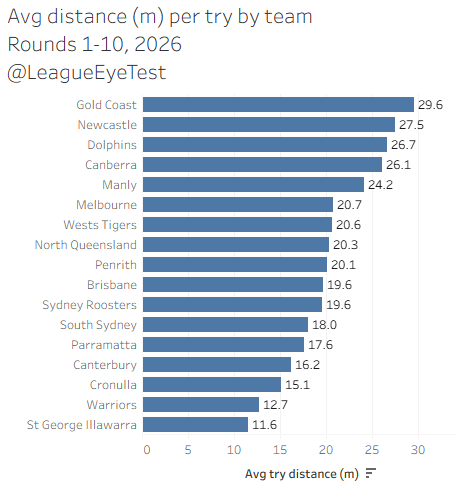
That 27.5 metres is more than ten metres more than the same time last year and the only time since 2016 that Newcastle has been above 20 metres after 10 rounds since 2016.
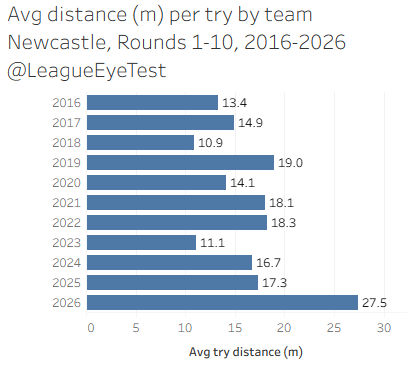
The Newcastle Knights with a modern rugby league attacking style? In this economy?
Coincidentally, there are two sides without a try starting from their own half this season. One of them are the Dragons, and the other is Canterbury. Draw your own conclusions here.
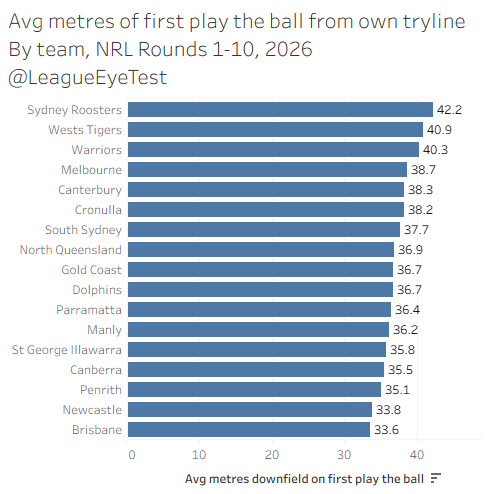
Even more impressive in their attack is that they have the second worst starting position for a set in the NRL. At just 33.8 metres out, they’re only ahead of Brisbane.
The main reason they can combat this is that their back three this season has generated over 31% of their total running metres. Both Greg Marzhew (11.3% of team metres, 7th in the NRL) and Dom Young (10.5%, 18th) are a part of that, and Kayln Ponga ranks inside the top 50 as well. They need their contributions because the Knights middles & interchange players only contribute one third of their total metres, which ranks them 13th.
One obvious change Holbrook has made is that the team is playing wider, again a sign of playing a more modern style of football. Their percentage of play the balls outside the middle third of the field is 47.6%, which ranks third behind South Sydney and Manly. It’s also 5% higher than last season under Adam O’Brien, and almost 10% higher than any of his previous seasons which were all under 40%.
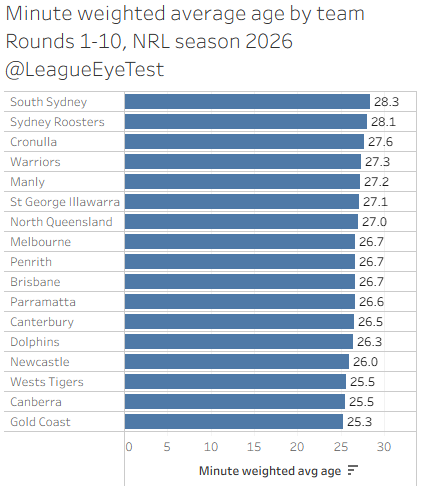
The impressive part of all of this is that the club has the fourth lowest minute weighted average age in the NRL this season, at 26.0 years. Only the Titans, Tigers and Raiders have younger players logging significant minutes.
It’s not all positives, as the defense has definitely taken a step back under Holbrook, which was one area of concern during his time at the Gold Coast. One of the reasons the Knights were still competitive under O’Brien is that their defense was structurally sound for most of his tenure, and were only conceding 19.3 points per game up to round 10 in 2025. However, it’s no good holding teams to less than 20 points per game if you can’t score more than 10 yourself.
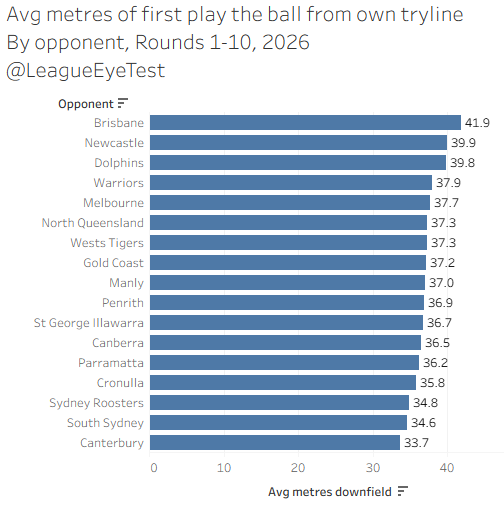
A reason for their defense taking a hit is that their kick chase needs to improve. Opponents are playing the ball on tackle one almost 40 metres from their own line, 16th in the competition.
It extends to their defense on subsequent tackles as well. For the following tackles during a set, the Knights rank 14th, 14th, 15th and 16th for meters past the play the ball. It’s all you an eat metres against Newcastle this season. As a result, 22% of their opponent play the balls are occurring inside their own 20 metre zone, again 16th in the competition and one of just three teams above 20%.
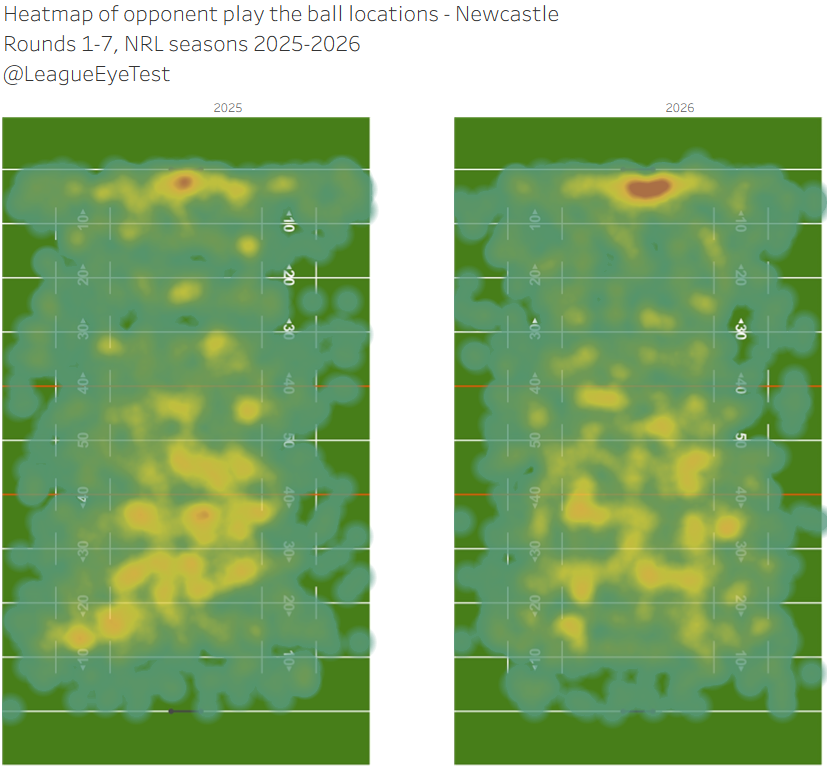
A heat map of their opponent play the balls comparing this season and last season shows how there are too many play the balls around the sticks, something O’Brien’s defensive systems limited.
This is evident when looking at how often their a defensive set results in a try. Newcastle’s defensive set conversions overall are mid table. When you filter down to opponent sets started in their half of the field, things look a lot worse.
Newcastle are giving up a try on slightly over a third of normal sets started past halfway, second worst in the competition behind Parramatta.
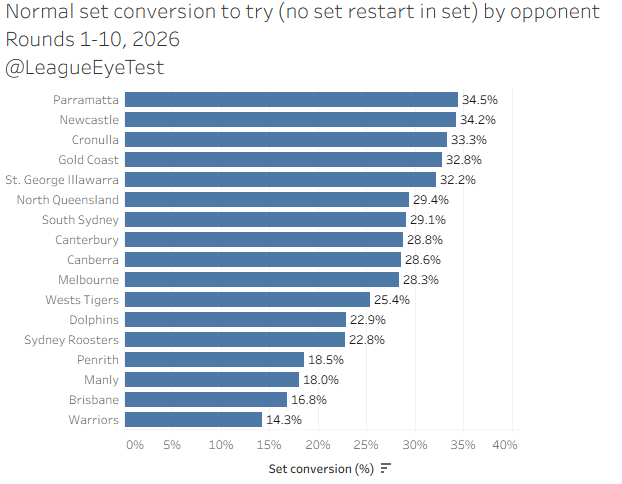
For adjusted sets (including a set restart), Newcastle only concede at try at a slightly higher rate – 36% instead of 33%. This may indicate that their defensive line strengthens as they defend more plays, and that their normal set conversion could improve as defensive combinations spend more minutes together.
The speed at which Holbrook has successfully revamped Newcastle’s attack, and integrated Dylan Brown into a position he wasn’t familiar with, should be appreciated by a wider audience. No longer are their fans having to sit through predicable and dour attacking structures, and hoping their side can grind out an 18-14 victory. Like with Manly, the success of the current coach brings into question the performance of the man preceding them.
Newcastle may not be a great team (yet), but under Holbrook’s direction they’re quite clearly good. Maybe even very good. With the age profile of the squad there’s a clear trajectory for that improvement to continue, even if it’s like the Wests Tigers this season and unlikely to occur linearly. For Knights fans who lived through the dark ages of the late 2010s and the great point rationing of 2025, that’s probably enough for now.
—
The Rugby League Eye Test produces artisan small batch rugby league analysis that you can’t get anywhere else. In an era of low effort AI slop, the Eye Test offers hand crafted data and independent analysis that you can trust came from a human brain.
This sort of quality workmanship takes time and effort. Quality independent, ad-free rugby league content doesn’t exist without support from readers and the community. The Rugby League Eye Test operates under a value for value model.
If you’ve enjoyed this post, and are in a position to do so, then you can donate an amount of your choice through the PayPal link below, the Kofi page, or through the support page on the site’s menu. You can decide the level of contribution based on the value you believe the Eye Test provides to you.
Support The Rugby League Eye Test
For those of you in areas (such as New Zealand) where there’s issues with PayPal donations for some reason, I’ve set up a Kofi page as well for donations.
If you’re not in a position to donate financially, you can still support the site by sharing this post with others who might enjoy it. Support and promote independent rugby league content.