
This week I’m crossing another piece of analysis of the bucket list. For a while I’ve wanted to look at attacking kicks and the outcomes from them.
Some questions I wanted to answer were:
How often are attacking kicks converted into tries?
What is the best place to take an attacking kick from?
Where is the best place to aim a kick for?
Should you kick from closer to the line? Or from closer to the sideline than the middle?
Are there areas of the field that yield better conversion to tries than others? Does kicking early yield better results?
And it turns out I have the answer to these questions now. Before the answers here’s how I arrived at these results.
To get to the bottom of it, I’ve taken the data on every kick inside 40 metres from the NRL since 2020 and looked at whether or not it resulted in a try directly following the kick. This could be either from the attacking player scoring directly, or the defensive player making a mistake defusing the kick and the attacking team scoring from that mistake.
There will be some extreme edge cases that probably aren’t covered by this, so as usual there is the disclaimer that this is for information purposes only and there may or may not be errors here. It will cover 99.99% of kicks and their outcomes and those edge cases aren’t going to change the results.
Now I have explained how the data is being used, what are the answers to all of the above questions?
It depends.
Like everything in analytics, context matters. And in rugby league it matters even more given the near infinite possibilities from each play the ball. There’s no simple set starting point for a play where the variables are all controlled perfectly. Two teams kicking from the same spot on the field on the same tackle number aiming for the same end point will be dealing with 25 other players in different positions, moving different directions at different speeds.
Part of the “it depends” comes down to team selections, structures and their opponent. If you have Daniel Tupou and Mark Nawaqanitawase on your team, then you’ll kick the ball to them more often, especially if the opponent has smaller wingers. If your side consists of smaller, faster wingers, shifting the ball is probably a better option than trying to create an aerial contest.
Another part of the “it depends”, is that not every kick inside 40 metres is always going be taken with the aim of scoring a try.
Sometimes these kicks are taken purely to pin a team down in their corner and play the possession game. Other times they’re just trying to put a defender under pressure from a high ball and force a mistake. Or a ball is dribbled into the in goal area with the hope of getting a repeat set.
Given this, I’ve looked at not only how far out the kick was taken, but where the end of the kick was as well and how far it traveled.
Since the start of the 2020 season, a try is scored from an attacking kick (taken inside 40 metres) on 8.9% of attempts. This is coming from an average of 20 attacking kicks per game.
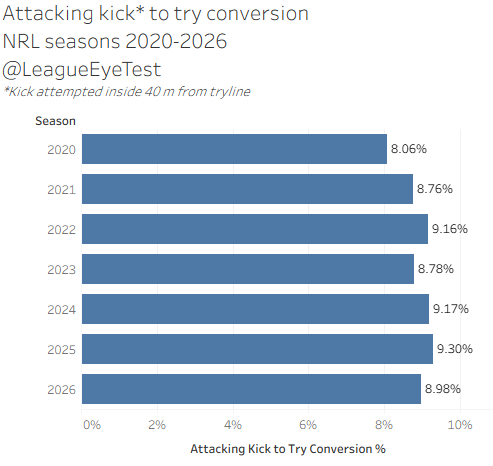
By season this doesn’t change dramatically, although 2026 has dropped slightly on 2025, possibly due to the threat of a disruptor penalty, which may or may not be thing depending on the day of the week. The number of kicks per game has dropped by about one attempt since the start of the decade.
As for how close to the line, as is the case with play the balls, the closer to the line you take the kick from the more likely you are to score.
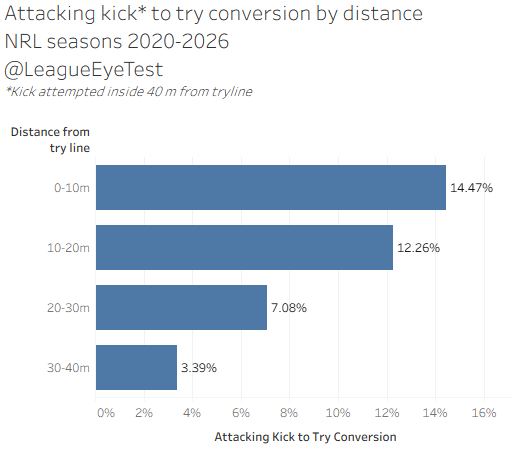
Kicks starting from 30-40 metres out convert 3.4% into tries, those starting 20-30 metres out convert 7.1%, 10-20 metres out score a try 12.2% of the time and inside 10 metres increases again to 14.5%.
There interesting part of these numbers is that by far the biggest volume of kicks comes from outside the ten metre zone. 29% come from 30-40 metres out, 22.3% come from 20-30 metres out and 34.1% come from 10-20 metres out. Just 14.6% of kicks are taken within ten metres of the line.
All of this makes sense, especially when you take into account the intent of a kick is not always to produce a try.
Thank you for reading The Rugby League Eye Test. Subscribe below to receive new posts in your inbox and support independent rugby league content.
How about width then? Does that play a part in conversion? Not particularly. The three charts below show the volume of kicks, volume of tries and conversion of kicks to tries by width of the field.
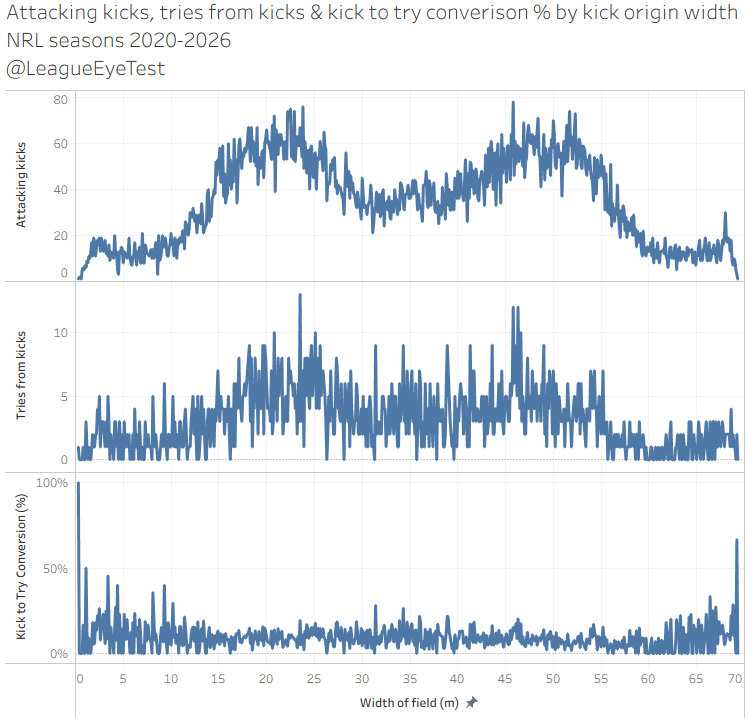
The majority of kicks are taken from around the tramlines, then the middle of the of the field with kicks from the far edge taking up a small proportion of attempts.
But the conversion of these attempts is relatively steady across the field, until you get to the those far edges where it fluctuates more.
If we look at the end point of these kicks it tells a different but similar story.
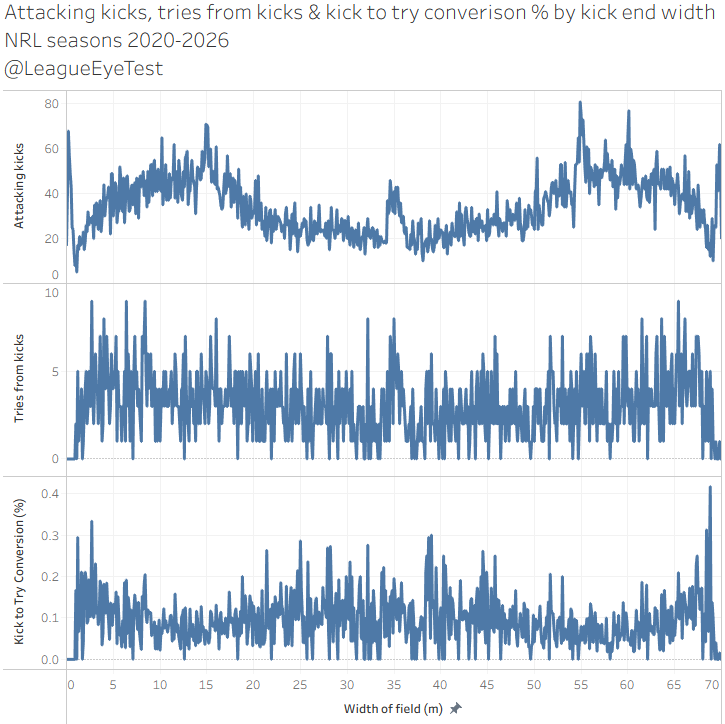
Most kicks end points are aimed outside of the tramlines on either side of the field, and the distribution of tries across the field is more even given the end points. The conversion of these kicks is slightly higher in the middle of the field, lower around the tram tracks and rises again as it reaches the sidelines.
By tackle number, kicking on the last tackle results in the lowest conversion percentage at just under 7%.
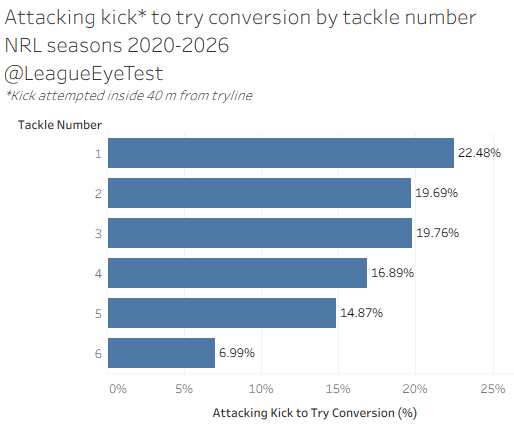
Part of that though is because 80% of kicks come on the last tackle. And for the first three tackles of a set there’s less than 500 attacking kick attempts for each one. It’s not until you hit tackles four and five that you get a useful sample size.
There might be an element of surprise in early kicks providing better returns, but the more likely answer is that these early tackles presented a better kicking opportunity.
I don’t think any of this is revolutionary information and tracks with what you’d see watching games. That’s not to say it isn’t useful information, and it’s another chance for me to bust out the saying that analytics is “the art of being less wrong”.
That’s not to say there isn’t some interesting information here though. As noted above there’s a disconnect between where the conversion of tries happens (usually closer to the line) with where the majority of kicks are taken (further away).
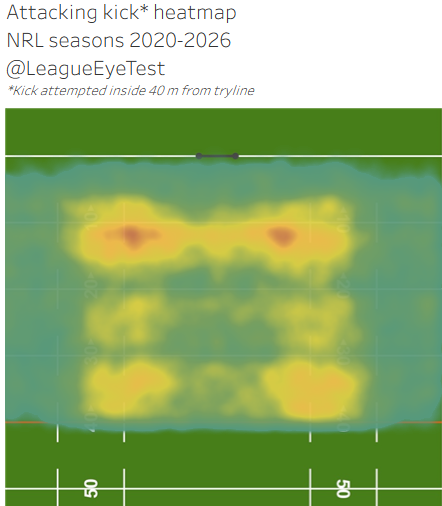
Here is a heat map of attacking kick locations since 2020. You can see the three main areas where kicks are started from by distance from the line, and most of them occur around the tram lines. Nothing unexpected here.
Now here’s the same heat map again, but only for kicks that resulted in tries. I’m sure you’ll instantly see the difference.
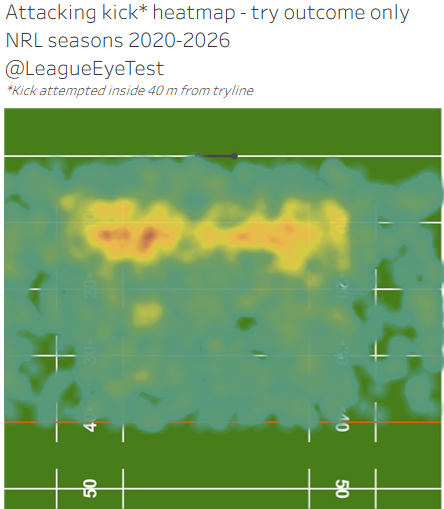
The highest density is around 10-15 meters out, and the intensity exists between the tram lines other than a spot in front the left upright, not just centred around them. Again this speaks to the intent of a kick, as more of the deeper kicks aren’t taken with the pure intent of scoring at try.
Where the really interesting results come from though is looking at the end of the kick. Here’s another heat map, showing the end of each of these attacking kicks since 2020.
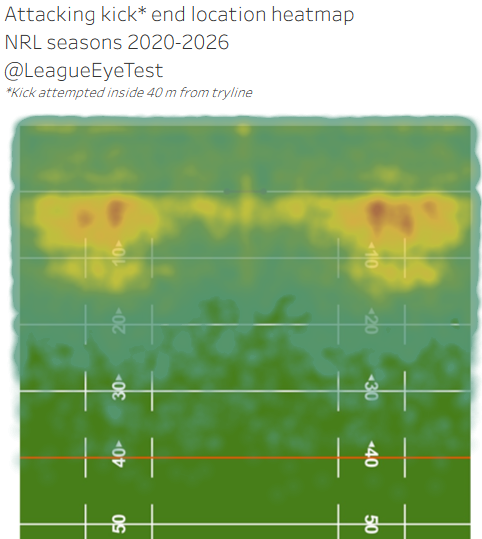
Another chart that probably doesn’t seem that out of the ordinary. The vast majority of these are aimed at the corners or outside the tramlines before the try line. There’s some aimed for the in goal area but not many, which makes perfect sense because you don’t want to give up the threat of a seven tackle set. Or giving away a penalty by tackling a player in the air whilst fielding a kick, which I’d written about this when the change happened.
If we look at the end location of these kicks that were turned into tries, there’s a sizable portion of them occurring over the try line.
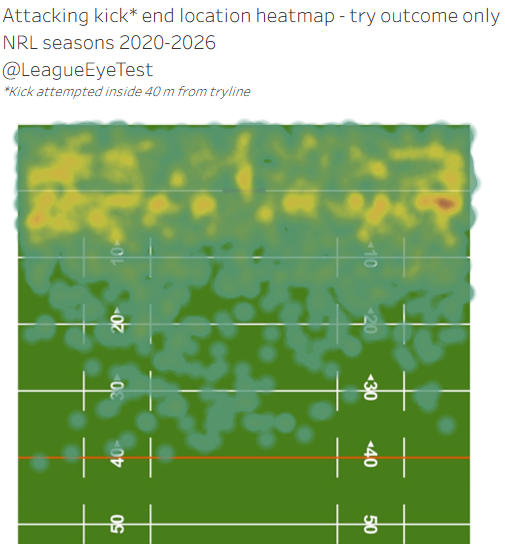
Nearly 40% of attacking kicks that result in a try have an end point inside the in goal area. But only 23.5% of kicks are aimed past the try line. This shows some inefficiency if your intent is to score a try. By aiming everything short of the line and trying to force a mistake or pin a team down on their own line, you’re removing two fifths of the chance of scoring a try.
Circling back to the original answer of “it depends”, I’m hoping it’s clear now why the answers are very fluid and there’s not a one size fits all approach.
A team like the Roosters will try to create those aerial contests over the try line because of the abilities of their wingers. A conservative team that doesn’t back their ability to contain yardage may be happy to let a team catch an uncontested kick in the corner and make their opponent travel as far as possible on that set. Or there’s teams that just refuse to contest a kick at all in. On a related note I hope Warren Smith is doing well.
It also goes back to tackle volumes not being a great indicator of defensive ability (although they are of effort). You don’t run at players who are good defenders. Similarly, teams won’t kick to players or teams who are good at fielding attacking kicks.
To finish up this week, I’ve got a few team specific charts. The first one I had thought of a long time ago, wanting to show the average attacking kick location of each team this season.
It turns out that kick locations are somewhat homogeneous.
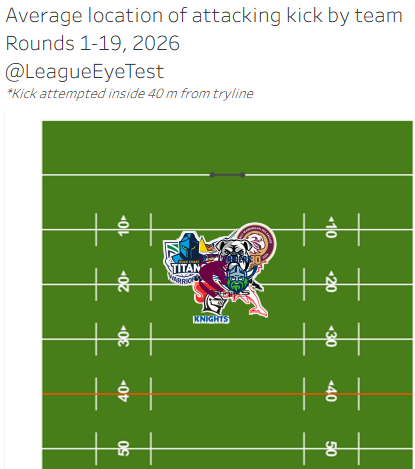
Yes, there are 17 club logos almost all on the same spot.
Instead I decided to look at just the kicks that resulted in tries and where they originated from. Also the size of each club’s logo represents the volume of tries from kicks they’ve scored. And finally we can see some distinctions.
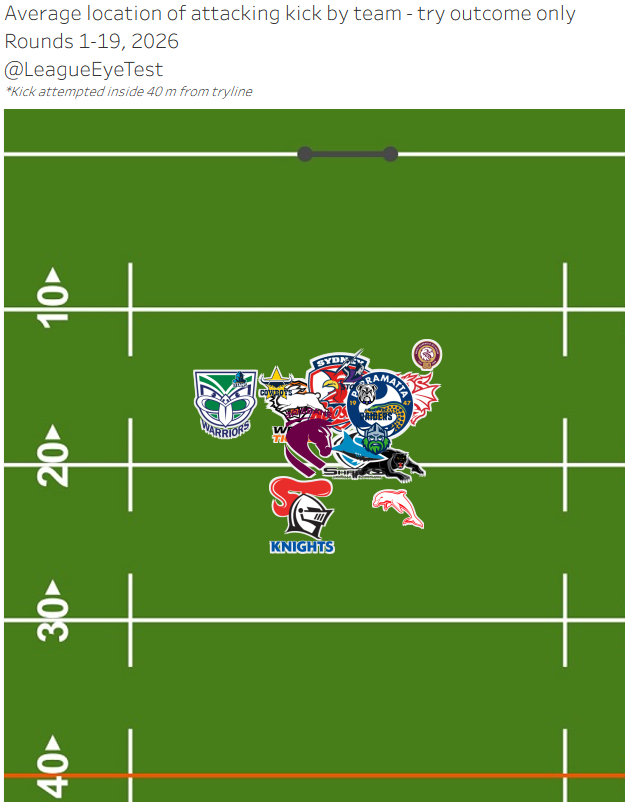
The Warriors tries tend to come from kicks from further left on the field, with Manly and the Dragons more on the right. Manly’s tries from kicks come closer to the line, whilst the Knights and Dolphins are the only teams to get more of their scores from kicks outside the red zone. The And the Titans and Bulldogs barely score any tries from kicks.
To make this somewhat clearer, I’ve plotted the average attacking kicks per game by team with their conversion of said kicks to tries. Again the size of the logo indicates the volume of tries scored (I needed to find another use for the logos).
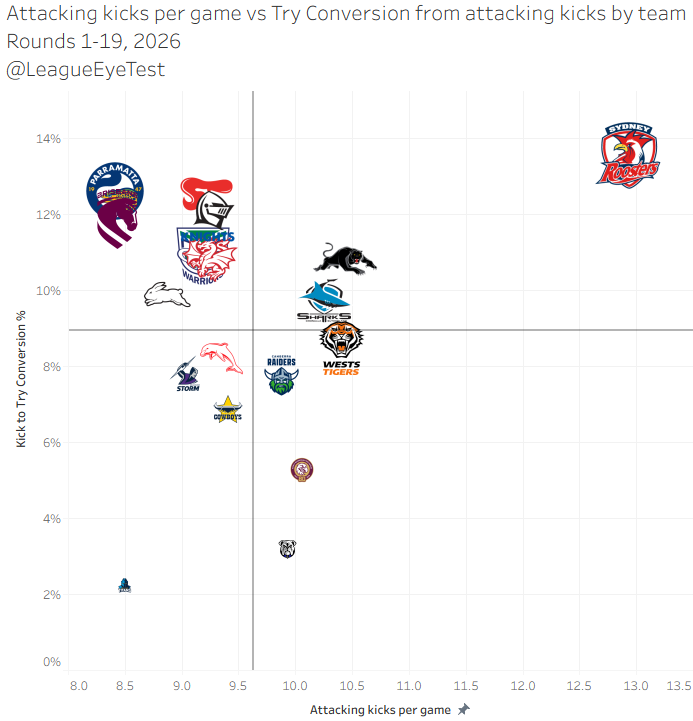
The Roosters do everything differently, with over 13 attacking kicks per game converting at almost 14%, well above league average. No other side in the NRL takes more than 10.5 attacking kicks per contest, although the Eels, Broncos and Knights do convert above 12%. If anything, the Eels and Broncos should be kicking more.
Manly, Canterbury and the Gold Coast have the lowest kick to try conversion rates, with the Titans also kicking well below league average at just 8.5 attempts inside 40.
The Bulldogs number isn’t a surprise, but what is that I have zero kicks converted to tries by Matt Burton in my data. He is averaging 2.6 attacking kicks per game in 2026, the lowest since he’s joined Canterbury and ranks 30th in attacking kicks per game.
Only Luke Brooks has taken more attacking kicks without success. Granted Lachlan Galvin is high in attempts, but not utilising the kicking weapon that Burton has is an interesting choice, and Galvin has converted just two of 91 attempts.
And of course there’s the same chart by opponent, which shows a very different set of results.
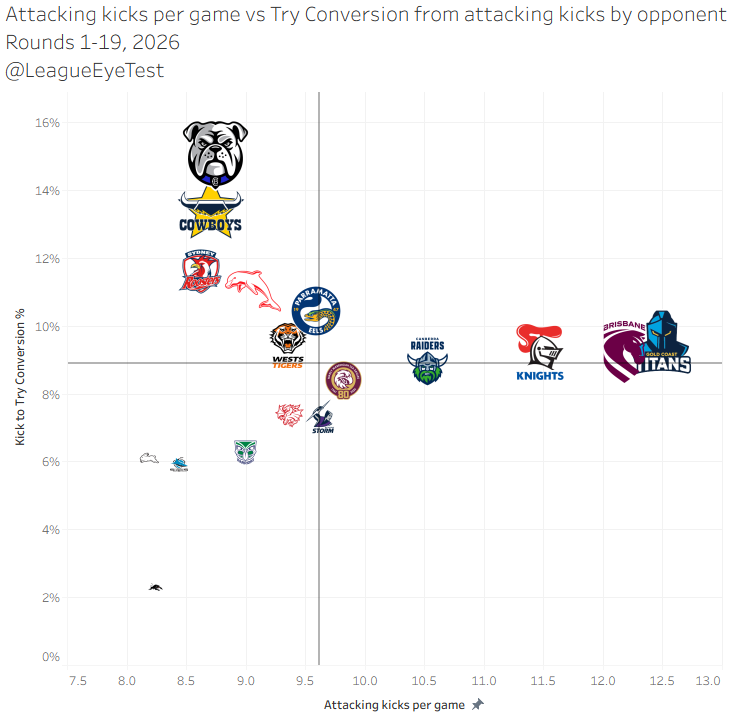
The Cowboys and Bulldogs have the biggest issues defending attacking kicks, allowing 15.0% and 13.5% of those attempts to cross the line.
No surprises that Penrith are the best at defending kicks, only letting 2.3% of them become a four pointer. There is over a 3% gap between the Panthers and the next group of teams, with South Sydney, Cronulla and the Warriors sitting around 6%.
Teams clearly fancy their chances against the Knights, Broncos and Titans, with each of these teams fielding at least 11.5 attacking kicks per contest and converting them at league average.
By volume of attacking kicks, Braydon Trindall has the most attacking kicks per game this season at 7.1, ahead of Sam Walker (6.6) of players with at least 20 kicks per game. Lowest is Blaize Talagi at just 1.6 attempts (for obvious reasons), ahead of Ezra Mam, Kayln Ponga and Reece Walsh all at 2.2.
The best conversion percentage goes to Mam and Ponga at 20% from low volumes, slightly ahead of future teammate Jonah Pezet at 17.4% also on low volumes.
Of higher volume kickers (30+ attempts), Jarome Luai ranks as one of the best at 17.1% of kicks resulting in tries, with Daly Cherry-Evans converts at 13.1% and Chanel Harris-Tavita at 12.2%.
—
The Rugby League Eye Test produces artisan small batch rugby league analysis that you can’t find anywhere else. The Eye Test offers hand crafted data and independent analysis that you can trust came from a human brain.
This sort of quality workmanship takes time and effort. Quality independent, ad-free rugby league content doesn’t exist without support from readers and the community. The Rugby League Eye Test operates under a value for value model.
If you’ve enjoyed this post, and are in a position to do so, then you can donate an amount of your choice through the PayPal link below, the Kofi page, or through the support page on the site’s menu. You can decide the level of contribution based on the value you believe the Eye Test provides to you.
Support The Rugby League Eye Test
For those of you in areas (such as New Zealand) where there’s issues with PayPal donations for some reason, I’ve set up a Kofi page as well for donations.