
The Surf Coast has been pumping while alpine areas just experienced one of the worst snow seasons on record.
Taken in isolation, those two developments indicate the long-threatened El Niño is upon us. Yet if we look around it appears some areas didn’t get the memo.
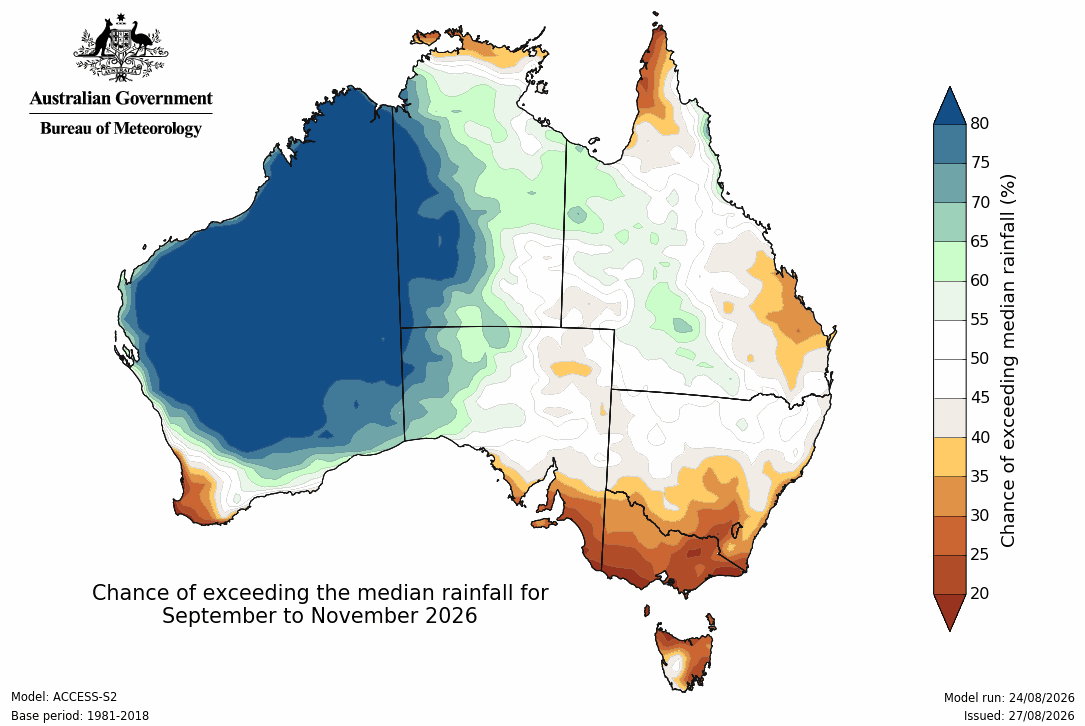
Last month, South Australia copped a drenching (with more to come), while rain continues to fall across Victoria and NSW. These developments run counter to the El Niño pattern.
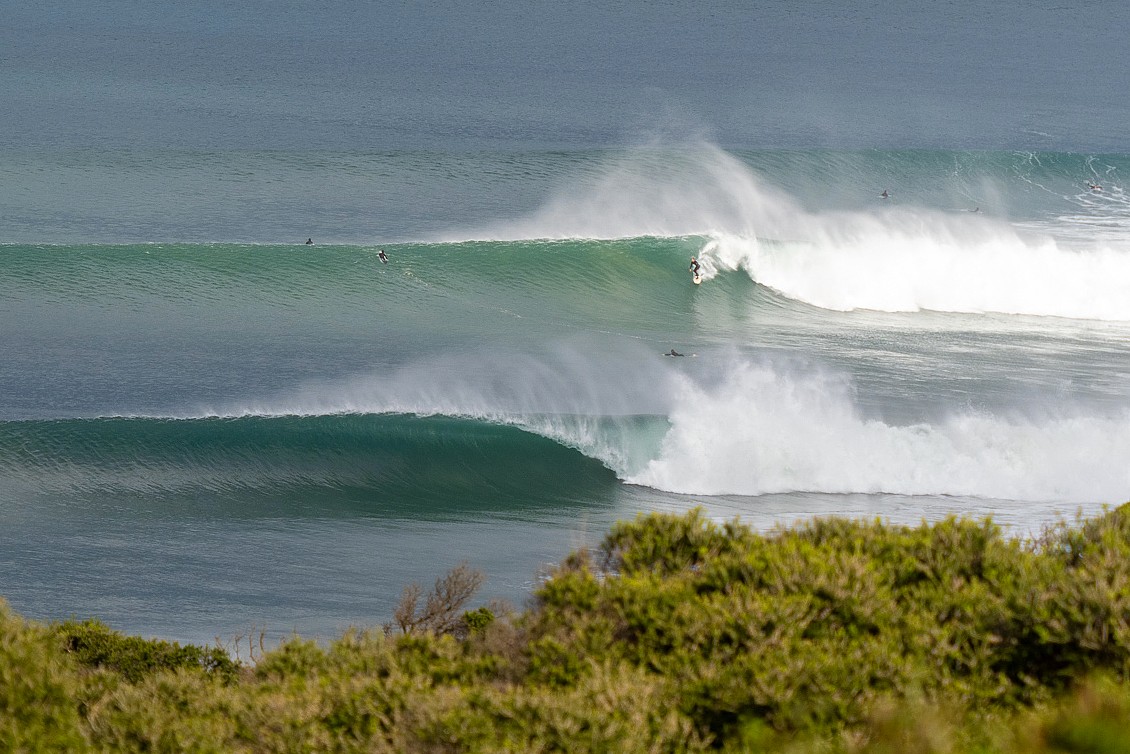
Days like this have been plentiful on the Surf Coast (Romy)
There’s no mistaking that a very strong El Niño is currently setting itself up through the Pacific Ocean.
However, regular readers would be aware that recent El Niño’s have had a reduced impact on the Australian region. Largely, the ‘hot and dry’ effects have been moderated by warm seas surrounding the Australian coastline. By increasing available moisture, the warm water effectively buffers us from severe drought and moisture deficits that are typically a feature of El Niño’s.
This is nowhere more clear than the current year, with sea surface temperatures now reaching the highest on record throughout the equatorial Pacific Ocean.
In the past, such a significant warming signal would contrast starkly with cool water anomalies in the western Pacific and Indonesian regions. This difference in temperature from east to west would feed back into a rising air mass across the Pacific, with the warm air falling back across northern Australia, bringing an increase in pressure and reduction in rainfall for inland and south-eastern Australia.
Yet those areas continue to be drenched with rain.
At the same time, cooler waters off Indonesia also aid the reduction of rainfall through spring, as much of our weather arrives from the north-west during this period.
For the most part, strong El Niño’s go hand in hand with this cooler upwelling signal off Indonesia (known as a positive Indian Ocean Dipole event), but even that’s gone missing this year after sending early signals.
One look at what El Niño’s used to look like compared to now in a warming world paints a vivid picture.
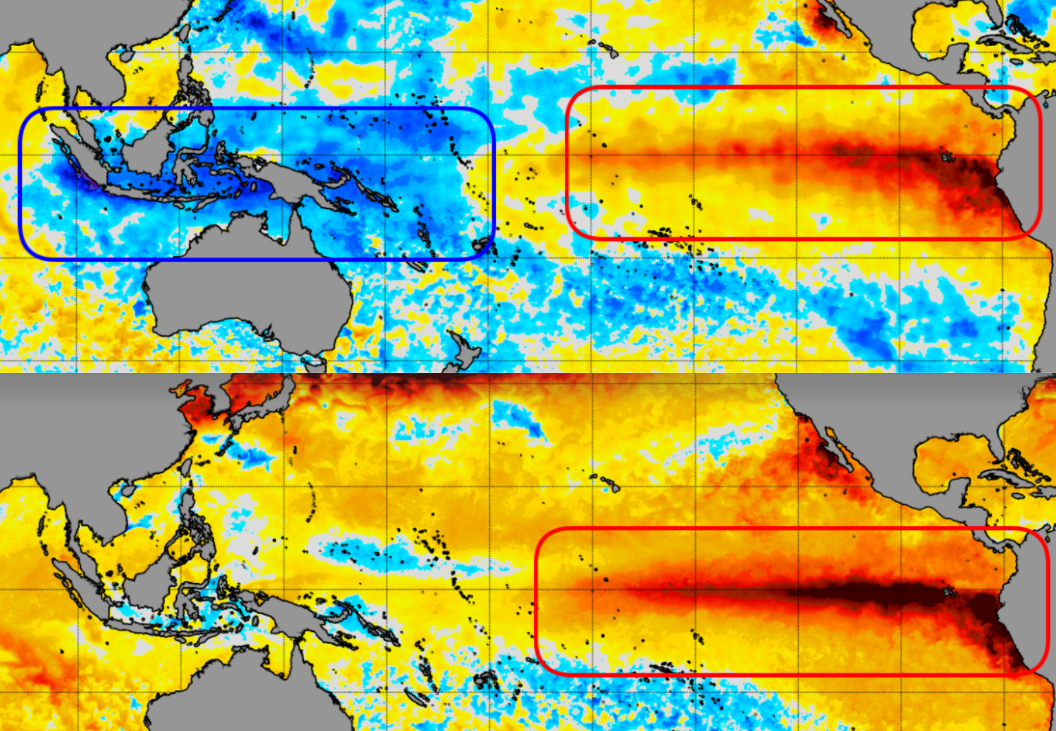
Firstly we have the very strong 1997/1998 El Niño event, with the sea surface temperature anomaly charts (which highlight the difference from normal) painting a clear blue/red signature across the tropical regions.
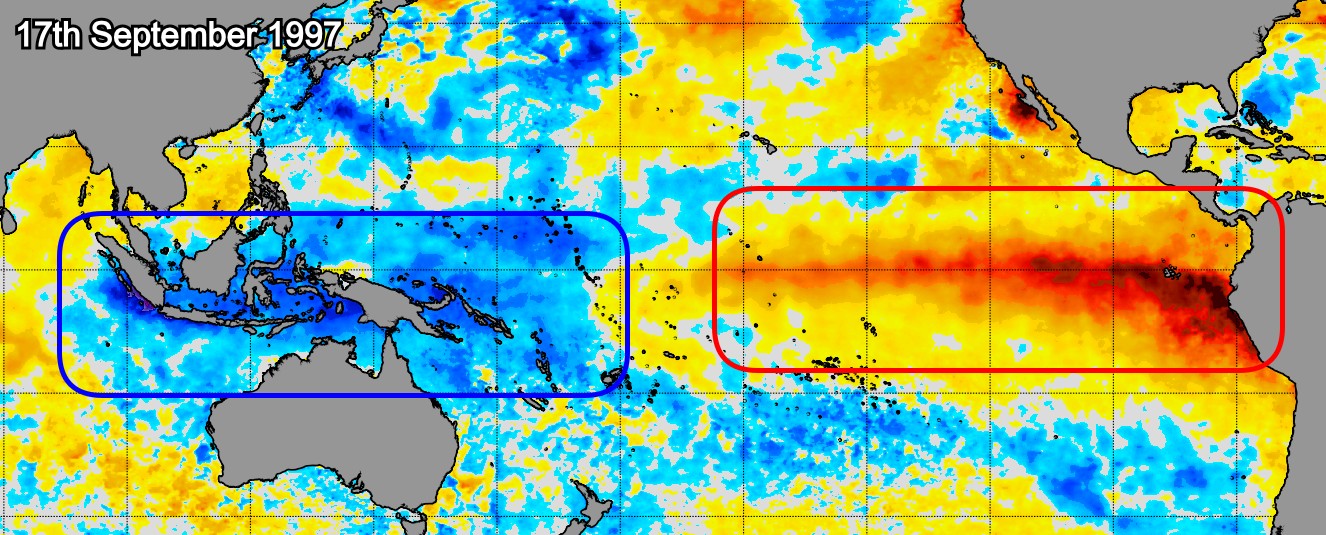
Global sea surface temperature anomaly charts for September 1997 (NOAA)
If we compare that to the current event under way, the difference becomes obvious. While the El Niño heat signal across the Pacific is stronger than that in 1997, the adjacent ocean regions aren’t balancing the heat with cooler water. In fact, they’re anything but – every ocean basin is figuratively running a fever.
.jpg)
Global sea surface temperature anomaly charts for August 2026 (NOAA)
This lack of contrast between warm and cool water weakens the feedback loop emanating from the Pacific Ocean. In turn it reduces El Niño’s impacts on the Australian region, with local sea surface temperatures overriding the climate driver.
Relatively speaking, the difference is still there. It’s just not as strong as it used to be.
Also, with warmer waters sitting off the North West Shelf, we’ve got a plentiful source of moisture heading into spring and this will fall across the inland regions of Western Australia, creeping down to South Australia and inland NSW towards summer.
Swell wise, the response to a significant rising air mass across the central and eastern Pacific regions is the advection of cooler, polar air towards the tropics – ie Southern Ocean storms.
This activity looks to be focussed to the south and south-east of Tasmania favouring that state and Victoria, along with South Pacific targets, while a similar increase in activity is due to the south-east of Madagascar, boding well for Western Australia and Indonesia.
For the Australian East Coast, a steady diet of refracted southerly swell is more than likely with winds out of the northern quadrant.
On a separate yet related note, following a subdued winter swell season, beach widths in NSW are far wider than they’d typically be at this time of year. A continuation of mild long period swells from the south will continue to increase sand levels.