
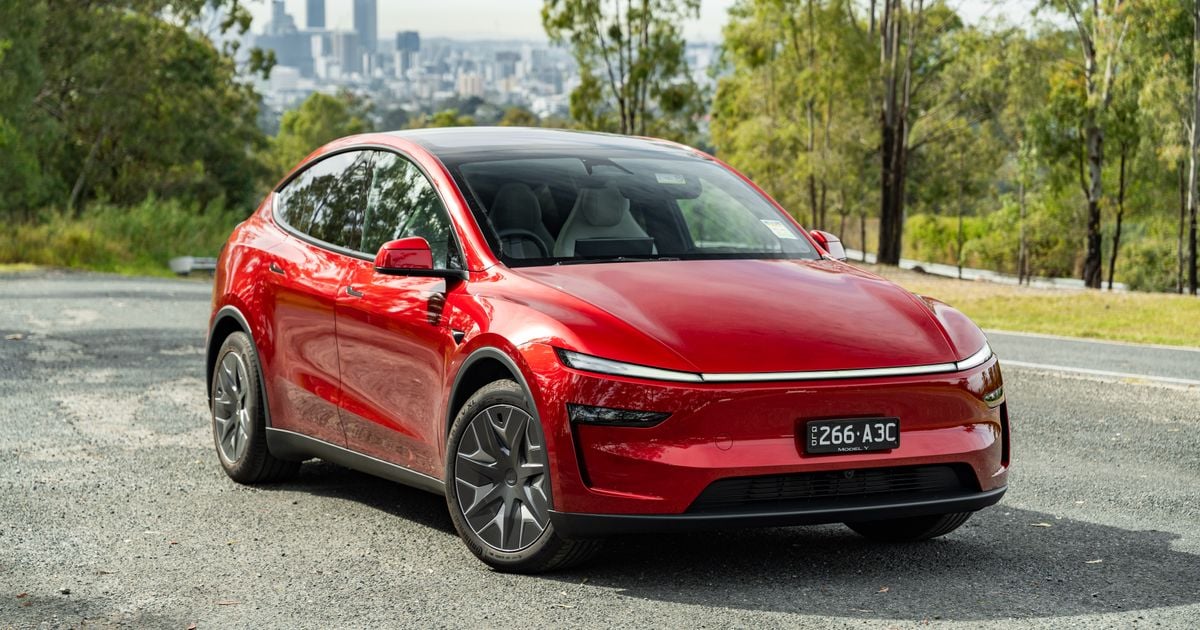
New-vehicle sales were up in August 2026, with strong gains by brands such as BYD, Tesla and Omoda Jaecoo helping drive electric vehicles (EVs) to record market share.
A total of 108,760 new vehicles were delivered in Australia in August 2026, up 4.9 per cent on the same month last year, according to VFACTS data published by the Federal Chamber of Automotive Industries (FCAI) and seen by CarExpert, plus Tesla and Polestar sales data made freely available by the Electric Vehicle Council.
A total of 27,078 of the new vehicles delivered in August were EVs, up 169.4 per cent year-over- year (YoY), which means for the first time this powertrain type has outsold all other types of propulsion.
Unusually, the FCAI’s press release lists a different total EV sales figure of 27,089.
EVs accounted for almost one quarter of the overall new-vehicle market, at 24.9 per cent – a record level of market share for this powertrain type.
Looking for your next car?
CarExpert can help you research, compare and buy so you choose with confidence.
For context, a total of 25,824 deliveries were of petrol-powered vehicles, followed by 23,608 diesels, 18,662 hybrids and 10,591 plug-in hybrids (PHEVs).
After decades of supplying sales data for every model sold by brands that report to it, the FCAI has supplied parties with an incomplete VFACTS report that lists only the top 25 best-selling vehicles.
The list is below, and expanded to include Tesla sales data from the Electric Vehicle Council.
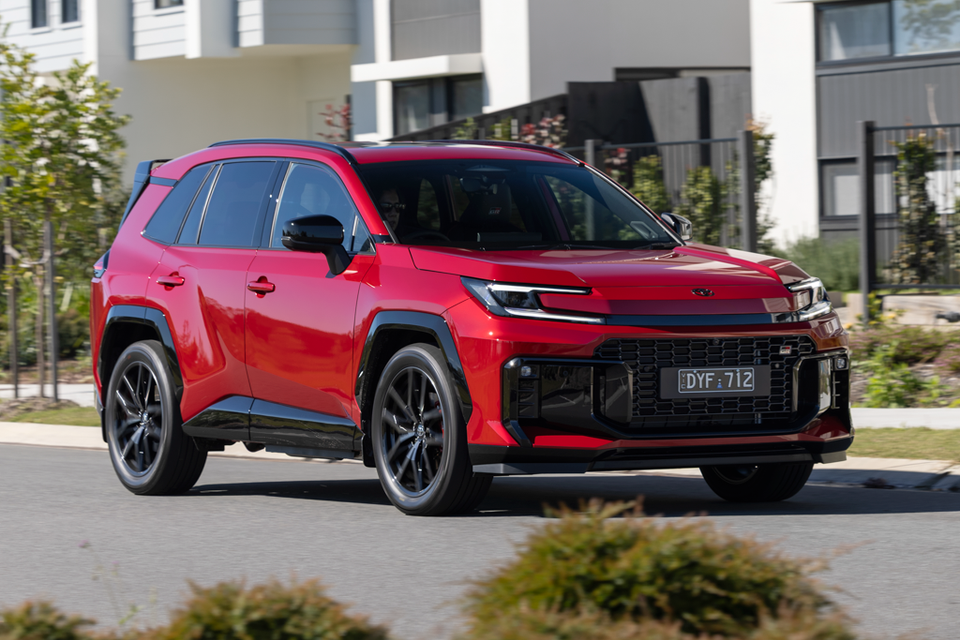
ModelAugust 2026 deliveriesDeliveries year-to-dateTesla Model Y641431,454Toyota RAV4547026,585Toyota HiLux483332,161Toyota Prado247513,659Ford Ranger244032,796BYD Sealion 7221317,277Chery Tiggo 4201217,806Geely EX5194710,737GWM Haval Jolion189115,033Zeekr 7X 17489172Isuzu D-Max170816,371Hyundai Kona168816,916Jaecoo J516729439Ford Everest166014,490Kia Sportage158612,773Hyundai Tucson154814,272Mazda CX-5146013,838BYD Shark 6138512,094MG ZS135711,822Geely EX212791753Geely Starray EM-i12786669Tesla Model 312714597Mitsubishi Triton116112,831Toyota LandCruiser115010,926Mitsubishi Outlander113113,320BYD Atto 211227737Kia Carnival 11107970Brands
Toyota was on top as usual, while BYD was again in second position for the fifth month in a row. Tesla vaulted to third position thanks to a 162.6 per cent YoY increase.
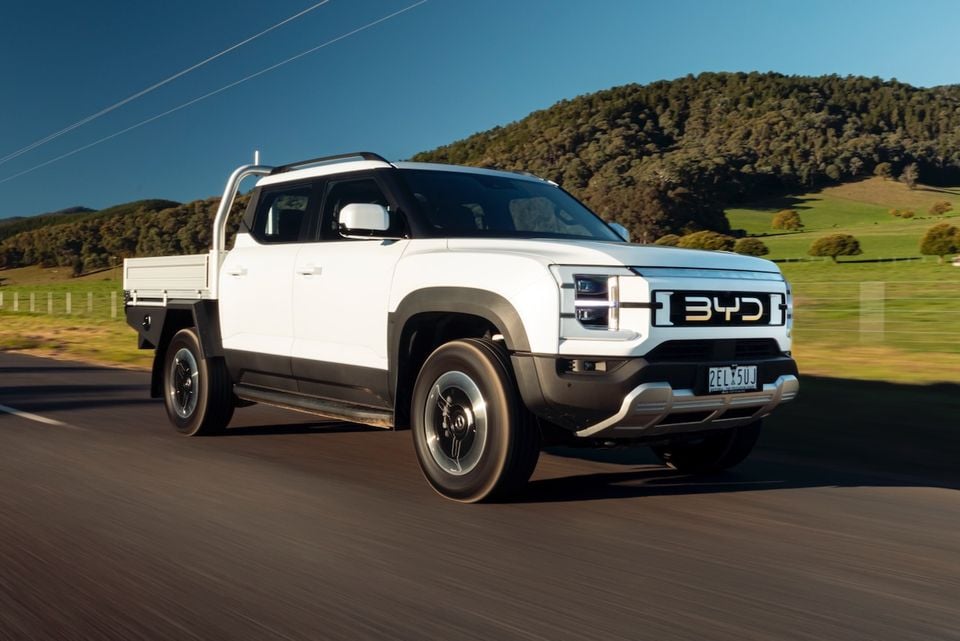
Kia was in fourth position, ahead of Mazda, Hyundai, GWM, Ford and MG. The 10th best-selling brand wasn’t Chery but rather another Chinese brand, Geely.
Every Chinese brand in the top 10, plus Tesla, was up YoY; every other brand, in contrast, was down.
While Chery narrowly missed out on a top 10 spot, it sat in 11th with a significant gap between it and Isuzu Ute in 12th place. The Japanese brand managed to outsell Mitsubishi, long a top 10 fixture, despite having only two models in its showrooms.
Some brands still don’t report to the FCAI or EVC, including Cadillac, Mahindra and Smart.
Note Alfa Romeo Junior and Jeep Avenger sales are inexplicably counted not under their respective brands, but under a separate Stellantis entry in VFACTS. Without full model-level data, we can’t calculate the exact percentage increase or decrease in YoY sales for Alfa Romeo and Jeep.
BrandAugust 2026 deliveriesYear-over-year changeToyota19,712-5.2%BYD8231+68.8%Tesla7685+162.6%Kia6500-12.2%Mazda6203-9.0%Hyundai5355-15.3%GWM4870+8.5%Ford4816-39.8%MG4767+21.4%Geely4504+1023.2%Chery4238+28.2%Isuzu Ute2790-13.4%Mitsubishi2612-42.6%Omoda Jaecoo2203+340.6%Zeekr2120+2309.1%Subaru2027-36.7%Nissan1739-33.4%Mercedes-Benz1674-24.3%Volkswagen1629-38.0%BMW1522-11.6%Lexus1163-0.4%Honda1100-7.2%LDV1100-11.8%GAC1066–Suzuki933+11.7%Audi713-49.7%Volvo Car582-9.2%Land Rover539-19.1%Xpeng511–KGM470+53.1%Mini402-6.5%Skoda353-16.0%Chevrolet297-13.9%Porsche290-30.8%Denza261–Renault250-24.0%Ram237-8.8%Foton153–Fiat146-4.6%Polestar136-40.6%Leapmotor112+286.2%Genesis104-21.8%Peugeot88-24.8%JAC77-43.8%Cupra74-60.6%Farizon50–Deepal45+181.3%Jeep21-81.6%Lamborghini21+40.0%Aston Martin19+72.7%GMC18-59.1%Bentley14+16.7%Ferrari13-35.0%Maserati10-54.5%Alfa Romeo9-67.9%Stellantis9-78.6%Lotus3-62.5%Rolls-Royce3-25.0%McLaren1-83.3%Citroen0-100.0%Forthing0–Jaguar0-100.0%Sales by category
Includes Tesla and Polestar sales.
CategorySalesMarket shareSUV72,75266.9%Light commercial18,08116.6%Passenger car14,93013.7%Heavy commercial29972.8%Top segments
Includes Tesla and Polestar sales.
SegmentSalesChange YoYMedium SUV37,328+45.1%Small SUV17,820+0.4%4×4 utes13,507-27.1%Large SUV12,072-9.0%Small cars4746-19.4%Sales by region
Excludes Tesla and Polestar sales.
State/territorySalesChange YoYNew South Wales30,517-0.1%Victoria27,270+0.9%Queensland20,849-4.8%Western Australia11,572+8.7%South Australia6660+4.0%Tasmania1698+9.3%Australian Capital Territory1512-6.4%Northern Territory861+2.5%Sales by buyer type
Excludes Tesla, Polestar and heavy commercial sales.
Buyer typeSalesChange YoYPrivate52,916+7.7%Business36,426-5.8%Rental6277+0.1%Government2323-18.9%Sales by fuel or propulsion type
Excludes heavy commercial sales.
Fuel typeSalesSales year-to-dateElectric27,028154,304Petrol25,824243,673Diesel23,608207,541Hybrid18,662142,210PHEV10,59175,206Sales by country of origin
Includes Tesla and Polestar sales.
CountrySalesChange YoYChina43,882+88.9%Japan24,892-12.8%Thailand15,658-24.7%Korea11,060-14.2%Germany3718-15.2%You can access our coverage of previous months below: