
November 1st is approaching and NRL clubs will finally be able to (officially) negotiate with players off contract after the 2027 season. The addition of the Papua New Guinea Chiefs in 2028 and their ability to offer tax exemptions this could result in this being one of the busier Novembers in recent years.
With that in mind, I thought I’d contribute to the madness that will come next week by using my player contribution rating (ETPCR) to model some player salaries based on the value of production from the 2026 season.
I could look at some of the Rugby League World Cup results, although there’s not too much to be gleaned from 70+ point drubbings even if we did see a somewhat competitive Australia/Fiji match on Sunday. Anything I’d do wouldn’t be adding more than Jason Oliver has done at Rugby League Writers, Liam has done or will do at the Maroon Observer already or Mike Meehall Wood has done at Love Rugby League.
As for projecting player value, I am going to change things up slightly though. This time I’m going show the final result first, and then work through the methodology. I know you all just scroll to the charts anyway and skip the actual analysis, right?
The most valuable player in the NRL this year was Sua Fa’alogo of the Storm, whose total production was worth a salary of $2.165m. James Tedesco was next at $1.84m, then Manly back rower Haumole Olakau’atu ranked third at $1.57m. Herbie Farnworth, Braydon Trindall, and Nathan Cleary were the next three.
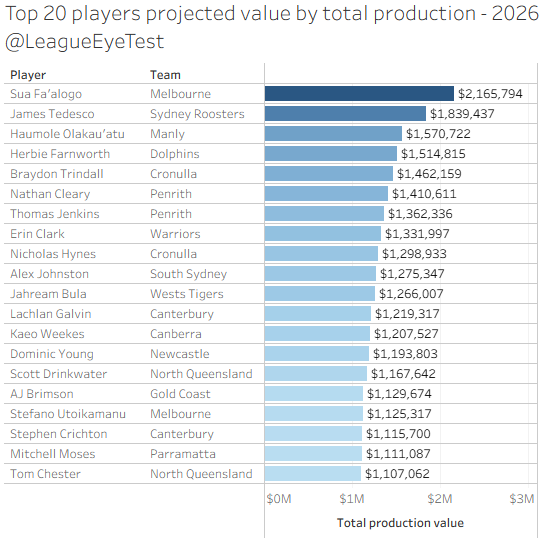
Note I said “total production”, as I’ve summed up their production by using a margin normalised ETPCR number. There’s a reason for this that I’ll get into shortly.
I can also do this by an average margin normalised ETPCR number pro-rated out to 24 games, where Tedesco would edge out Fa’alogo, $1.82m to $1.66m as shown below.
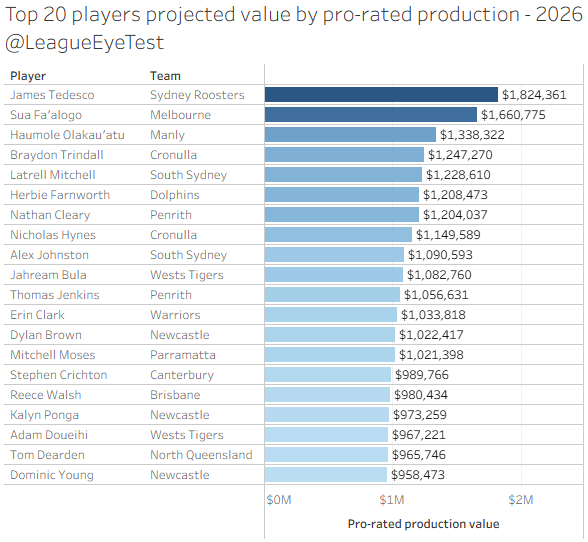
Why do they flip? One reason is that Fa’alogo played 24 games this season, whilst Tedesco played just 17 and we’re prorating everyone to a full 24 game season. Latrell Mitchell ranks 5th by this version, as his 11 games were ridiculously impactful when excluding margins, and projecting that to a full season even with a slight regression to the mean placed him in the top five players.
So how did I get to this point?
I’ve done projections on salaries before but was never overly happy with the results. Firstly, I was projecting an upcoming season weighted by production in prior years with an aging curve, without accounting for a change in player roles. Then there was the issue of players getting injured or aging at different rates to what the curves would suggest. The results were fine to good but there was room for improvement.
One of the main issues using my ETPCR metric is that the margin weighs too heavily for my liking in the score to make a value projection accurate. It’s great as a single game impact score, but doesn’t properly highlight good players on bad teams. It also doesn’t scale by position, meaning hookers and halfbacks are rated the same.
It’s something people mention to me regularly when I post the weekly ETPCR charts to social media. On a week where a team wins by 50 points, a lot of their players are at the top and most of the opponents are at the bottom.
Support The Rugby League Eye Test
Part of this is by design, as I wanted a similar metric to “Net Points” from the NBA created by Dean Oliver to say that in a specific game, Player X was worth +2.1 points to their teams result, with all player contributions summing up to the game margin.
The issue is that whilst it creates a great single game impact metric and a good at measuring season long impact, it’s not a great season long talent or performance metric. Mainly it assumes that all players on a good team are equally good, and bad players on bad team are equally bad.
Just look at my 2026 top 20 by ETPCR which shows part of the issue.
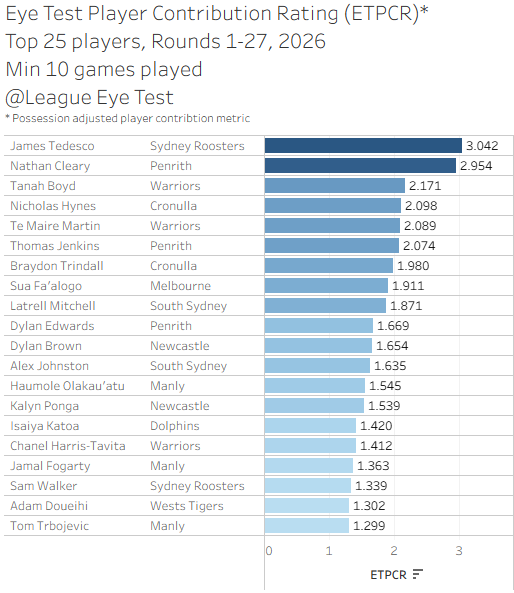
It’s dominated by teams who win by a lot of points, or players who scored a lot of tries. Big margin games are skewing things here, A try when you’re up by 30 count the same as one when scores are tied. It also means that scoring a try in a 30 point win was more valuable than one in a 6 point victory.
What I needed to do is remove that bias from the ridiculous blowout games that we saw more of in 2026. I needed to create a level playing field where the statistical performance of a five eighth in a 24-20 win can be compared with that of a different five eighth in a 44-10 victory, or that of a five eighth in a 42-16 loss. The impact needed to be normalised.
Being a man of the people and listening to my audience, somewhat of an unheard of concept in rugby league circles, I’ve been able to make that fix.
In the end the solution was right in front of me, and I’m annoyed I didn’t think of it sooner.
To normalise the ETPCR score, I ran a regression of ETPCR against margin and position for multiple seasons and found that a single point of margin was worth +/- 0.0671 to an ETPCR value.
If you won a game by 10 points, that would be worth +0.671 to an ETPCR, and if you lost a game by 10 points, it would usually be worth about -0.671 to an ETPCR. A win or loss by 30 points would add or subtract around 2.05 points to an ETPCR score. I’d found a way to reduce the impact of that margin.
The key is doing it by position as a spine player, or outside back is likely to have a higher variance in their performance in a big margin game. Forwards roles are relatively defined, playing fewer minutes and having fewer opportunities to create points. by position the numbers vary from that 0.-671, with hooker the lowest at around +/- 0.052 scaling up to full back at nearly twice that value.
This way I can use the raw ETPCR score to can show a single game impact, and an adjusted ETPCR (nETPCR) that is mostly margin agnostic. I have now expanded my horizons with the best of both worlds.
I’d already posted the top 20 players by ETPCR for the season above. Here’s the margin agnostic version for 2026 by total production. Again, I’m using “total production” here because the best ability is availability. Spending $1 million a season on a player who plays 10 games isn’t the best use of your salary cap. These are the players who showed up every week. Only two of them played fewer than 19 games – Tedesco (17) and Mitchell (11).
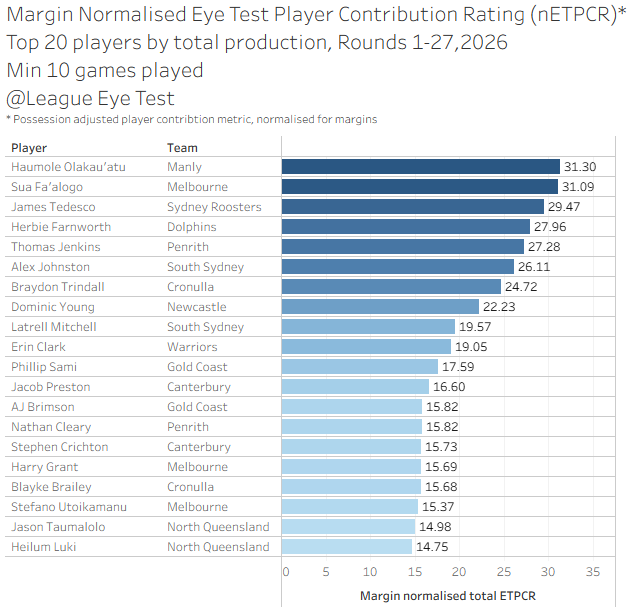
Olakau’atu was the most valuable player this season, with a total nETPCR of 31.30, slightly ahead of Fa’alogo with Tedesco in third. The top three didn’t change, but there’s some similarity but a few unique names like Jacob Preston, Phillip Sami and AJ Brimson.There’s also two hookers in Blayke Brailey and Harry Grant, meaning I might (but probably haven’t) fixed the bias against hookers.
By per game average and ignoring availability issues, it’s still dominated by backs, which makes sense as they’re creating the production of tries or scoring them.
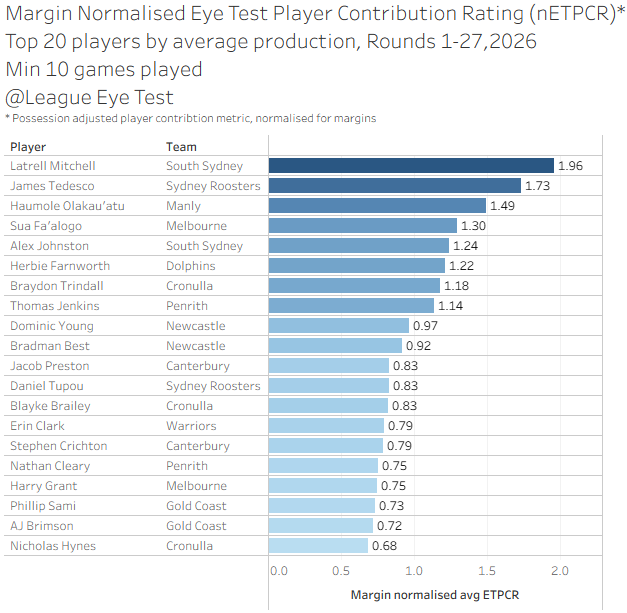
Here’s why Latrell was so valuable to Souths. Mitchell had a margin normalised ETPCR of +1.96, in a league where only seven players were above +1. Another way of putting it is that Mitchell was twice as valuable on field than anyone other than Tedesco, Olakau’atu, Fa’alogo, Johnston, Farnworth, Trindall and Jenkins. Mitchell adds nearly two full points to his team just by taking the field. But you have to take the field to make that matter.
Now that I’ve got a normalised ETPCR (nETPCR) to use to properly rate players independent of game results, we can apply this to a salary projection as well. I’ve changed from a forward looking model to a backwards looking one because the variables applied in predicting a player’s value are incredibly difficult to account for. Looking backwards makes it a bit easier, and it’s also more timely. No one is interested in player values for the upcoming season come Round 1, but pre November 1st knowing how a player performed in relation to the salary cap is quite important.
There’s two ways to do this, which you would have noticed from earlier. The first is by a sum of normalised ETPCR, which weighs more heavily to player availability (for reasons mentioned above), with Fa’alogo coming out ahead of Tedesco (playing 24 games to 17). Again here is the top 20 chart by total production.
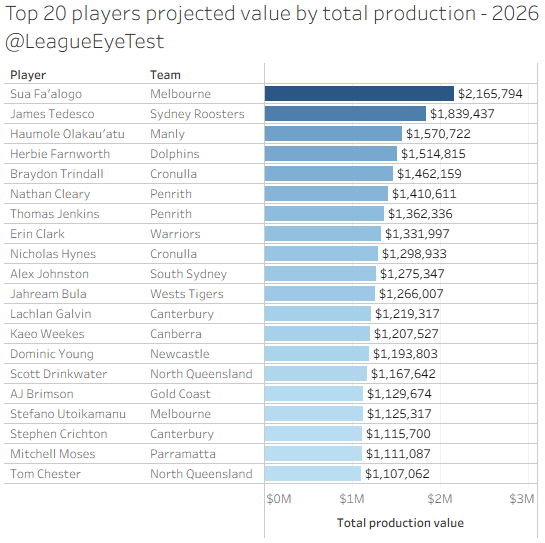
The thing I like about this method is that it provides players from a wider range of teams once margins are normalised and there’s very few names on here that you could argue don’t belong in the top 20. Brimson, Utoikamanu and Chester would be the three, but you could make cases for at least two of them. For most, their actual position in the top 20 could be argued, but based on availability and production it’s hard to question.
The second is to do it by average normalised ETPCR, which is a theoretical value of a player if they were available for a full 24 game season. This is the “ideal” scenario when looking at a value of a player, but for the majority it’s unlikely to happen and why valuing players like Tom Trbojevic is incredibly difficult. This is the method pushed Tedesco back in front of Fa’alogo. Here is the same chart by pro-rated production again.
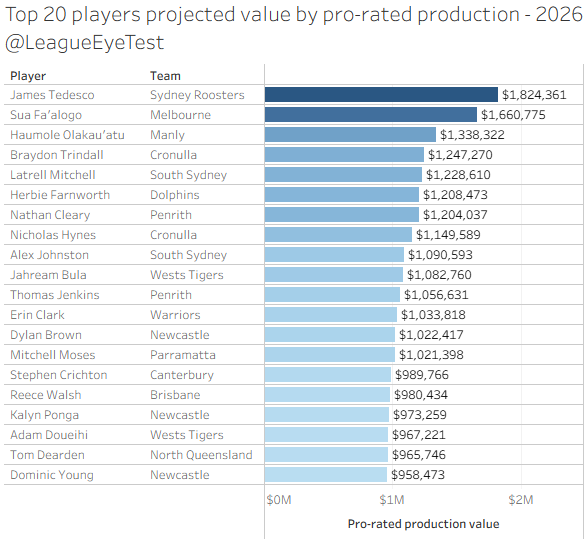
The biggest takeaway for me from this endeavour, along with how important Mitchell is to Souths, is just how underappreciated Olakau’atu is. By total nETPC he was the best player in the NRL this season, double the nearest backrower (Luki) and incredibly durable. You could argue that Manly still don’t use him enough.
It also highlights why the Bulldogs have let Matt Burton test his value on the open market. Both Burton and Stephen Crichton produce at similar rates and are valued at similar numbers by my method – $989k for Crichton and $880k for Burton. There’s no doubting Burton’s talent, but it’s hard for the Bulldogs to be paying him halves money when they already are highly invested in Crichton and Lachlan Galvin. There’s probably a sensible number for the club and Burton to reach where he returns in the centres, but playing him outside of the halves on halves money isn’t an ideal situation.
For the inner workings, I’m still using the same methodology as previous versions. To start, we calculate the number of available minutes played by non replacement level players from the each season. Then we divide the total dollars available under the salary cap for each year by the total number of minutes played by above replacement level players.
This gives us a per minute dollar figure of how much a single minute of play is above replacement level is worth. Multiply that number by the number of above replacement level minutes played by each player, or prorate it out to 24 games with some regression to the mean, and you have their projected salary. For those wondering, the number is approximately $734 per minute of production above replacement level for 2026.
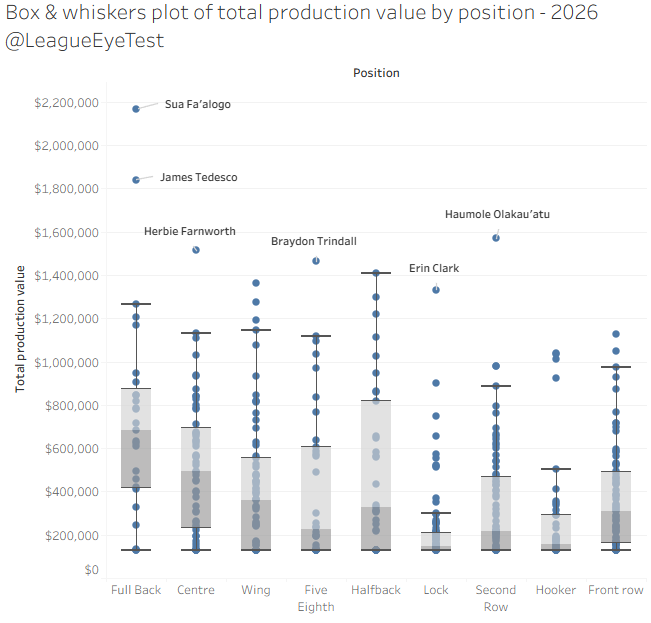
I can also use my old friend the box & whiskers plot to show outliers by salary for each position, and where the value lies. First up is the chart by total production.
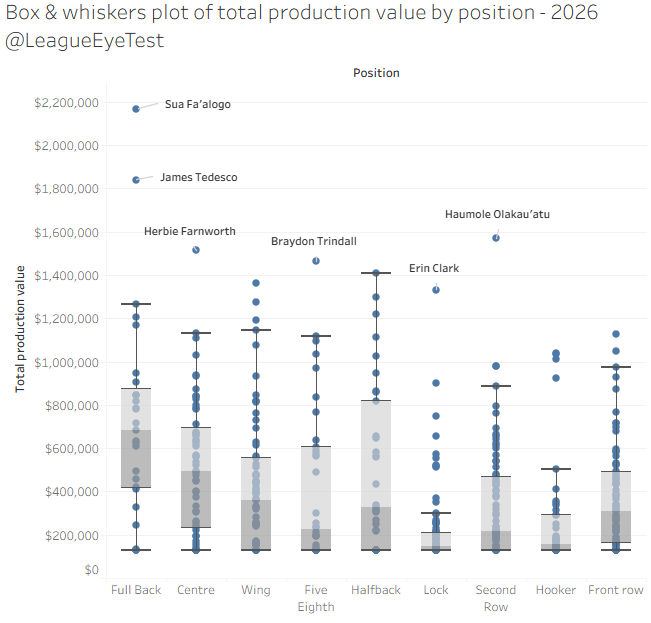
To help read this chart, the top of the whisker is theoretically the top 25 % (75-99% where higher being better), with those above being outliers. The box represents the middle two quartiles (25-50 and 50-75), and the lower line or whisker being the bottom 25%.
The way to process this is by looking at where the scarcity of players are. The midpoint of the box shows where the median is, which should help identify which positions are more important to secure top level talent.
For full backs, there’s a gap between the truly elite players and the next tier of great players, with a another gap back to the very good players and below. A similar trend exists for halves, although with fewer outliers. For hookers there’s three high quality outliers (Grant, Brailey, Egan) with a huge gap to the rest.
There’s very minimal difference between props or second rowers once you move past the top half dozen players. Lock is a hard position to read with the way some teams flip their front rowers and locks, but the key is that there are only a handful of elite locks and the gap between them and regular first grade 13s is huge. There’s no reason to be paying top dollar for middle forwards unless you’re getting someone from the upper echelons. The production players provide below that is comparable.
In some positions, there’s no gap between the bottom quartile and the bottom whisker. This would indicate that once you’re hitting the bottom 70% of players in those positions, the difference between 75th percent and 99th percent is practically zero and they’re all playing at near replacement level production.
And here’s the same chart by but pro-rating the production out to 24 games. There’s not a huge difference here but there are some changes.
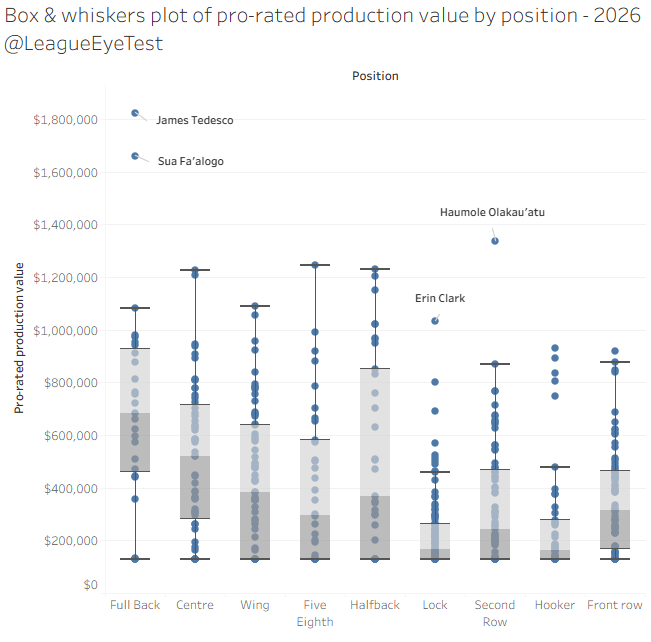
The most notable change is the number of outliers shrinks, with most falling back inside the top whisker. The exceptions are Tedesco, Fa’alogo, Clark and Olakau’atu. The difference is that the gap between the outlier locks and the top whisker shortens, indicating that there were plenty of locks this season who didn’t play a full schedule. The overall trends from the prior chart still exist.
There’s still some issues using this method. Quality players appear as only worth a minimum salary, because the data available doesn’t reflect their importance on field. Cameron Munster or Api Koroisau are good examples this season.
Munster was not as involved as prior seasons and the Storm weren’t producing points. Koroisau regularly concedes a high volume of try causes, line break causes, concedes penalties and misses tackles. Both players are able to produce moments of brilliance where points are created out of nothing though which is far more valuable than the sum of their production, especially on Koroisau’s case where he leads a very inexperienced side.
Another example of this Phoenix Crossland who also grades out as a minimum salary player here despite being incredibly valuable to the Knights. The main reason is his high minutes played for a hooker, along with a high volume of missed tackles for a hooker. This hurts him under this model as his per minute efficiency is not above replacement level.
These three examples are where I’d trust my own instincts and put more weight in the traditional eye test. There are things that Munster, Koroisau and Crossland bring to a team that you can’t quantify, which are worth far more than the actual production they create. It’s just one piece of evidence that doesn’t paint them in a particularly good light, but there are plenty more that do.
Eels hooker Tallyn Da Silva is also rated as a minimum salary player. Not because of high minutes like Crossland (just 53 per game), but due to his defensive issues. Yes he led the Eels in tries scored, but Da Silva ranks highly for try causes, line break causes and missed tackles among hookers. That drags down his overall production, but for the Eels his creativity in attack probably outweighs his current defensive issues.
Something I can also do, which I won’t go into detail in this post but may at some point next season, is pinpoint how much of a players production can be attributed to playing in high margin games. Keen eyes will notice Cleary is not as high as usual in these margin normalised charts, and the absence of Dylan Edwards. They are the top two players with the largest difference between ETPCR and nETPCR, indicating that their production is driven more by playing in games with a big margin.
Neither of these versions of projecting values or salaries for players may look “correct”. I’d read a piece on LinkedIn about analytics and models recently that touched on this. LinkedIn isn’t somewhere I usually visit but enough people whose opinions I trust recommended it enough for me to read it. I promise I won’t do it again.
There’s a lot I agree with. Models should inform thinking and not replace it. Standing behind a model or it’s numbers isn’t useful. Anyone claiming to have a model that has solved rugby league or that their model has no flaws is a charlatan. I don’t claim that this model (or any other model I run here at the Eye Test) is perfect, and routinely point out where the shortcoming are.
These days everyone has (or can make) a model. The value isn’t in the data or the model but the interpretation of it and the understanding of the benefits and flaws. What is it’s value in decision making? What business decision is it answering?
If someone can’t answer these questions, effectively communicate the blind spots or biases in their model, or clearly explain how they interpret the results, then you shouldn’t put credence in anything they say. But I digress.
My salary/value model is not saying Fa’alogo is definitely worth more than Tedesco, it’s saying that using these data points there’s evidence that Fa’alogo produces more reliably on field and is more available than Tedesco and could be worth more. How you use that evidence from there to inform decision making is another distinct process.
I’ve mentioned this each time, but it may not be the most statistically pure method of applying a dollar value to each players production. What it does is provide a starting point for discussions and further questions. These projected salaries are only considering availability (the best ability) and quantifiable production.
There are immeasurable intangibles like leadership, experience, potential ability and cultural fits that are taken into account when determining a player’s value. This is just covering the data part of it. Any real analysis of a players worth should be taking into account all of these aspects.
I think this process has merits even if it’s flawed, although less flawed than previous versions. If you have any thoughts on this process, want to suggest anything or just generally complain about your team’s players not being ranked high enough, you can reach me at leagueeyetest@gmail.com or DM on your least favourite social media platforms.
—
The Rugby League Eye Test produces artisan small batch rugby league analysis that you can’t find anywhere else. The Eye Test offers hand crafted data and independent analysis that you can trust came from a human brain.
This sort of quality workmanship takes time and effort. Quality independent, ad-free rugby league content doesn’t exist without support from readers and the community. The Rugby League Eye Test operates under a value for value model.
If you’ve enjoyed this post, and are in a position to do so, then you can donate an amount of your choice through the PayPal link below, the Kofi page, or through the support page on the site’s menu. You can decide the level of contribution based on the value you believe the Eye Test provides to you.
Support The Rugby League Eye Test
For those of you in areas (such as New Zealand) where there’s issues with PayPal donations for some reason, I’ve set up a Kofi page as well for donations.