
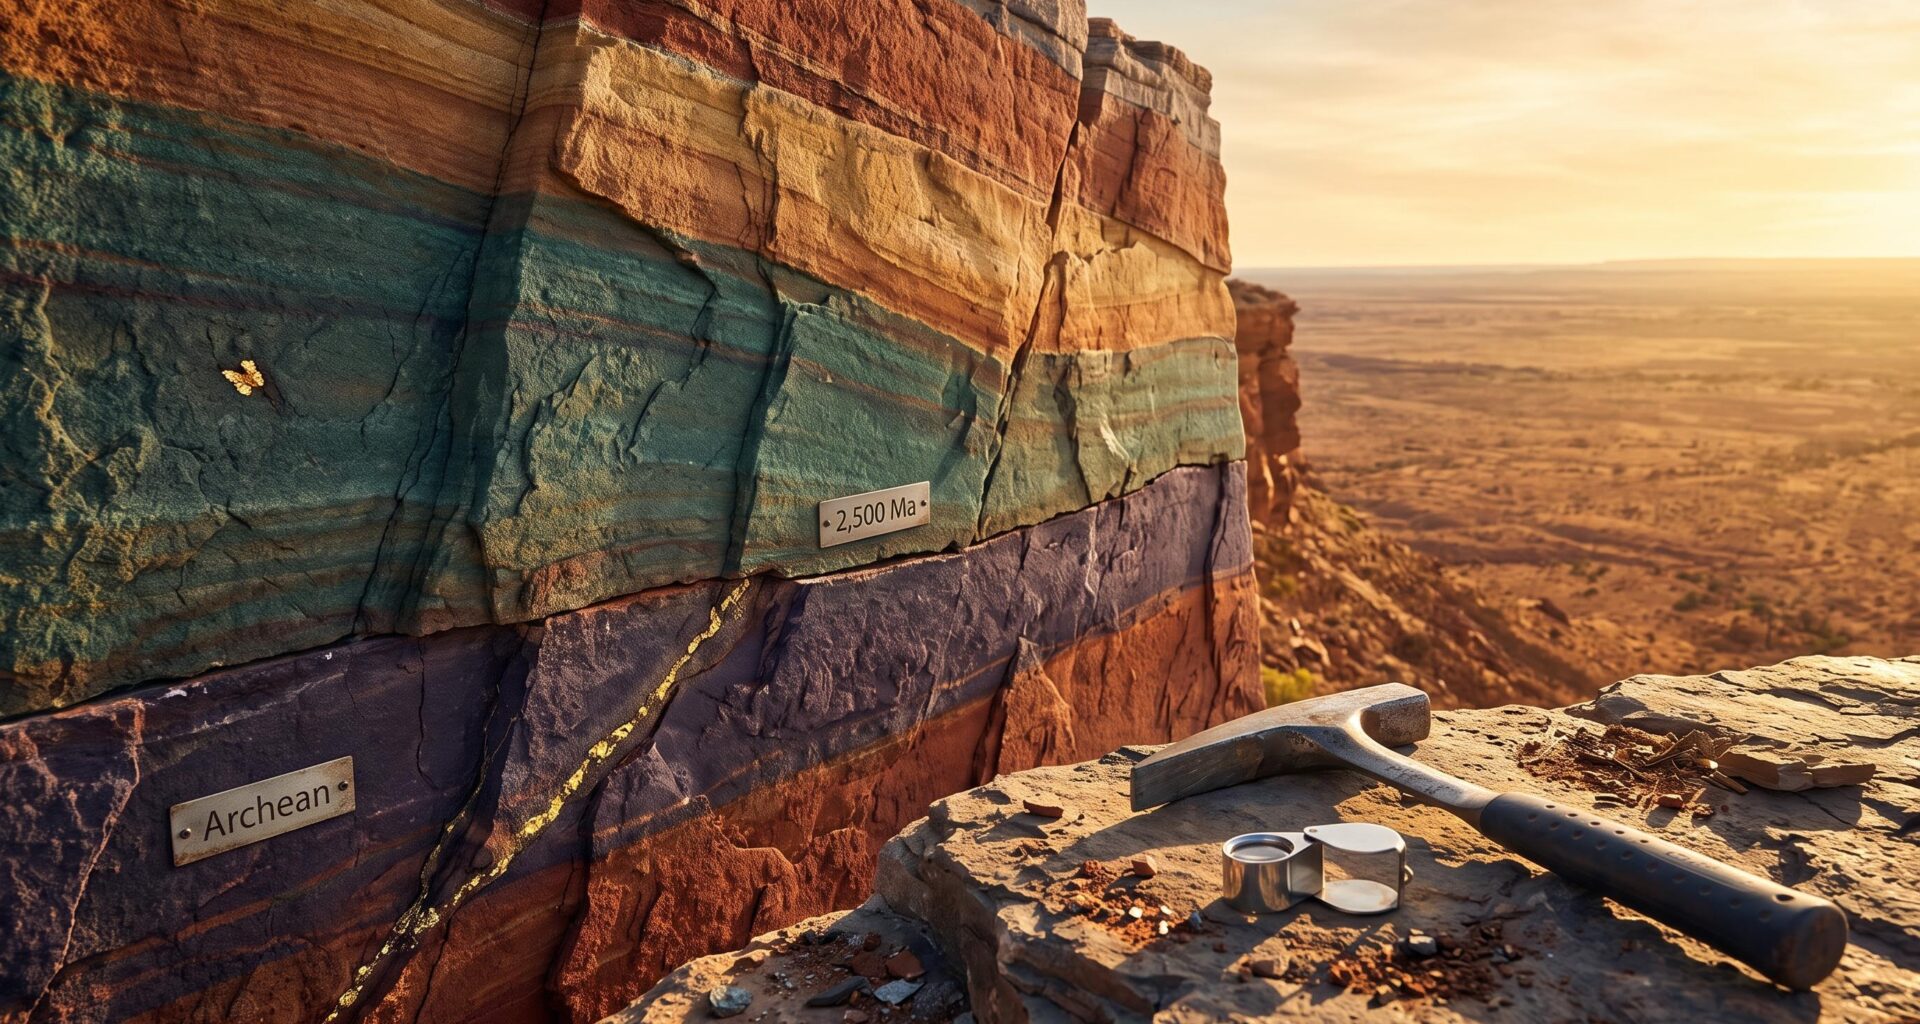
A line such as “Archean, 2.7-billion-year-old greenstone belt” in an exploration update can sound like evidence that a company has found gold. It isn’t. Those words describe where and when the rocks formed. They say nothing about how much gold, if any, sits in them.
Geological time terms appear in almost every exploration announcement and technical report. Reading them correctly is a skill worth building before you weigh any claim a company makes. This geological time scale investor guide treats that vocabulary as something you can learn and check.
Here is a practical way to sort each sentence in a disclosure into four piles: setting, evidence, interpretation and compliant estimate. Once you can do that, the language stops doing your thinking for you.
This is general educational information about terminology. It contains no recommendations.
Who defines geological time, and what do the Precambrian terms actually mark?
There is an official chart, which is reassuring. The International Commission on Stratigraphy (ICS) publishes the International Chronostratigraphic Chart, the reference for unit names. It nests time into divisions: eons contain eras, and eras contain periods.
The current formally identified version is 2024/12, issued in December 2024 and attributed to Cohen, Finney, Gibbard and Fan. The ICS site also shows a 2026/06 static presentation, but the underlying version is still 2024/12.
The deeper you look at the Precambrian boundaries, the less fixed they become. Some boundaries are set by a GSSP (Global Boundary Stratotype Section and Point), which is a physical reference point in a specific rock section. Others are set by a GSSA (Global Standard Stratigraphic Age), which is simply an agreed numerical age. “Ma” means millions of years ago.
Conventions, not rock markers The bases of the Archean and Proterozoic are agreed numbers (GSSAs), not boundaries pinned to a ratified rock section.
The USGS 2026 Divisions of Geologic Time uses the same broad boundaries and states that the Archean, Proterozoic and most of their subdivisions are numerically defined. Those numbers can be revised, so when a report quotes an age or boundary, check it against the current chart and note which version the report cites.
When a report quotes an age or boundary, you can check it directly against the International Chronostratigraphic Chart, which lists every unit name, numerical age and stated uncertainty, and shows which version of the chart the report is relying on.
When big ASX news breaks, our subscribers know first
How do geologists know how old a rock or a gold event is?
Start with the intuitive idea that lower layers are older and upper layers younger. That is stratigraphy, and it works until folding, faulting or tectonic repetition flips or stacks the sequence. Cross-cutting relationships add a second rule: a vein, dyke or fault that cuts a rock is younger than the rock it cuts.
Those methods give order, not numbers. For numbers, geologists use radiometric dating, which measures how far a radioactive parent element has decayed into its daughter product.
U-Pb zircon: the common tool for the crystallisation age of igneous rocks
Baddeleyite and monazite U-Pb: used where zircon is absent, or to date metamorphic and hydrothermal events
Ar-Ar and K-Ar: often record cooling or alteration rather than host-rock crystallisation
Re-Os: useful for dating sulphides
Rb-Sr and Pb-isotope methods: sensitive to later resetting
Fossils: useful mainly for younger sedimentary rocks
The mineral dated decides what the date means.
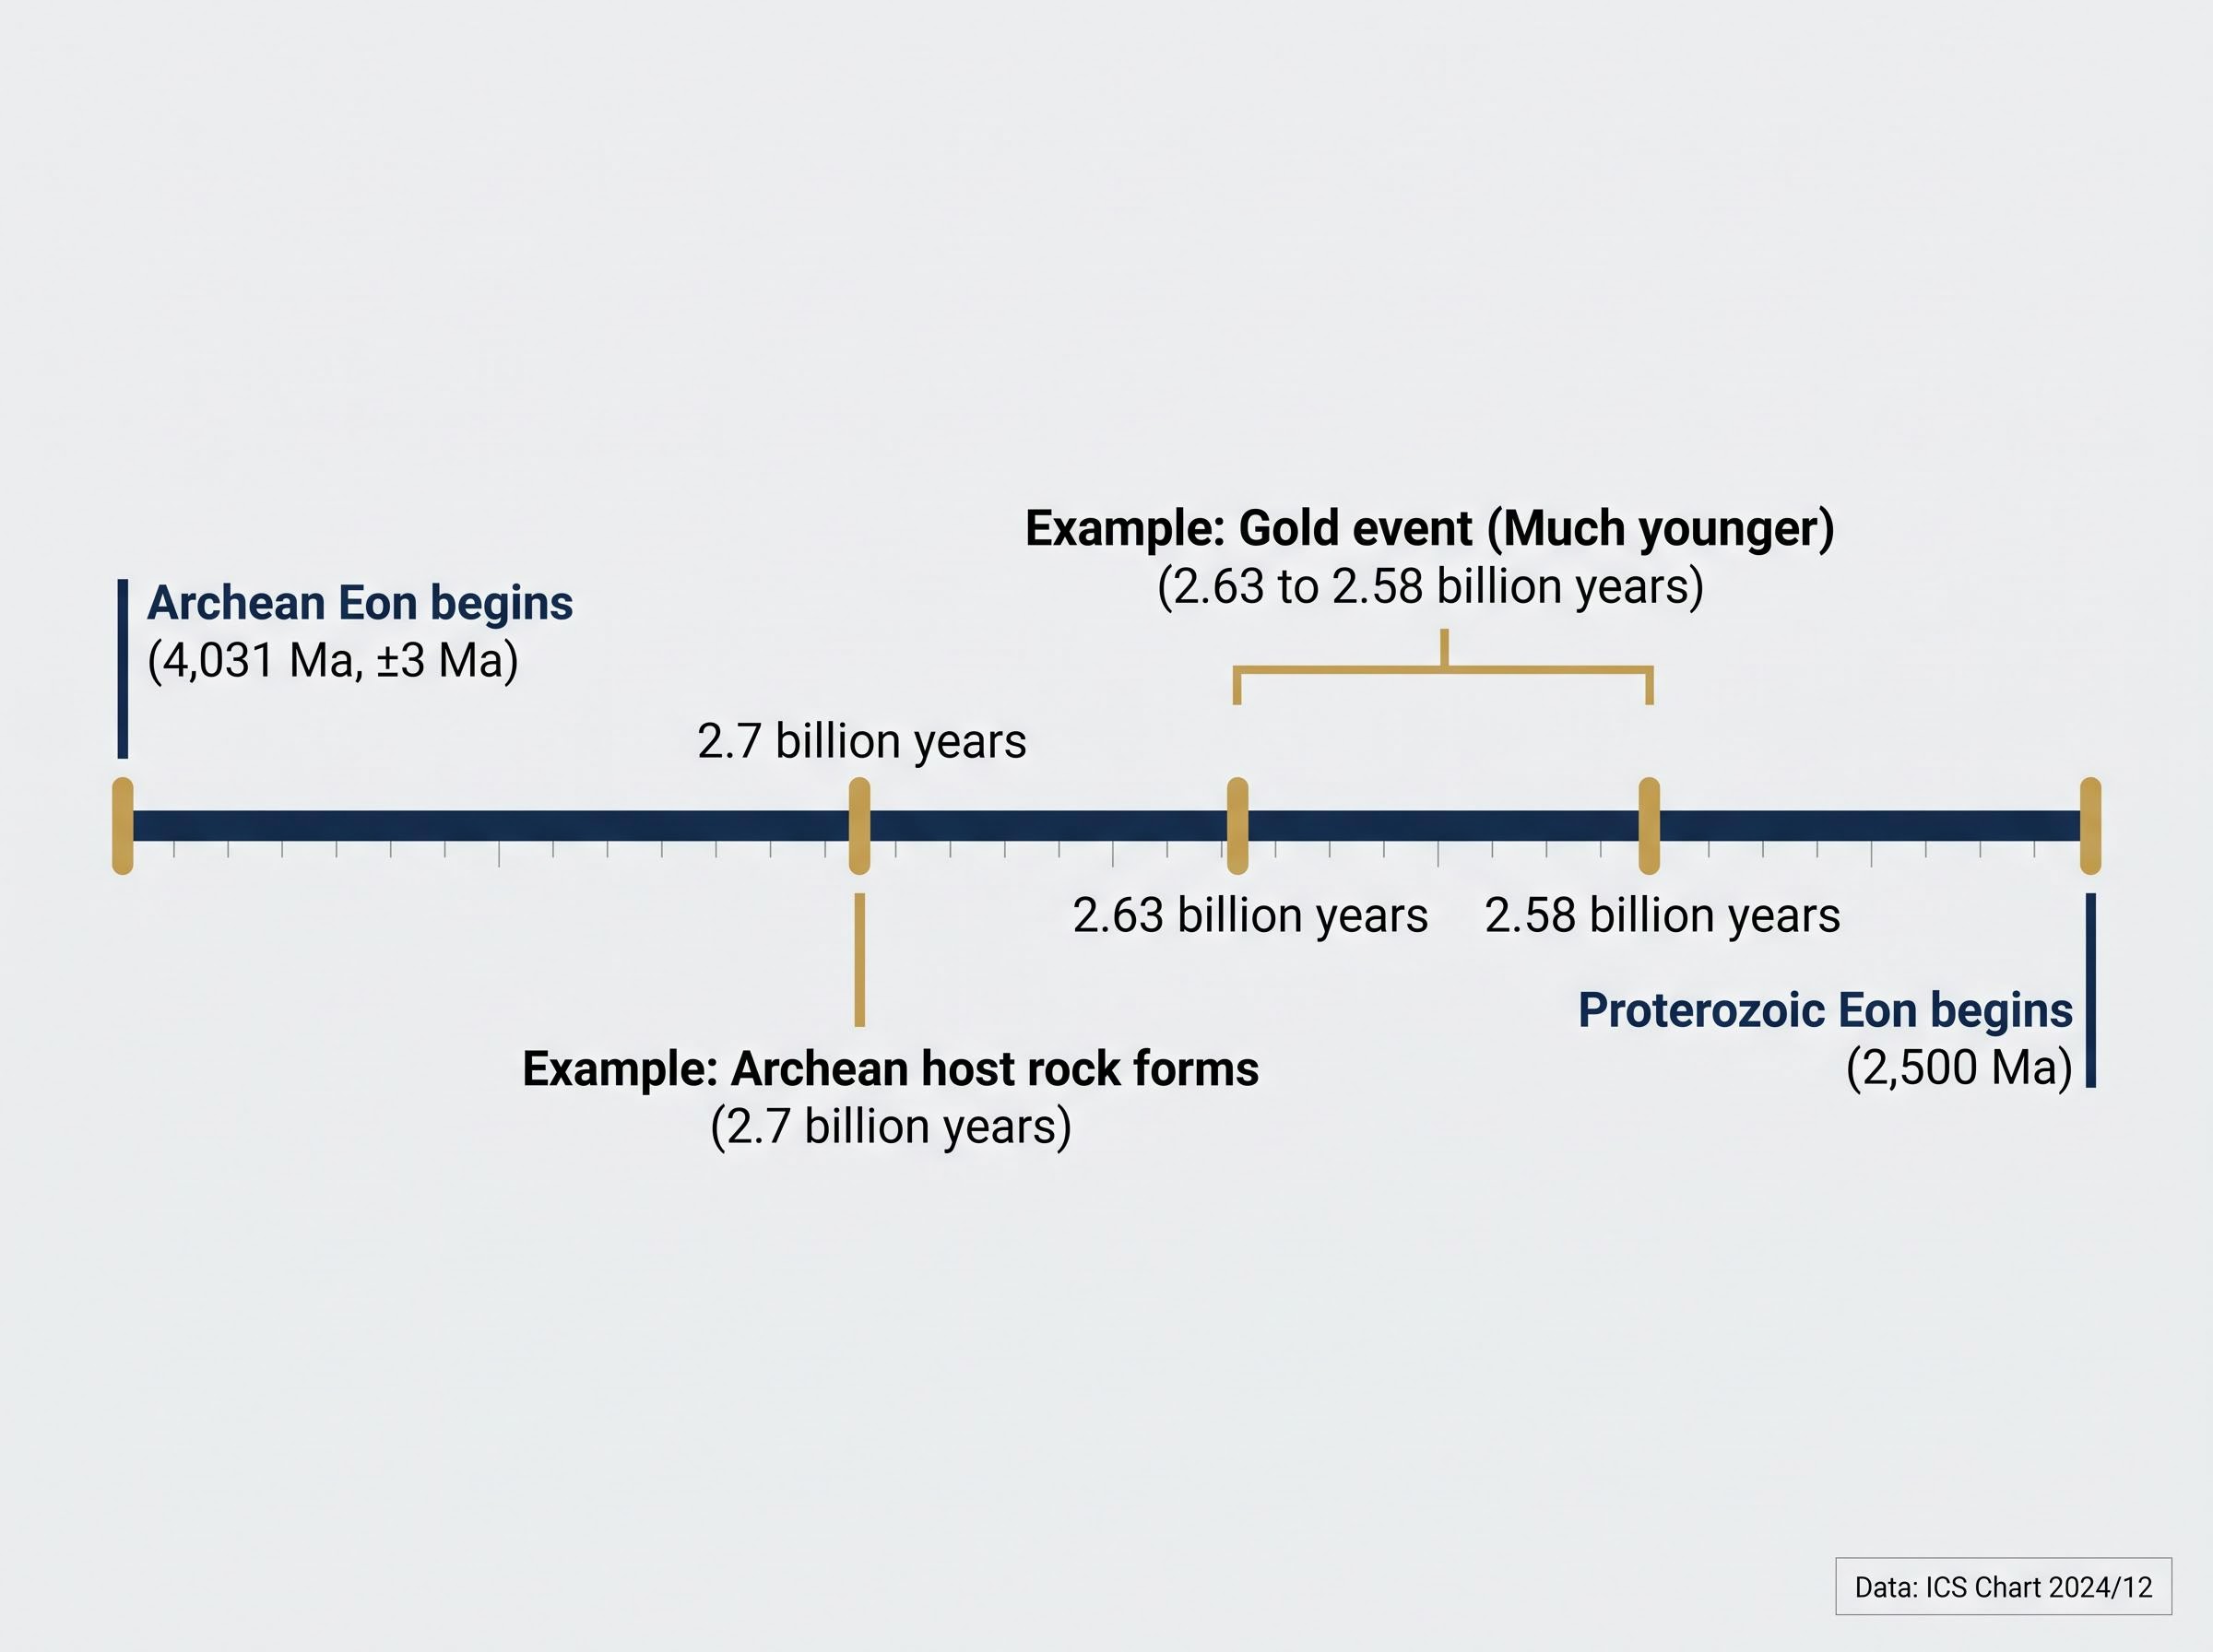
A property can sit in a roughly 2.7-billion-year-old Archean belt while the gold event is, for example, 2.63 or 2.58 billion years old, or much younger. The age you read in a report may be one of several separate ages, so ask which mineral was dated and which event that date represents.
What do Archean, Proterozoic, greenstone belt and orogenic gold mean in a company report?
With the chart and dating methods in hand, the common report terms become easier to read. Each one adds a layer of context.
Archean: the eon from 4,031 Ma to 2,500 Ma, covering some of the oldest preserved rocks
Proterozoic: the eon that follows, beginning at 2,500 Ma
Greenstone belt: a package of volcanic and sedimentary rocks typical of Archean terrains
Orogenic gold: a structurally controlled, metamorphic-hydrothermal deposit type formed where crustal plates accrete or collide
Time, rock package, deposit style. These categories overlap, but they are not the same thing. According to a 2001 USGS synthesis, orogenic gold formed episodically from the Middle Archean through the younger Precambrian and continuously in the Phanerozoic, spanning more than 3 billion years. Archean-hosted gold, orogenic gold and gold in greenstone belts should not be treated as one category.
Scale figures need care too. A 2024 Frontiers editorial, citing the Goldfarb-Groves literature, puts orogenic gold at roughly one-third of global gold production. An older review gives about 75% of global gold reserves, but production and reserves measure different things and the figures depend on the source. No authoritative recent survey gives a share for Archean-hosted gold alone.
Precambrian geology and metal deposits are linked through preservation and tectonic setting as much as age, which is why you should treat any headline share of global gold hosted in Archean crust as an estimate rather than a measured inventory.
Setting, not size “Archean greenstone belt” describes geological context. It is not proof of an economic deposit.
All three layers describe setting rather than quantity. When you see the phrase, treat it as a reason to ask questions, not as an answer.
Why do certain deposit types cluster in certain ages and settings?
The commonly cited orogenic gold model works as a chain of cause and effect:
A convergent orogen develops major faults and shear zones.
Buried, heated rocks release hydrothermal fluids.
Those fluids rise through crustal-scale faults.
Changes in pressure, temperature and chemistry destabilise dissolved gold.
Gold precipitates in structural traps such as veins, fold hinges and fault bends.
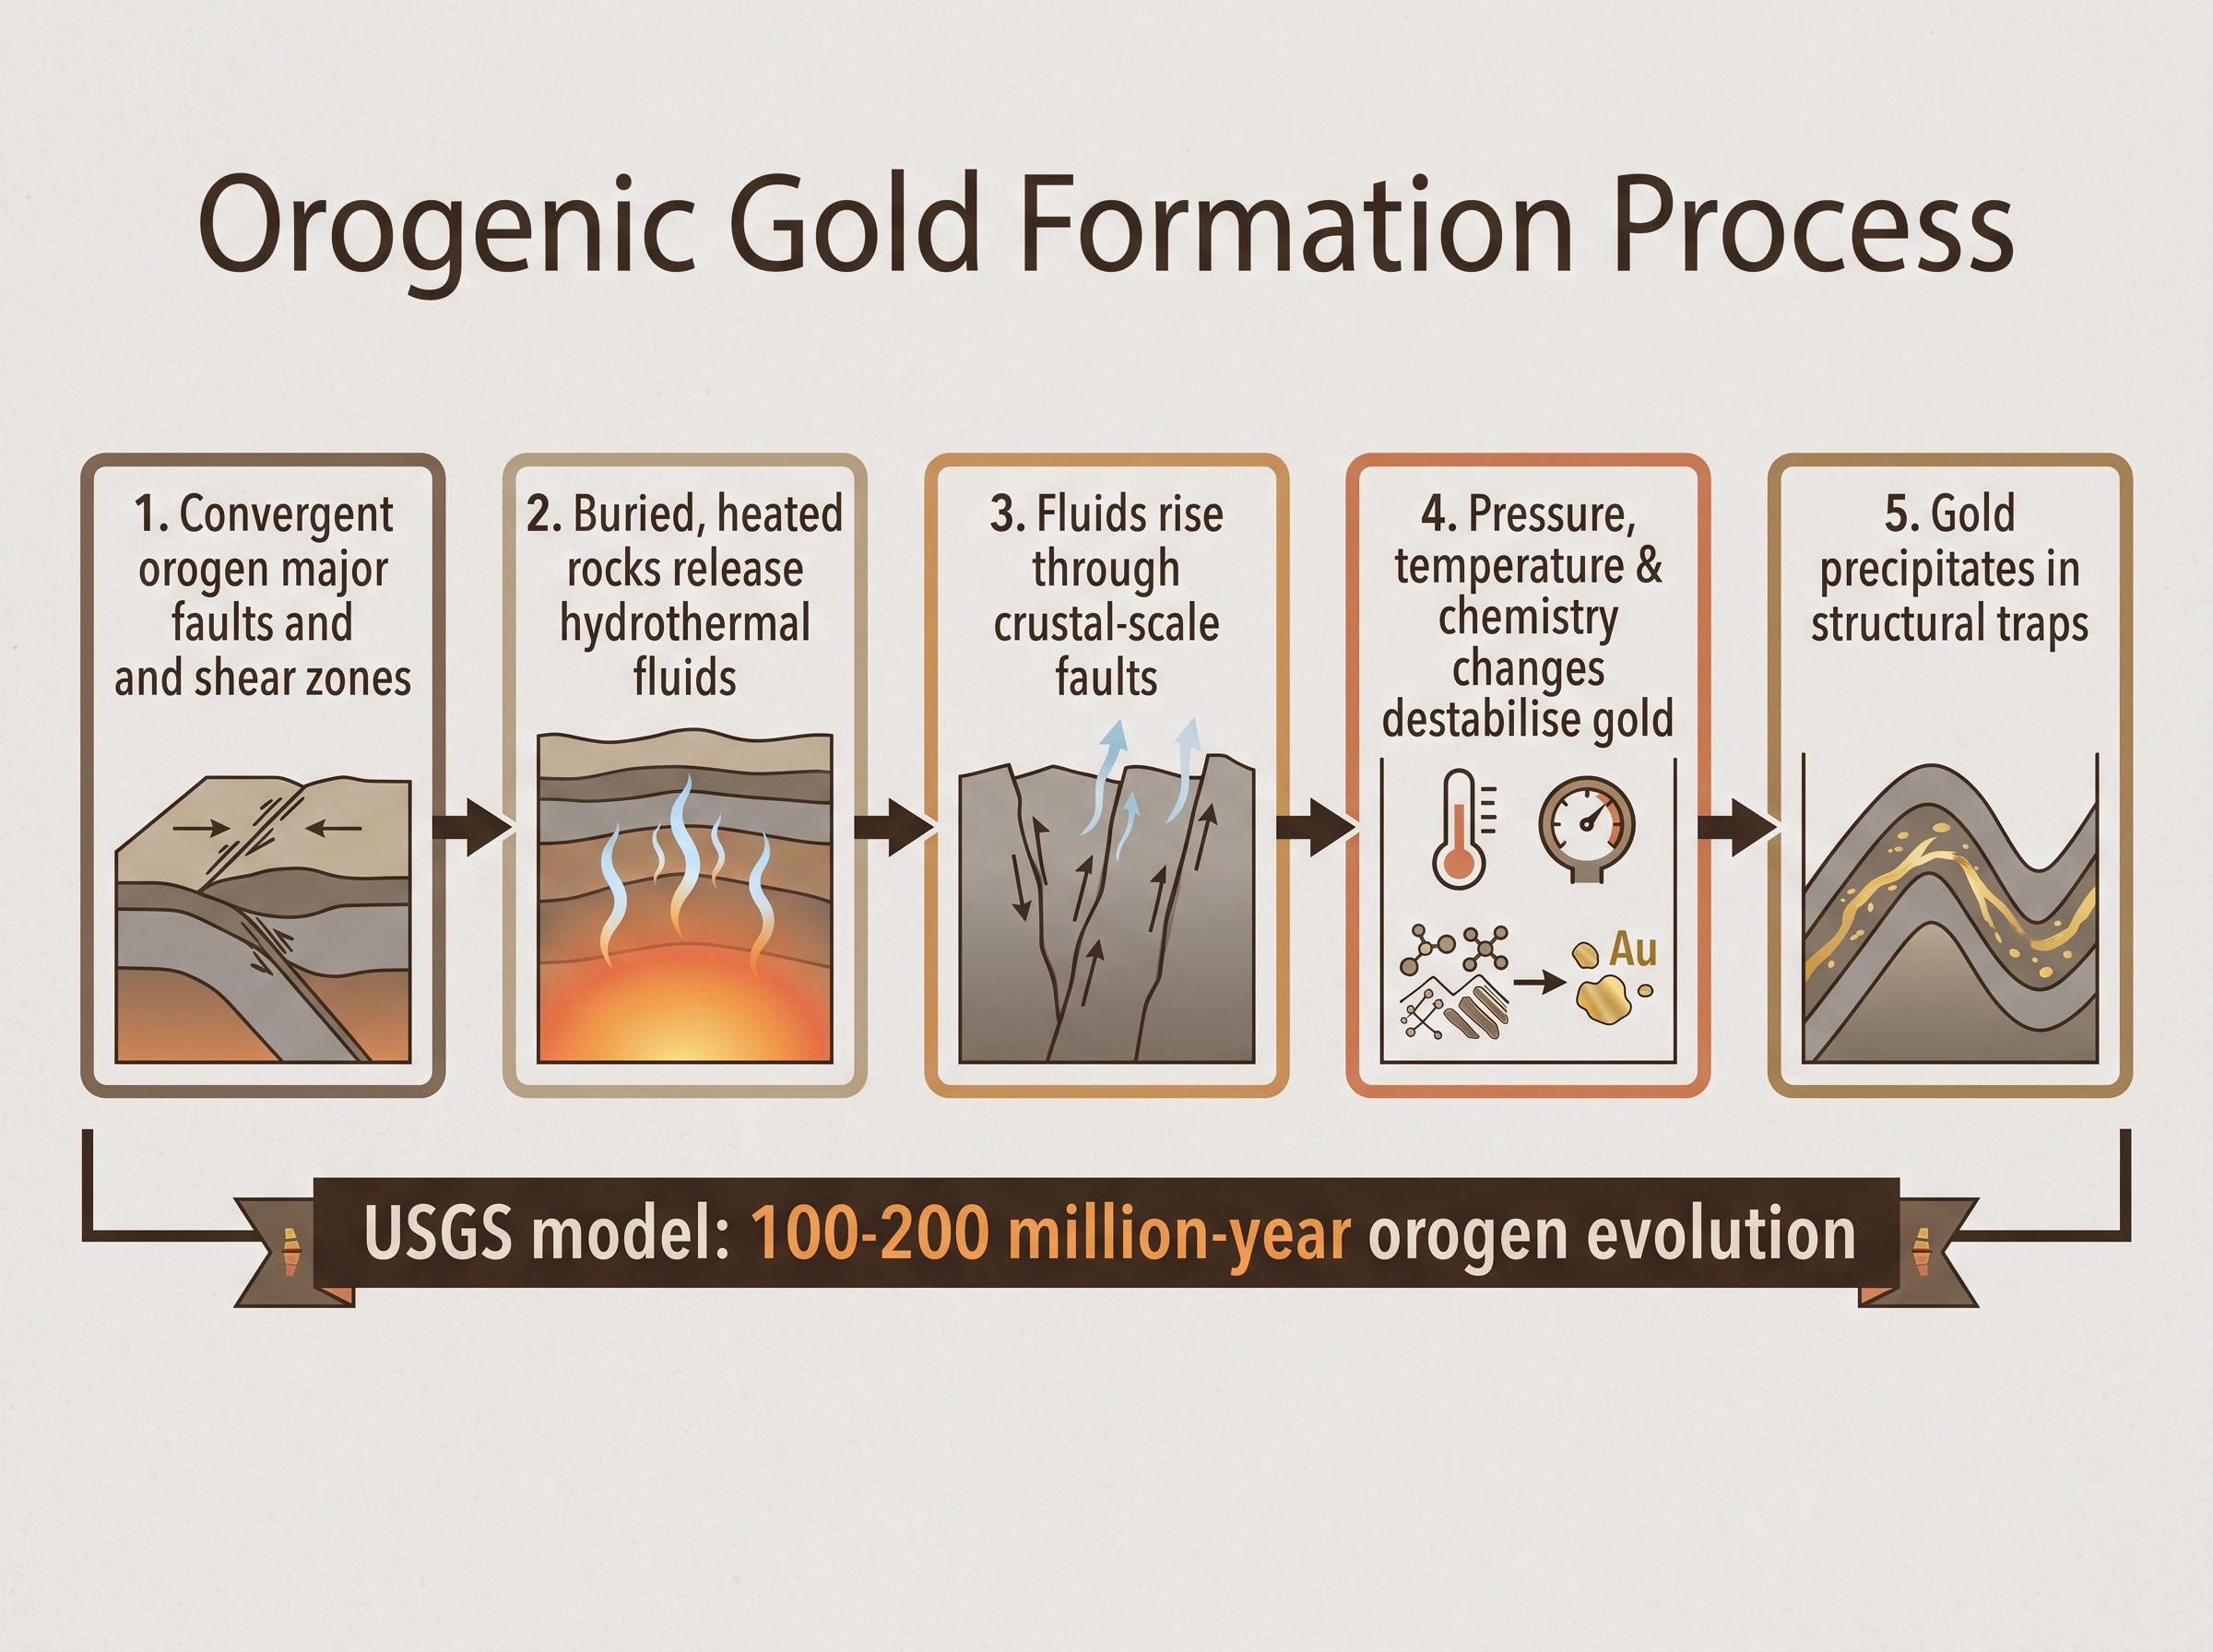
Timing follows from the model. USGS work describes mineralisation commonly arriving toward the end of a 100-200 million-year orogen evolution. In the Yilgarn Block of Western Australia, the USGS (2000) found gold generally formed about 40-90 million years after the youngest widespread basic-ultrabasic volcanism, with most deposits forming about 60-70 million years afterward.
That gap is the point to keep. The host belt and the gold were separate events, so a careful report should date the ore event, not only the belt.
Greenstone belts are considered favourable because they combine rocks with contrasting properties, long-lived faults, iron-rich and sulphide-bearing units, nearby heat sources and stable cratons that help preserve deposits. The USGS (2001) identifies roughly 2.8-2.55 billion years ago as an exceptionally favourable interval for orogenic gold-vein formation.
Where the fluids and metals come from is still debated
Geologists propose several sources: metamorphic fluids (the traditional view), mixed crustal reservoirs, a magmatic contribution, and mantle or deep fluids for some systems. A 2025 paper argues that crustal processes better explain the distribution of Archean greenstone gold. It points out that the Yilgarn is mostly granite, yet only a small share of its gold sits in granite. The model is still being tested, so treat a company’s choice of model as its working hypothesis.
The next major ASX story will hit our subscribers first
How can you tell a geological description from a resource estimate?
Imagine an update that reads: “The property lies within an Archean greenstone belt, drilling intersected visible gold, and the structural setting is favourable and analogous to major camps.” It sounds substantial. Sort it into four categories:
Geological setting: Archean greenstone belt
Observed evidence: visible gold in drill core
Interpretation: “favourable” and “analogous”
Compliant estimate: none
Only one category measures quantity Only the fourth category is a formal quantity-and-grade estimate.
The reporting codes set the rules. The JORC Code 2012, published 20 December 2012 and mandatory in Australia from 1 December 2013, is still the current edition. Canada’s NI 43-101, current consolidated version effective 9 June 2023, requires a Qualified Person and disclosure of the effective date of estimates. A 2025 Canadian Securities Administrators proposal to replace it had not been adopted as of today, 1 November 2026.
The CRIRSCO template (November 2019) states that Exploration Results are not part of a Resource or Reserve declaration, and that deriving tonnage and grade from unclassified mineralisation is inappropriate. ASIC has warned that Exploration Targets and Inferred Resources are too uncertain to support a production target or imply economic viability.
Wording that signals interpretation
Words such as “favourable”, “prospective”, “potential” and “analogous to” are interpretation, not measurement. Visible gold and single high-grade intercepts show gold is present, but they do not establish continuity, average grade or tonnage. If you read Australian announcements, remember the financial year runs 1 July to 30 June.
For readers wanting to see how a tonnage-and-grade figure is built, our comprehensive walkthrough of mineral resource estimation covers the five steps from drill data to a classified estimate.
Building a checklist for the next exploration update you read
The habits from each section fit into a short set of questions:
Which chart version is cited? Check quoted boundaries against the current ICS chart.
Which mineral was dated? Host-rock age is not ore age.
Is this a setting label? Archean, greenstone and orogenic describe context, not size.
Is there a compliant estimate in this announcement? Sort each sentence into setting, evidence, interpretation or estimate.
Take these questions to the next announcement or technical report you open. You will quickly see how much is observation, how much is interpretation, and whether a formal estimate appears at all. This is general educational information, not financial advice, and it contains no recommendations.
This article is for informational purposes only and should not be considered financial advice. Investors should conduct their own research and consult with financial professionals before making investment decisions.