
Generation of secondary vortices from collinear STOV collisions
When two STOV pulses, E1 and E2, carrying charges ℓ1 and ℓ2, collide in both space and time, their superposition Etotal = E1 + E2 can exhibit new phase singularities SV1 that go beyond those found in a single beam. Secondary vortices arise at points where the total field amplitude vanishes, and the phase becomes undefined. Geometrically, these singularities correspond to the intersection of the real and imaginary components of the field on sign-changing surfaces (see in Supplementary S1). In other words, if the real part of Etotal changes sign on one surface, and the imaginary part similarly changes sign on another, their intersection forms a trajectory of zero intensity and undefined phase—a topological singularity.
This phenomenon is analogous to phenomena in classical and quantum mechanics, as illustrated in Fig. 1a, b. The collision of two vortices effectively creates a network of sign-changing nodes within the three-dimensional spatiotemporal volume. Crucially, the number of secondary vortices is set by the difference in input charges, N = ∣ℓ2 − ℓ1∣, with each core carrying a unit topological charge. For example, when STOV pulses with ℓ1 = +3 and ℓ2 = −3 collide, N = 6 secondary vortices are generated (see Fig. 1c). In the spatiotemporal plane (for instance, a slice through the x–t plane of the pulse overlap, as shown in Fig. 1c, d), the azimuthal angles of the total field undergo N distinct 2π phase jumps, resulting in N intensity dips. These dips are equidistant in the spatiotemporal plane, spaced by Δθ, forming a comb-like structure in the spatiotemporal domain, see Fig. 1e. This structure is coupled onto the spatiotemporal plane, exhibiting a hollow, periodic, comb-like pattern which we term the Spatiotemporal Hollow Comb (STHC), in analogy with an optical frequency comb.
Fig. 1: Schematic illustrations of vortex collision phenomena in different contexts.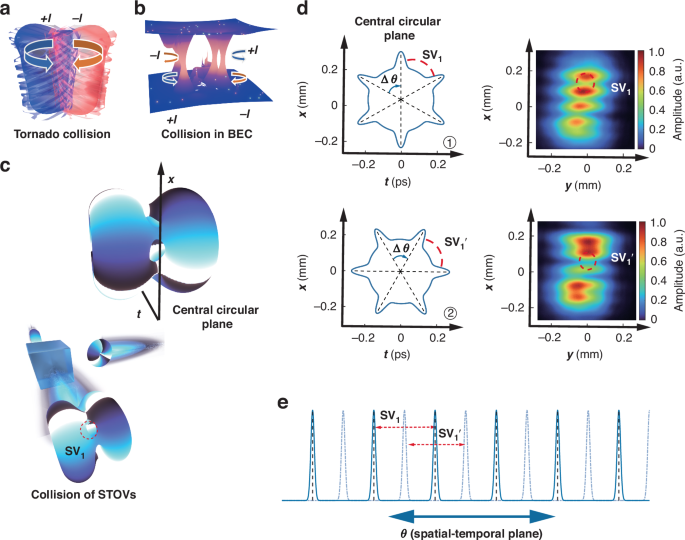
a Collision of tornadoes, b collision in Bose-Einstein condensates (BECs)57,58, and c symmetric collision of two STOVs with opposite topological charges (ℓ = ±3), illustrating the formation of a secondary vortex array. d Geometrical arrangement of the central circular plane with an angular shift Δθ and the secondary vortex SV1. As the phase difference between the two optical vortices changes, Δθ and SV1 rotate to a new position on the spatiotemporal plane. Correspondingly, the positional variation of the SV is observed in the x–y plane. e Temporal intensity profile of the secondary vortices formed during the STOV collision. The figure highlights the fundamental dynamics of vortex interactions across different systems and provides insight into the creation of complex vortex structures in optical fields
The offset, defined as the relative phase difference between the two STOV beams, plays a critical role in modulating the secondary vortices. This offset has a similar effect to the concept of offset in traditional optical frequency combs, as shown in Fig. 1e, where it causes a shift in the comb teeth. Each incremental change in Δθ produces a measurable rotation of the entire vortex lattice in the x–t plane and a concomitant periodic modulation of the integrated x–y intensity. In our experiments (as in the two configurations depicted in Fig. 1d), we held the initial phase of one STOV fixed, varied that of the other, and recorded a pronounced topological displacement. The phase-offset control provides remarkable tunability, enabling us to shape secondary-vortex arrays into a variety of dynamically changing configurations40,41,42. Adjustments to the phase on a subwavelength scale result in macroscopic lattice rotations, revealing a potent method for tailoring structured light on ultrafast timescales and for directing light-matter interactions with extraordinary precision.
To better convey the ensuing analysis, the electromagnetic field of a STOV is defined as follows24:
$$\begin{array}{l}\tilde{E}={E}_{0}{A}_{0}{[{(\xi /{w}_{\xi })}^{2}+{(x/{w}_{x})}^{2}]}^{| \ell | /2}\\ \quad \times \exp [-({x}^{2}/{w}_{x}^{2}+{y}^{2}/{w}_{y}^{2}+{\xi }^{2}/{w}_{\xi }^{2})]\\\quad \times \exp [i(-\ell {\varphi }_{{\rm{st}}}+{\omega }_{0}t-{k}_{0}z+\phi )]\end{array}$$
(1)
Here ξ = ct − z is a longitudinal coordinate local to the pulse, c denotes the group velocity of light, E0 is the peak electric field strength, ϕ is an additional phase of the vortex beam, A0 is a normalization constant, and wξ and wx represent the spatial scale widths. For a circular spatial profile, we assume wx = wy = r, where r denotes the beam waist radius. \({\varphi }_{{\rm{st}}}={\tan }^{-1}\left(\frac{x{w}_{\xi }}{\xi {w}_{x}}\right)\) is the azimuthal angle in the space–time plane (or x–ξ plane), and ω0 and k0 are the center angular frequency and wave number, respectively. The spatiotemporal trajectory of the singularity, formed by the interference of two STOVs, is governed by two factors. First, it is confined to a surface defined by the condition ∣E1∣ = ∣E2∣. Second, its specific directional orientation on that surface is determined by the phase relationship \(\arg ({E}_{1})-\arg ({E}_{2})=(2k+1)\pi\).
The surfaces resulting from the overlap of two STOVs satisfy the following condition:
$$\left[\left\vert {\ell }_{1}\right\vert \ln (u)-2u\right]-\left[\left\vert {\ell }_{2}\right\vert \ln (v)-2v\right]=2{(y+d)}^{2}/{w}_{{y}_{1}}^{2}-2{(y-d)}^{2}/{w}_{{y}_{2}}^{2}$$
(2)
where \(u=\frac{{x}^{2}}{{{w}_{x1}}^{2}}+\frac{{\xi }^{2}}{{{w}_{\xi 1}}^{2}}\), \(v=\frac{{x}^{2}}{{{w}_{x2}}^{2}}+\frac{{\xi }^{2}}{{{w}_{\xi 2}}^{2}}\), and ξ = ct − z.
Furthermore, the formation of secondary vortices requires the fulfillment of the phase sign-changing condition. A STOV possesses a spatial coordinate and a temporal coordinate that describe its spatiotemporal helical phase. The azimuthal angle of the collision between two STOVs in the spatiotemporal plane (e.g., the x–t plane) can be expressed as:
$${\varphi }_{{\rm{st}}}=\frac{(2n+1)\pi -({\phi }_{1}-{\phi }_{2})}{{\ell }_{2}-{\ell }_{1}}$$
(3)
where N = ∣ℓ1 − ℓ2∣ describes the number of secondary vortices. This equation describes the position of the intensity dips in the wave packet at the same y-coordinate for both STOVs. In fact, when there is no phase difference between the two STOVs along the y-direction, the overlapping region will give rise to well-defined intensity minima at corresponding positions on the x–t plane. In these surfaces, we lock the phase singularities, observing their distribution in both time and space.
Figure 2a reveals the generation of secondary vortices during the collision of a symmetric topological charge double-STOV pair (ℓ1 = −1, ℓ2 = +1). In the experiment, we use a laser with a central wavelength of 1030 nm and a pulse duration of 170 fs. STOVs generated via SLM phase mask encoding in a dual-channel 4f pulse shaper are controlled by the helical phase topological charge loaded onto SLM1/SLM2 (Holoeye GAEA-2). Spatiotemporal slices were reconstructed from the interferograms generated between a reference Gaussian beam and spatially resolved sections of the beam, which were sampled using a one-dimensional scanning slit. The intensity between the two STOV beams varies with the slit position. The spectral information of the double STOV exhibits variations at different spatial positions. The slices at different positions reveal the evolution of the vortex and the location of the corresponding secondary vortex. Using spatio-spectral interferometric measurements, we reconstruct the spatiotemporal domain, achieving the reconstruction of the dynamic evolution of the superposition mode between the ℓ1 = −1 and ℓ2 = +1 topological charge beams as a function of their relative phase. Figure 2b, c shows the reconstructed three-dimensional spatiotemporal field distribution of the secondary vortex resulting from the collision of a vortex-antivortex pair (ℓ1 = −1, ℓ2 = +1). Figure 2d shows the reconstructed intensity distribution in the x–t plane, obtained from different spatial slices. The experimental setup and reconstruction process are described in more detail in the “Methods and materials” section.
Fig. 2: Generation and characterization of secondary vortices from STOV collisions.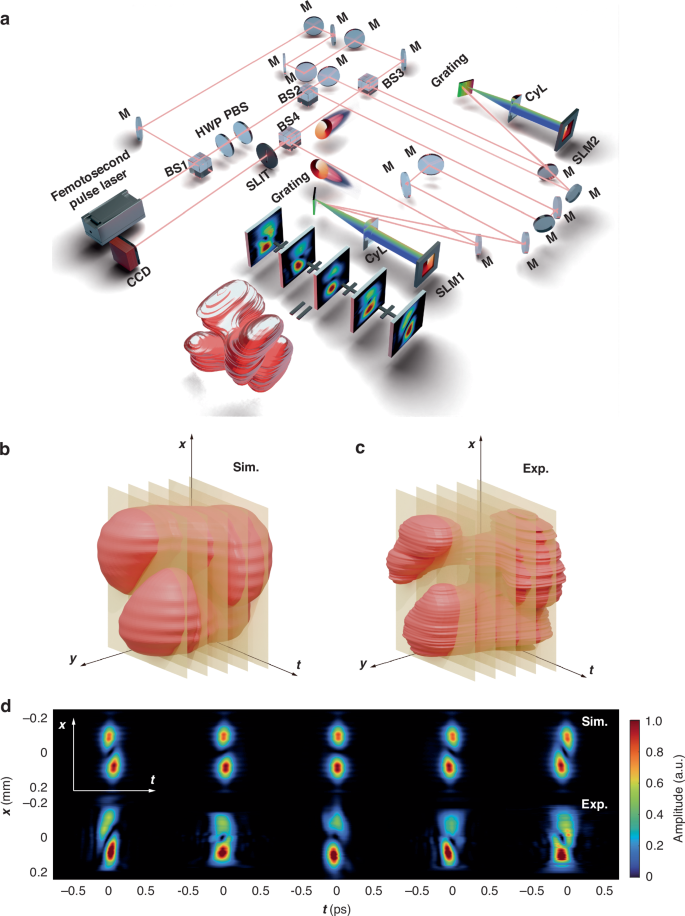
a Experimental setup for generating colliding STOVs. Parameters: Femtosecond pulse laser: 1030 nm, 200 kHz, 170 fs; HWP: Half-wave plate; PBS: Polarization beam splitter; BS: Beam splitter; M: All Mirrors HR @ 1030 nm; 2D pulse shaper: Grating, CyL (Cylinder Lens), SLM (Spatial Light Modulator). b, c Measured and simulated 3D spatiotemporal field distributions resulting from the collision of a vortex-antivortex pair (ℓ1 = + 1, ℓ2 = − 1). d Comparison of reconstructed field slices from experiment and simulation at different slit positions
By tuning the overlap η and beam waist r, we steer the phase-singularity trajectories and define three collision regimes: symmetric, mismatched, and fully overlapping. In the case of symmetric interference, where the topological charges of the two pulses are opposite (ℓ1 = +3 and ℓ2 = −3), six secondary phase singularities appear at the center of the overlap, forming a symmetric vortex array. These secondary vortices are confined to the x–t plane (as shown in the left panels of Fig. 3a, b), with the vortex trajectories lying in the plane of collision. When the parameters are mismatched, such as differences in beam waist radius r, a radial phase gradient is created. This causes the secondary singularity trajectory to bend toward the smaller spot region, resulting in curved phase singularity lines as the intensity gradient drives the secondary vortices toward the smaller focal area. The secondary vortices therefore escape a single-plane confinement and fan out through the full three-dimensional field (see in Supplementary S1), with the coordinate planes largely spared, as illustrated in the central panels of Fig. 3a, b. Parameter mismatch thus elevates the collision’s complexity, making vortex motion fully three-dimensional and far less predictable. When there is perfect overlap (η = 100%), the two pulses generate identical vortices that give rise to a six-lobed structure. This configuration results from the angular interference of the vortices, analogous to the phenomenon observed in superposition states. Here, the secondary vortices are primarily oriented along the y-axis, as illustrated at the right side of Fig. 3a, b, thereby establishing a distinct pattern aligned with the beam axis.
Fig. 3: Three distinct situations of collision of STOVs.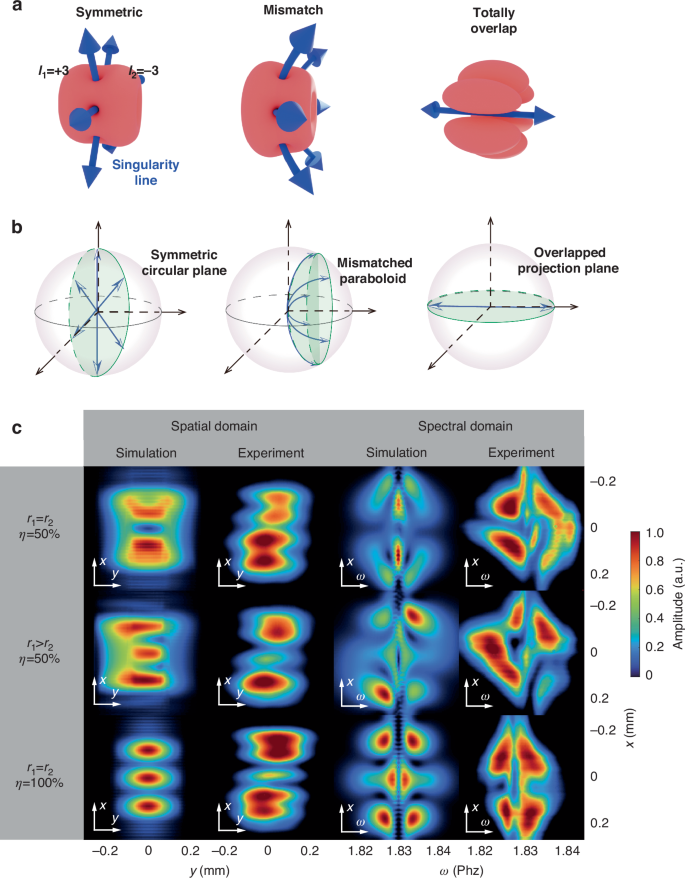
a Schematic representation of the collision between two STOVs with topological charges ℓ1 = 3 and ℓ2 = − 3, illustrating the singularity line. b Polar plots showing the angular positions of the topological singularities under different conditions. c Simulation and experimental results in the spatial domain (left) and spectral domain (right), showing the evolution of secondary vortices under different overlap conditions. The first row shows equal beam waist radius and 50% overlap, resulting in symmetric secondary vortices. The second row shows mismatched beam waist radius and intensity ratios. The third row shows 100% overlap, leading to a petal-shaped interference pattern
In our investigation of STOV collisions, we found that analyzing the interactions in the spectral domain offers significant advantages. Figure 3c showcases our experimental results, where the spectral patterns reveal highly distinct and unambiguous signatures for each of the three collision conditions. This remarkable clarity stems from the inherent stability of the STOVs’ spectral representation. The core structural information encoded in the relative phases of the frequency components is largely preserved. This intrinsic invariance means the spectral domain provides a robust and faithful fingerprint of the interaction, regardless of propagation distance43,44. Consequently, the spectral domain serves as an ideal platform for quantitative analysis and the differentiation of subtle physical phenomena. This is powerfully demonstrated by the excellent agreement between our experimental measurements and theoretical simulations, which validates the high precision and reliability of our approach.
Spatiotemporal optical coil and intensity-induced chirality
More interestingly, when two STOV beams are oriented at a certain propagation angle, they give rise to a coil-like structure. This small collision angle can be approximated as one STOV pulse acquiring a linear phase gradient along the transverse direction (e.g., y-axis) relative to the other. This introduces an additional y-dependent term to their relative phase difference: Δϕy = kyy, where ky is the phase variation rate proportional to the collision angle. The total phase difference thus becomes a function of y: ΔΦ(y) = (ℓ2 − ℓ1)φst + (ϕ1 − ϕ2) + kyy. Substituting this phase difference into the destructive interference condition ΔΦ(y) = (2n + 1)π yields an equation coupling the spatiotemporal angle φst and spatial coordinate y:
$$y=\frac{1}{{k}_{y}}\left(({\ell }_{1}-{\ell }_{2}){\varphi }_{{\rm{st}}}+(2n+1)\pi -({\phi }_{1}-{\phi }_{2})\right)$$
(4)
The equation describes a three-dimensional helix (or multi-stranded helix). It reveals that the trajectory of secondary vortices in the 3D spatiotemporal space (x, y, ξ) no longer lies within a single plane but instead forms a helical structure—termed a STOC. The two primary geometric properties of this optical coil—the number of helical arms and the pitch—are directly governed by the initial collision parameters. The number of distinct helical arms is determined by the topological charge difference, N = ∣ℓ2 − ℓ1∣, corresponding precisely to the number of secondary vortices, generated in the collinear case. Meanwhile, the coil’s pitch, which defines its longitudinal period, is dependent on both the collision angle and the topological charge difference. The pitch is inversely proportional to the transverse wavevector component ky, meaning that a larger collision angle produces a tighter, more densely wound coil. Conversely, the pitch is directly proportional to the topological charge difference (ℓ2 − ℓ1), indicating that a greater charge difference results in a more stretched, elongated helical structure. This phenomenon closely resembles the coil structure produced by electrons in vortex light fields, where the chiral nature of the coil is manifested in the intensity distribution, rather than solely relying on phase chirality. Since three-dimensional structured light fields possess rich degrees of freedom, when the directions of the two colliding STOVs are not collinear, the additional phase difference is introduced in the overlapping regions of different spatiotemporal positions. This phase difference results in an interference structure that forms a grid-like pattern, both in the spatiotemporal plane and the spatial plane.
In Fig. 4a, we show a schematic diagram of the collision process between two STOVs at an angle. The two STOVs are slightly non-collinear, intersecting at a small crossing angle of 1∘, and thereby generating a phase gradient along the y-direction. Figure 4b, c shows the STOC formed by two STOVs with topological charges of ±1 and ±3, respectively. The resulting central STOC behaves like a multi-arm spiral: the number of helical arms scales linearly with ∣ℓ1 − ℓ2∣, producing a double helix for the ±1 pair and a six-arm helix for the ±3 pair (Fig. 4b, c). Unlike the STHC in Fig. 1, where helicity appears mainly in 2-D projections such as x–y or y–t—the present coil spins throughout the full x–y–t volume.
Fig. 4: Schematic diagram and experimental results of STOC.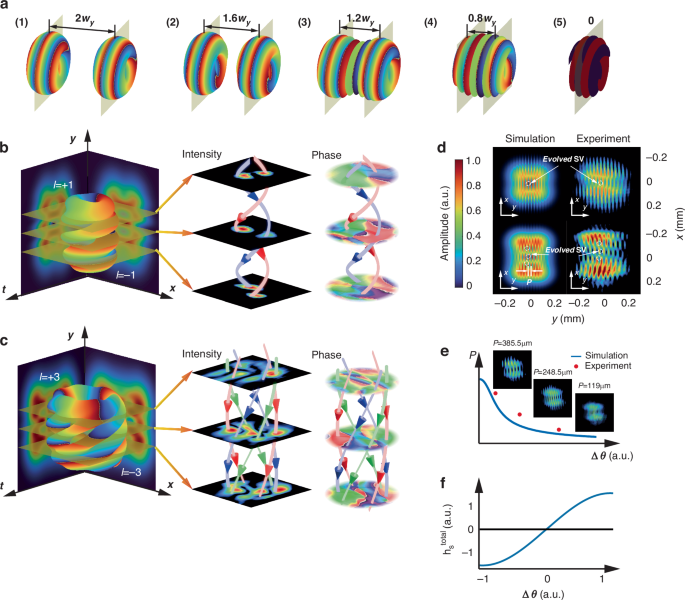
a Formation of an STOC through the collision of two non-collinear STOVs. Panels (1)–(5) illustrate this process as the initial separation between the STOVs progressively decreases. b STOC from ℓ = ±1 STOVs, showing rotating intensity and phase distributions in transverse cross-sections. c STOC from ℓ = ±3 STOVs, exhibiting a different helical rotation with more intertwined helices than the ℓ = ±1 case. d Spatially integrated intensity patterns for ℓ = ±1 (top) and ℓ = ±3 (bottom) STOCs, revealing clear forked fringes in simulations and experiments. e The STOC’s pitch P, i.e., fringe density varying with the angular separation between colliding STOVs, as shown in the graph and inset images. f Variation of hS with the angle between the two STOVs. The positive and negative signs indicate opposite chiral tendencies
To visualize this STOC, adjustable slits are positioned at three different y-coordinates, facilitating tomographic slicing of the spatiotemporal field (Fig. 4d). A moderate slit width is selected to preserve the interferometric signal-to-noise ratio: this choice precisely resolves the double helix for the ±1 scenario, while occasional arm overlap in the ±3 scenario suggests a more complex structure than can be captured by any individual 2D plane. Projecting the field onto the spatial x–y plane (Fig. 4e) unveils a distinctive fringe lattice. Horizontal discontinuities encode the ∣ℓ1 − ℓ2∣ rhythm of the helical arms, whereas the vertical fringe spacing is inversely proportional to the collision angle between the two STOVs, as quantified in Fig. 4f.
Conventional optical chirality arises from polarization or phase and is often characterized by conserved quantities such as Lipkin’s Zilch45,46, defined as:
$$C=\frac{{\varepsilon }_{0}}{2}\tilde{{\boldsymbol{E}}}\cdot (\nabla \times \tilde{{\boldsymbol{E}}})+\frac{1}{2{\mu }_{0}}\tilde{{\boldsymbol{B}}}\cdot (\nabla \times \tilde{{\boldsymbol{B}}})$$
(5)
where E is the electric field and B is the magnetic induction. In contrast to this, our investigation focuses on the chirality inherent to the optical intensity distribution itself. When the field intensity is arranged helically, the energy distribution and energy flow (Poynting vector S, \({\boldsymbol{S}}=\frac{1}{{\mu }_{0}}({\boldsymbol{E}}\times {\boldsymbol{B}})\), μ0 is the permeability of free space) become inextricably coupled, forming a directed field structure that is non-superimposable on its mirror image. Drawing an analogy with helicity in fluid dynamics, we introduce the energy-flow helicity density to quantify this structural property:
$${h}_{{\boldsymbol{S}}}={\boldsymbol{S}}\cdot (\nabla \times {\boldsymbol{S}})$$
(6)
This quantity, hS, directly measures the helical topology of the energy flow. Unlike conventional doughnut-shaped vortex beams, where the energy flux curl is typically orthogonal to the flow direction, yielding a vanishing helicity density (hS ≈ 0), the non-collinear collision in STOCs induces a braiding of energy flow. This results in a non-zero hS, serving as a robust parameter to distinguish this 3D intensity-twisted topology from conventional vortices. This interference-based approach transforms an abstract topological attribute from phase space into a tangible, designable, and engineerable field property. As related research indicates, the essence of chirality can originate from the field’s direct shaping of a particle’s spacetime trajectory. Our helical light field is a physical realization of this concept: it is not only a mathematically rigorous pseudoscalar but also constitutes a geometric driving force that can be directly sensed and responded to by particles. To quantify the global properties of this light field, we can integrate hS over the spatial domain to obtain \({h}_{{\boldsymbol{S}}}^{\,\text{total}\,}\). By varying the magnitude and sign of the angle between the two STOVs, the chirality of the helical light field can be readily controlled, as shown in Fig. 4f. The pseudoscalar nature of hS dictates the selection rules for chiral light-matter interactions. A primary consequence is that a first-order response requires a matching pseudoscalar parameter in the interacting material. This provides a direct experimental test: a hallmark of a chirality-dominated effect is the sign reversal of the response signal upon mirror inversion of the field’s structure. Furthermore, since hS is invariant under time-reversal, it can mediate conservative optical forces and torques, enabling the precise manipulation of particles. The local entanglement of energy flow can therefore not only induce measurable absorption differences in chiral particles but also exert deterministic conservative forces and controllable torques.
In sharp contrast to classical chiral structured light, whose handedness is engineered via spin angular momentum or phase, the chirality here is inscribed directly into the intensity distribution. Put differently, the helicity stems from the three-dimensional torsion of the energy flow rather than from phase or polarization alone. This makes the phenomenon conceptually closer to the current-density-defined chirality of an electronic coil. Physically, the collinear collision (Fig. 5a) creates a series of isolated energy-flow loops, where the local angular momentum is confined around each secondary vortex. When a crossing angle is introduced (Fig. 5c), the resulting phase gradient twists these localized circulations, reconnecting the isolated loops into a continuous helical energy flow that spans the entire wave packet. Increasing the collision angle compresses the helical pitch and thereby boosts the local chiral density, affording new freedom for enantio-selective excitation and high-dimensional information encoding. Driven solely by intensity, this fully STOC establishes a new paradigm for optical chirality—combining the programmability of STOV topology with volumetric richness unattainable in conventional two-dimensional structured light, and opening unprecedented avenues in chiral photonics and beyond.
Fig. 5: Energy flow characteristics in the collision structure formed by ±1 STOV.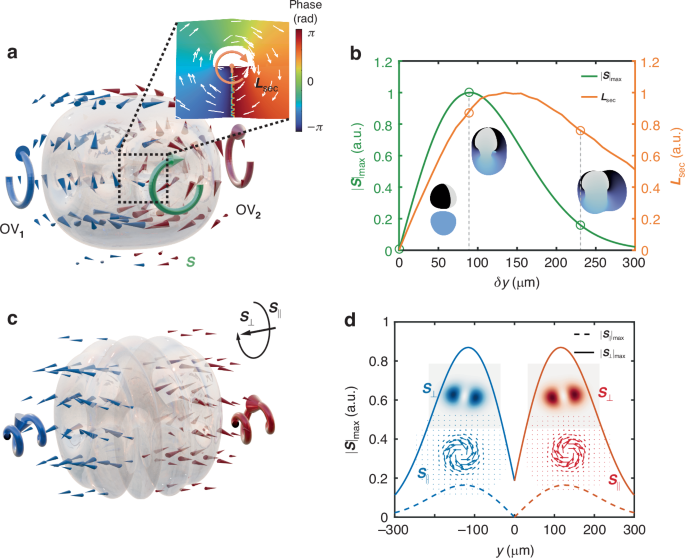
a Energy flow within a ±1 STOV structure, highlighting Poynting Vector \({\boldsymbol{S}}\) and local circulation around total angular momentum \({{\boldsymbol{L}}}_{\sec }\). The energy flow \({\boldsymbol{S}}\) forms isolated local loops circulating around secondary vortices, representing localized angular momentum. b Normalized maximum energy flow \(| {\boldsymbol{S}}{| }_{\max }\) on this plane and total angular momentum \({{\boldsymbol{L}}}_{\sec }\) versus vortex separation δy = 2d, with insets showing corresponding flow patterns. c Visualization of the energy flow’s decomposition within the collision structure of a ±1 STOV pair (1∘ crossing angle), showing how the isolated local loops from (a) are twisted and reconnected into a global helical energy flow by separating the Poynting vector into components parallel (S∥) and perpendicular (S⊥) to the x–t plane. d Profile of the maximum magnitudes of ∣S∥∣ and ∣S⊥∣ along the transverse y-axis. The insets depict how the orientation of the energy flow components varies across different transverse positions
The physical relevance of this intensity chirality is profound. As established in the literature47, the mechanical response of a chiral particle is mediated by its magnetoelectric polarizability, giving rise to an enantio-selective force. Crucially, it can be derived that the component of this force along the direction of energy flow is directly determined by our proposed local chiral density, hS. This establishes a direct physical link from the field’s intensity landscape to the mechanical transfer of chirality, highlighting hS as a parameter for controlling the chiral interaction and manipulation of particles (see in Supplementary S2).
We investigate the maximum energy flux intensity, \(| {\boldsymbol{S}}{| }_{\max }\), in the bisecting plane perpendicular to the initial vortex separation. Simulations reveal \(| {\boldsymbol{S}}{| }_{\max }\) depends on this initial separation, suggesting a controllable mechanism for tuning the resultant optical field’s energy landscape. Structured light’s capacity to exert forces/torques on nanoparticles is linked to its momentum and angular momentum. Secondary vortices, formed during collision, are expected to have unique manipulative capabilities, as shown in Fig. 5a. To quantify this, we examine the optical angular momentum density, l(r):
$${\boldsymbol{l}}={\boldsymbol{r}}\times \frac{{\boldsymbol{S}}}{{c}^{2}}={\boldsymbol{r}}\times \frac{{\boldsymbol{E}}\times {\boldsymbol{B}}}{{\mu }_{0}{c}^{2}}$$
(7)
where r is the position vector in three-dimensional space. To assess a secondary vortex’s specific influence, we compute its total angular momentum, \({{\boldsymbol{L}}}_{\sec }\), within a strategically chosen cylindrical volume \({V}_{\sec }\) (The complete analysis methods for energy flow and angular momentum are described in Supplementary S3). This volume’s axis aligns with the secondary vortex line, and its radial boundary is defined by local intensity maxima confining the vortex. This ensures \({{\boldsymbol{L}}}_{\sec }\) reflects the secondary vortex’s properties relevant for particle interaction.
The total orbital angular momentum \({{\boldsymbol{L}}}_{\sec }\) is obtained by integrating the angular momentum density, l, over the volume \({V}_{\sec }\). The magnitude and orientation of \({{\boldsymbol{L}}}_{\sec }\) quantify the torque the secondary vortex region can exert, offering insights into its efficacy for particle manipulation. Systematic characterization of energy flux and angular momentum properties versus initial collision parameters (e.g., inter-vortex distance, relative topological charges), as demonstrated in Fig. 5b, advances understanding of vortex interactions and novel optical topologies, informing optical trap design and light-based manipulation techniques.
For the spatiotemporal wave packet formed by the non-collinear collision of STOVs, the internal energy flow exhibits a complex structure, comprising not only a forward-propagating energy flux but also a transverse circulation associated with orbital angular momentum. To separate and quantify these components, we perform an orthogonal decomposition of S. As illustrated in Fig. 5c, the total energy flow is decomposed into a propagation component parallel to the spatiotemporal collision plane (the x–y plane), denoted S∥, and a transverse circulating component perpendicular to this plane, denoted S⊥. Here S∥ primarily contributes to the overall forward motion of the wave packet, while S⊥ directly embodies the intrinsic helicity and twist of the optical field and thus serves as the physical root of the intensity-encoded chirality.
The quantitative plot in Fig. 5d further highlights the intrinsic features of these components. A noteworthy property is their antisymmetry: because the constituent STOVs in the vortex pair rotate in opposite senses relative to the crossing angle, both S∥ and S⊥ reverse direction at positions symmetric about the center (±y). Consequently, both components exhibit a double-peaked intensity profile with vanishing magnitude at the geometric center (y = 0), originating from the destructive interference inherent to the singularity generation. Crucially, although the energy-flow vectors are reversed at symmetric positions, the computed local chiral density hS remains identical there, robustly characterizing the field’s chirality as a pseudoscalar. At the geometric center (y = 0), the symmetric contributions destructively interfere, producing a pronounced suppression of both components. Together, these observations indicate that the STOC field’s chirality is fundamentally a dynamic property with a complex spatiotemporal texture in its intensity.