
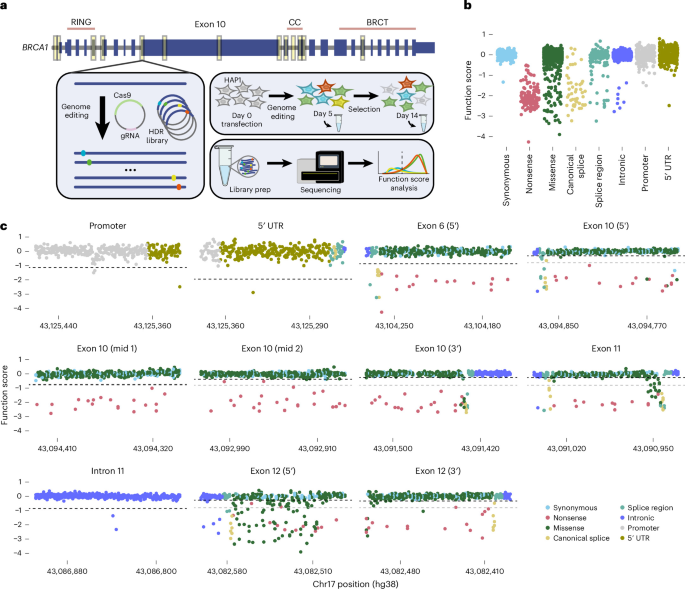
This study complies with all relevant ethical regulations. Ethical oversight is maintained for both UK Biobank and BRIDGES. UK Biobank data were accessed under application 102655, and access to BRIDGES data was approved by the BCAC Data Access Co-ordinating Committee.
HDR library design and cloning
BRCA1 exons, introns, nucleotide and amino acid positions are numbered according to RefSeq transcript NM_007294.4.
Each SGE experiment requires a plasmid expressing a gRNA and an HDR plasmid library that provides a repair template for each SNV. Where possible, libraries were designed in Benchling to be compatible with two independent gRNAs. Protospacer adjacent motif (PAM)-blocking edits not impacting the amino acid sequence were included to prevent Cas9 recutting after successful HDR editing. For 5′ UTR and promoter SGE regions, 1-bp and 5-bp deletions at every position were included in addition to SNVs. Flanking sequences were added to allow PCR amplification.
Oligos were ordered in a pool from Twist Bioscience, amplified by PCR and purified using AMPure XP (Beckman Coulter). For each SGE region, a homology arm (HA) plasmid was created by PCR amplifying a genomic fragment containing 500–1,000 bp of sequence on each side of the SGE region and cloning it into a linearized pUC19 vector using In-Fusion (Takara Bio). HA plasmids were linearized by PCR using primers to create 15–20 bp of overlap with oligo pool amplification products, and treated with DpnI (New England Biolabs) to remove circular plasmid. Amplified oligo libraries were cloned into the linearized HA plasmids using In-Fusion. Stellar Competent Cells (Takara Bio) were transformed and 1% of each transformation was plated to check efficiency, with the rest cultured overnight in 150 ml Luria broth containing 100 µg ml−1 carbenicillin. From these cultures, HDR libraries were purified using ZymoPURE Maxipreps (Zymo Research).
The exon 5 SGE library from 2018 (ref. 7) included PAM-blocking edits (c.222A>G and c.297G>A) for two potential gRNAs, but only the 5′ gRNA was used. We designed a new library replacing c.297G>A with another synonymous variant disrupting the 5′ target (c.228T>C).
The original exon 17 library7 did not contain an SNV encoding p.R1699Q (c.5096G>A) because it overlapped a PAM-blocking edit. We therefore designed a 2-bp variant (c.5096_5097delinsAA) encoding p.R1699Q, which is predicted to block recutting. The exon 17 HA plasmid was modified using in vivo assembly61 to create an HDR template encoding this variant. This was mixed with the original HDR library at a molar ratio of 1:100 for SGE.
Cloning gRNA-expressing plasmids
For HAP1 experiments, gRNAs were cloned by ligating annealed oligos into BbsI-digested pX459 plasmid62. For HMEC experiments, gRNAs were cloned into pGL3-U6-sgRNA-PGK-blasticidin, derived from pGL3-U6-sgRNA-PGK-puromycin63 (Addgene, 51133), as the inducible Cas9 HMEC line was puromycin resistant. Individual gRNAs were cloned by ligating annealed oligos into a BsaI-digested plasmid.
HAP1 cell culture
HAP1 cells with a frameshifting LIG4 mutation7 were cultured in Iscove’s modified Dulbecco’s medium (Gibco) completed with 10% FBS and 1% penicillin–streptomycin (Gibco). To avoid reversion to diploid, cells were cultured in 2.5 µM 10-deacetyl-baccatin-III (Stratech) and maintained below 80% confluency. To passage, cells were washed in DPBS (Gibco), trypsinized with 0.25% trypsin–ethylenediaminetetraacetic acid (Gibco), neutralized with complete Iscove’s modified Dulbecco’s medium, centrifuged at 300g for 5 min and resuspended.
HAP1 SGE protocol
The day before transfection, 18 million cells were seeded per 10-cm plate. Cells were transfected using Xfect (Takara Bio), with the following protocol modifications: 30 µg gRNA-expressing plasmid, 10 µg HDR library and 24 µl Xfect polymer were combined in 800 µl per transfection. A negative control using the HDR library and a pX459 plasmid expressing a gRNA targeting HPRT1, a nonessential gene, was performed for each experiment. Puromycin (Cayman Chemical) was added to media at 1 µg ml−1 from days 1 to 4. At least 6 million cells were passaged on days 5, 8 and 11. On days 5 and 14, pellets of 10 million cells were collected. Negative controls were collected on day 5.
HMEC cell culture
hTERT-immortalized HMECs with doxycycline-inducible Cas9 expression31 were cultured in HuMEC medium (Gibco) with 2% FBS and 1% penicillin–streptomycin. To passage, cells were washed in DPBS, trypsinized with 0.25% trypsin–ethylenediaminetetraacetic acid, neutralized with Defined Trypsin Inhibitor (Gibco), centrifuged at 180g for 5 min and resuspended in media.
Generation of a BRCA1
+/− HMEC line for SGE
To ensure each diploid cell would receive only one variant, we deleted one BRCA1 allele using two gRNAs to cut upstream and downstream of BRCA1. One day before transfection, cells were plated in 12-well plates with 1 µg ml−1 doxycycline (Sigma-Aldrich) to induce Cas9 expression. Cells were transfected with 25 nM of each crRNA:tracrRNA complex (Edit-R, Horizon Discovery) using DharmaFECT 4 (Horizon Discovery) according to the manufacturer’s protocol. Doxycycline was removed from the media on day 2 and cells were expanded before limiting dilution. To identify lines with a BRCA1 deletion, gDNA was extracted using QuickExtract (Biosearch Technologies). PCR and Sanger sequencing were performed to identify lines with complete monoallelic BRCA1 deletions, and to check for mutations on remaining alleles (Extended Data Fig. 5a and Supplementary Table 6). A cell line with complete deletion of one BRCA1 allele and a 1-bp deletion upstream (NC_000017.11:g.43125556del) and 1-bp insertion downstream (NC_000017.11:g.43044294_43044295insG) on the remaining allele was used in SGE experiments.
HMEC SGE
The day before transfection, 4.2 × 10⁵ cells were seeded per well in 12-well plates with 1 µg ml−1 doxycycline. Cells were transfected using Xfect using 1.5 µg of HDR library, 1.5 µg gRNA plasmid and 1.2 µl Xfect polymer per well. After 6 h, cells were pooled separately for each replicate. To increase HDR editing efficiency, the DNA-PK inhibitor NU7441 (Stratech) was added to 300 nM (SGE regions—exons 6, 11 and 10 (3′), intron 11) or 600 nM (SGE regions—promoter, exons 3 and 17). Blasticidin (Gibco) was included in the media from days 1 to 5 at 8 µg ml−1. On day 7, doxycycline and NU7441 were removed. Half of the cells were collected, with the remainder divided between untreated and olaparib-treated conditions. Olaparib was included at 300 nM in all HMEC experiments apart from exons 5 and 10 (5′). For the 5′ exon 12 region, untreated and olaparib-treated experiments were performed using two separate transfections. Cells were passaged every 3 days and collected on days 14 and 21.
Nucleic acid extraction
gDNA and RNA were extracted using the AllPrep DNA/RNA Kit (Qiagen), using QIAshredder columns (Qiagen) to homogenize lysates. gDNA was eluted in 100 µl nuclease-free water and quantified using the Qubit BR DNA Kit (Thermo Fisher Scientific). RNA was extracted from day 5 HAP1 SGE samples and quantified using NanoDrop UV spectrophotometry.
PCR1: amplifying gDNA
Each SGE region was PCR amplified from gDNA using a primer outside the HAs to prevent amplification of any remaining HDR library. Up to 2 µg gDNA was used per 100 µl reaction, with up to eight reactions per sample and one negative control reaction. KAPA HiFi HotStart ReadyMix (Roche) was used, with MgCl2 added to 5 mM. SYBR Green (Thermo Fisher Scientific) was added to all reactions at 0.4× to allow real-time monitoring and stopping upon completion.
PCR2: adding Nextera adaptors
PCR was used to add Nextera adaptors onto amplicons from PCR1. Each 25 µl PCR2 reaction used 1 µl of pooled PCR1 product as a template and was run for eight to ten cycles before AMPure XP purification.
cDNA preparation and amplification
For HAP1 day 5 samples, cDNA was prepared from 5 µg RNA using SuperScript IV First-Strand Synthesis (Invitrogen) using a BRCA1-specific primer. cDNA was then amplified as described for PCR2 using primers spanning at least one exon junction where possible. For internal exon 10 regions not spanning exon junctions, RNA was first treated with ezDNAse (Invitrogen).
Indexing and sequencing
Each sample was dual indexed via PCR, purified and quantified using Qubit 1× dsDNA High Sensitivity (Invitrogen). SGE samples were pooled, allocating gDNA samples 5 × 10⁶ reads, cDNA samples 3 × 10⁶ reads, HDR libraries 1 × 10⁶ reads and negative controls 0.5 × 10⁶ reads. Pools were sequenced on an Illumina NextSeq or NovaSeq using 300-cycle paired-end runs.
Processing SGE sequencing data
A published pipeline12 was modified to obtain variant counts for sequencing samples. Briefly, samples were demultiplexed using bcl2fastq2 (v2.17). SeqPrep was used to merge paired-end reads. Reads were aligned to a reference sequence for each amplicon using ‘needleall’ from EMBOSS (v6.6). A custom Python script was used to calculate variant frequencies, annotate editing events and add CADD (v1.6) annotations. To minimize PCR and sequencing errors, reads required one library variant and at least one PAM-blocking edit to be included for calculating function scores. Variant frequency was calculated by dividing variant reads by the total number of sample reads.
Deriving HAP1 function scores
Function scores were calculated as the log2 ratio of each SNV’s day 14 to day 5 frequency. Variants with frequency of <10−4 in the HDR library or <10−5 on day 5 were filtered. Variants were also filtered if the difference in function score between replicates was >1.5, unless both scores were < −1.0. Variants resulting in a different amino acid change due to a PAM-blocking edit were excluded. Function scores were first averaged across replicates, then normalized across regions such that median nonsense and synonymous scores for each coding region matched the global medians. In cases where variants were initially assigned two scores due to SGE regions overlapping, scores from only one region were used in global analysis, although all scores are reported in Supplementary Table 1. Scores from the promoter region were used for variants overlapping the 5′-UTR region, and scores from the exon 12-3′ region were used for variants overlapping the exon 12-5′ region. Function scores for 1-bp and 5-bp deletions included in the HDR library were determined the same way.
Deriving HAP1 function classes
As experimental noise differs across SGE regions, region-specific null distributions were used to determine significance. For coding regions, null distributions included synonymous variants with RNA scores > −1.0. For noncoding regions, null distributions included all variants. The ‘pnorm’ function in R was used to model each null distribution and calculate P values, with Benjamini–Hochberg adjustment (‘p.adjust’). A q-value threshold of 0.01 distinguished significantly depleted and neutral variants. Depleted variants were categorized as ‘LoF’ or ‘intermediate’ based on whether function scores were significantly different from nonsense variants. As there are relatively few nonsense variants per region, we used the score distribution for 155 depleted nonsense variants across all regions. We again performed Benjamini–Hochberg adjustment and set a q-value threshold of 0.01, corresponding to a function score threshold of −0.799, to distinguish ‘intermediate’ and ‘LoF’.
RNA scores
RNA scores were calculated for each coding variant scored in HAP1 as the log2 ratio of each SNV’s cDNA frequency to its gDNA frequency on day 5. Variant frequencies were calculated from reads containing the variant and at least one PAM-blocking edit, in the correct reference transcript context. Splice-altering variants show reduced RNA scores independent of whether the resulting transcript is in-frame or frameshifted, reflecting relative depletion of correctly spliced transcript. RNA scores were normalized such that the median synonymous score equaled 0.0. RNA scores were not determined for noncoding variants absent from full-length mRNA, as these cannot be quantified in transcript sequencing, or for 5′-UTR variants due to primer design constraints.
Deriving HMEC function scores and classes
HMEC function scores were calculated as the mean of the log2 ratios of day 14 to day 7 and day 21 to day 14 variant frequencies. The same frequency filters were applied as for HAP1. Variants were excluded if replicate scores differed by >2.0, unless both were <−1.0 or >−1.0. Scores were normalized between experiments as for HAP1, and the same approach was used to define significantly depleted variants, deemed ‘LoF’. (No intermediate class was defined.)
Deriving combined HAP1–HMEC function classes
Four combined HAP1–HMEC classes were defined—‘concordant-neutral’, ‘HAP1-intermediate, HMEC-neutral’, ‘HAP1-LoF, HMEC-neutral’ and ‘concordant-LoF’. A small number of HMEC-depleted variants scoring as neutral (n = 9) or intermediate (n = 2) in HAP1 were excluded from analyses of combined function classes due to insufficient power. Discordantly scored variants are those that were significantly depleted in HAP1 but not HMECs (HAP1-LoF, HMEC-neutral and HAP1-intermediate, HMEC-neutral).
Structural analysis
BRCA1 protein domains were defined as follows: p.2–101, RING domain; p.1392–1422, CC domain; p.1646–1863, BRCT domain. The mean function score for missense variants at each amino acid position was mapped onto the BRCA1–PALB2 CC-domain structure (Protein Data Bank (PDB): 7K3S) using PyMOL (v2.6.0).
FoldX (v5.0; https://foldxsuite.crg.eu/) was used to calculate ∆∆G predictions for missense variants scored in the RING, CC and BRCT domains. Protein structures from the PDB included the BRCA1 RING domain in complex with BARD1 (PDB: 1JM7), the BRCT domain (PDB: 1T15) and the CC domain in complex with PALB2 (mouse; PDB: 7K3S). FoldX ‘RepairPDB’ and ‘PositionScan’ were used to generate ∆∆G predictions. Predictions for 3 of 28 CC domain residues that differ between mouse and human were excluded.
Predicting transcription factor binding
In the promoter region, JASPAR predicts a binding site for DP1 (encoded by TFDP1). The JASPAR scan tool (https://jaspar.elixir.no/) was used to predict binding scores for SNVs within the 8-bp DP1 binding motif, using matrix profile MA1122.2.
Comparisons with computational predictions
CADD scores (v1.6) were obtained for all SNVs, with consequence labels from transcript CCDS11456.2. ‘Splice region’ describes variants 3–8 bp into introns and 1–3 bp into exons that do not alter amino acid sequence.
For missense variants, EVE scores64 (https://evemodel.org/; 24 October 2024) and AlphaMissense pathogenicity scores65 (https://alphamissense.hegelab.org/; 21 December 2023) were obtained. SpliceAI masked scores were generated by running SpliceAI28 with a maximum distance of 500 bp for SNVs within the BRCA1 transcript (ENST00000357654.9). ‘Maximum SpliceAI score’ is the maximum of ‘acceptor gain’, ‘donor gain’, ‘acceptor loss’ and ‘donor loss’ scores.
Comparison with other BRCA1 functional assays
Outcomes for missense variants in BRCA1 assays collated in ref. 19 were obtained. For each variant scored in both HAP1 and HMEC, the proportion of other assays for which the variant was deemed functionally abnormal was calculated. Variants were analyzed only if classified by ≥3 assays. Prior SGE data7 were excluded.
Generating HMEC lines with BRCA1 variants
The BRCA1+/− HMEC SGE line was edited as previously described to derive clonal lines with the following variants on the nondeleted allele: CC-domain variants p.M1411T (c.4232T>C) and p.L1414R (c.4241T>G), and exon 10 splice donor variant c.4096+1G>A. To generate HDR templates, HA plasmids were mutated using two rounds of in vivo assembly61 to introduce the PAM-blocking edit and the variant of interest. After editing, monoclonal lines were generated and sequenced using the MiniSeq (Illumina). A line with the two synonymous variants (c.4260G>A and c.4263T>C) used to prevent Cas9 recutting after CC-domain editing was isolated as a control.
Testing gene essentiality
BRCA1 essentiality was established in BRCA1+/− HMECs by analyzing indel depletion after editing the exon 12-5′ region according to the HMEC SGE protocol. Indel function scores were defined as the log2 ratio of indel frequency on day 14 over day 7.
PALB2 and RNF168 were edited in exons 4 and 1, respectively, through transfection of synthetic gRNAs to BRCA1+/− HMECs. Cells were sampled on days 2 and 14, and amplicon sequencing of gDNA was performed. For indels at a frequency >5 × 10⁻⁴ on day 2, an indel function score was calculated as the log2 ratio of day 14 frequency to day 2 frequency, normalized such that the median score for in-frame indels equaled 0.0.
RNF168 essentiality was assessed in the same way, except cells were sampled on days 5 and 14. Indel function scores were normalized such that the median of the parental cell line equaled 0.0.
Performing SGE in RNF168
−/− HMECs
A synthetic gRNA was used to target the coding sequence in RNF168 exon 1 in BRCA1+/− HMECs. Clonal lines were generated and Sanger sequenced, with DECODR66 used to deconvolute traces. A line with biallelic frameshift mutations (c.163_175del and c.166_175del) deemed ‘RNF168−/−’ was selected for SGE of the exon 12-5′ region. To compare between parental and RNF168−/− lines, function scores were normalized so that the median nonsense and median synonymous scores from each line matched.
Testing olaparib sensitivity in HMEC lines
HMECs were cultured in white, flat-bottom 96-well plates (Greiner CELLSTAR, Sigma-Aldrich) in olaparib concentrations between 1 nM and 30 µM for 7 days. Three technical replicates were seeded per concentration per edited line, with two replicates performed for parental cells. The CellTiter-Glo (v2.0) viability assay (Promega) was then performed. Luminescence was measured using a Spark multimode microplate reader (Tecan). For each plate, the mean background signal derived from wells containing media only was subtracted from luminescence values before normalization to the DMSO-only sample for each line. Dose–response curves and IC50 values were generated by fitting a four-parameter logistic model using the drc package (v3.0-1) in R.
RNA sequencing of cell lines
RNA was extracted using the AllPrep DNA/RNA Kit, with integrity assessed using TapeStation RNA ScreenTape (Agilent) and concentration measured using the Qubit RNA HS Assay (Thermo Fisher Scientific). Polyadenylated RNA was enriched from 200 ng total RNA in duplicate for each cell line using the NEBNext Poly(A) mRNA Magnetic Isolation Module (New England Biolabs), and used to prepare libraries with the NEBNext Ultra II RNA Library Prep Kit and NEBNext Multiplex Oligos for Illumina. Libraries were sequenced on an Illumina NovaSeq X using 100 bp paired-end reads to a depth of 60 million reads per sample.
Reads were aligned to GRCh38 using Bowtie 2 (v2.4.5), and BAM files were sorted and indexed with SAMtools (v1.18). Reads mapping to annotated exons were quantified at the gene level using featureCounts (Subread; v1.6.4). Genes with ≤5 reads across all samples were filtered. Differential expression analysis was performed with DESeq2 (v1.42.1) in R. Genes were annotated using BioMart, and log2 fold change estimates were shrunk using ‘lfcShrink’ with the ‘apeglm’ method67. Unshrunk and shrinkage-adjusted log2 fold change values are provided in Supplementary Table 7. Genes with an adjusted P < 0.05 were considered differentially expressed.
Gene set enrichment analysis68 was performed using clusterProfiler (v4.10.1) in R. Genes were ranked using the DESeq2 Wald statistic, and enrichment was assessed using Gene Ontology Biological Process69 or Reactome70 gene sets from the Molecular Signatures Database via msigdbr (v25.1.1). Enrichment scores were normalized to account for gene set size, yielding normalized enrichment scores (NES), with positive and negative values indicating enrichment in HAP1 and HMEC, respectively. P values were generated by permutation testing and adjusted using the BH method. Gene set enrichment analysis data are provided in Supplementary Table 8.
Assessing HDR via SSTR in HMEC lines
To assess HDR editing via SSTR in HMEC lines, a synonymous PAM-blocking edit was introduced into HPRT1. HMECs were transfected with a synthetic gRNA targeting exon 3 and a modified single-stranded DNA HDR template (Horizon Discovery), containing the synonymous SNV and 40-bp HAs (Supplementary Table 6), at 50 nM. After 5 days, gDNA was extracted and HPRT1 amplicon sequencing was performed. HDR rate was defined as the percentage of reads with a correctly edited synonymous SNV, and was normalized to total editing (percentage of reads not matching the reference) to account for variable transfection efficiency. Each cell line was tested in duplicate.
ClinVar analysis
ClinVar data were downloaded on 13 September 2024. ‘Benign’ and ‘likely benign’ were combined as ‘benign/likely benign’ (B/LB) and ‘pathogenic’ and ‘likely pathogenic’ were combined as ‘pathogenic/likely pathogenic’ (P/LP). VUS and variants with conflicting interpretations of pathogenicity were grouped together as ‘VUS’. ROC curves were generated in R using ‘geom_ROC’ from plotROC (v2.3.3), using B/LB and P/LP variants with a minimum one-star review status. To compare classification performance across lines, prior HAP1 SGE data for exon 3 were included. For analyses of VUS, all variants were included independent of review status.
Population sequencing data
Allele counts from gnomAD (v4.1.0) were accessed on 12 February 2025 (https://gnomad.broadinstitute.org/). All of Us data were accessed on 26 June 2024 (https://allofus.nih.gov/).
Estimating breast cancer risk from case–control studies
The BRIDGES dataset from the BCAC used in this study included BRCA1 sequencing from 46,306 breast cancer cases and 43,481 controls. The UK Biobank whole-exome sequencing dataset included 20,553 female breast cancer cases and 227,708 female controls. Dataset quality control and filtering criteria are described elsewhere47. Logistic regression was used to estimate ORs and 95% CIs for breast cancer associated with any variant in a given SGE-defined function class. Associations were adjusted for age and study country for the BCAC dataset, and age and genetic ancestry for the UK Biobank dataset. Analyses were performed separately for each dataset, then combined in a fixed-effects, inverse-variance meta-analysis using the ‘metafor’ R package to test overall association.
Assigning the American College of Medical Genetics and Genomics/Association for Molecular Pathology evidence codes
Truth sets were defined separately for HAP1 and HMEC SGE datasets and comprised all ClinVar variants assayed with a minimum two-star review status (Extended Data Fig. 10f,g). Benign variants with SpliceAI scores of >0.2 were excluded. A two-component GMM was fitted using mclust (v6.1.1) in R and the ‘predict’ function to assign a posterior probability of pathogenicity for each variant. Odds of pathogenicity were calculated as follows: (P2 × (1 − P1)/9(1 − P2) × P1), where P1 and P2 are the prior and posterior probabilities of pathogenicity, respectively. P1 was set uniformly at 0.10, as established14. PS3/BS3 evidence codes and corresponding point values49 were assigned according to the American College of Medical Genetics and Genomics/Association for Molecular Pathology framework71 using a maximum evidence strength of ‘strong’, thus capping the points at ±4 per assay.
For the HAP1 truth set, the function score distribution for B/LB variants was much narrower than for P/LP variants (Extended Data Fig. 10f). Therefore, a small number of positively scored, neutrally classified variants (function score > 0.35) were not well-represented by the GMM. Accordingly, we treated function scores of >0.35 as comprising the tail of the neutral distribution and assigned BS3-strong evidence to match all other HAP1 scores > −0.19. In both cell lines, evidence codes in favor of pathogenicity were replaced with ‘indeterminate’ for variants not significantly depleted (q > 0.01). For HAP1-intermediate variants, evidence in favor of pathogenicity was capped at ‘supporting’.
For variants assayed in both cell lines, points were summed to give a combined value from −8 to +8.
Statistics and reproducibility
All statistical tests were performed in R (v4.3.3) and were two sided. No statistical method was used to predetermine sample size. No data were excluded from analyses, except for quality control and where explicitly indicated for specific analyses. The experiments were not randomized and investigators were not blinded during outcome assessment. In SGE, all variants are tested in a pool, making experiments blind to effects before analysis.
Reporting summary
Further information on research design is available in the Nature Portfolio Reporting Summary linked to this article.