
Universality of the synthesis in plastics-derived SACs
Figure 1a illustrates the procedure of SAC synthesis from various plastics and metal chloride salts. Plastics were mixed with transition metal chloride salts at specific mass ratios and pyrolyzed at 800 °C for 3 h under an ammonia atmosphere. The resulting mixture was purified through hydrochloric acid pickling, yielding SAC products. During the synthesis, plastics were first pyrolyzed into light hydrocarbons (350–500 °C, including gas and oil)29. The metal chloride catalyzes the transformation of these light hydrocarbons into a graphitic network between the salt lattices, thus acting as both catalysts and templates during plastic carbonization26. The introduction of a metal salt into mixed plastics substantially reduced gas yields and intensified carbonization (Supplementary Fig. S1). Supplementary Fig. S2 shows that the addition of cobalt chloride also accelerated the conversion of medium-chain hydrocarbons (C16–C20) to long-chain hydrocarbons (C23–C30) and short-chain gaseous products (C2–C4). Simultaneously, partial metal species from the salt interacted with ammonia-derived nitrogen dopants and generated atomically dispersed metal sites into the carbon matrix. Spontaneously, some chloride ions from the metal salts were also integrated into the metal coordination environment, forming a featured metal-N4-Cl configuration. Figure 1b presents the obtained SACs synthesized from different plastics and metal salts, demonstrating the universality of the approach in transforming different types of plastics and MPs into SACs. As shown in Fig. 1a, c single-batch synthesis of CuSA-PE achieved a product yield of 1.1 g in a lab-scale tube furnace, suggesting promising potential for large-scale production of SACs from plastics.
Fig. 1: Synthesis and showcase of plastic-derived SACs.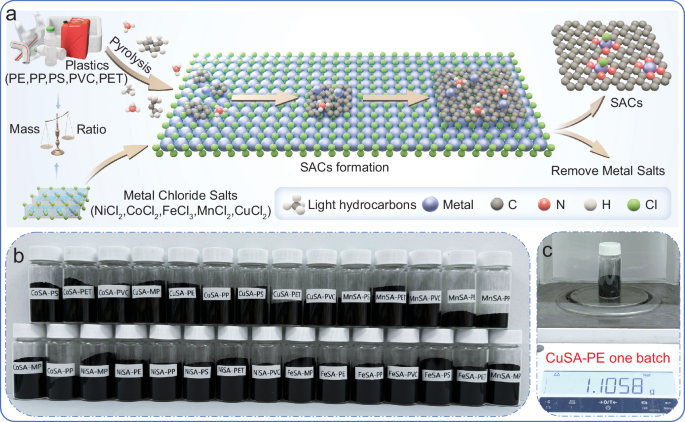
a Schematic illustration of single-atom catalysts (SACs) derived from plastics and transition metal salts. PE refer to polyethylene, PP refer to polypropylene, PS refer to polystyrene, PET refer to polyethylene terephthalate, PVC refer to polyvinyl chloride. b Image of various SACs synthesized from different plastics and metal salts. c The product yield of CuSA-PE synthesized from PE and copper chloride in one batch.
Scanning electron microscopy (SEM) images of various SACs derived from different plastics are shown in Supplementary Fig. S3. Notable different morphologies were observed on the surface of carbon products, including corrugated lamellar structures (Ni, Mn, and Co SACs), thick sheets (Cu SACs), and bulk/layered features (Fe SACs). These distinct morphologies of SACs may be attributed to the intrinsic crystal structures and melting points of the corresponding metal salt templates. As shown in Supplementary Table S1, the trigonal crystal structure with high melting points for NiCl2, CoCl2, and MnCl2 tended to form corrugated lamellar nanocarbons. In contrast, the FeCl3 trigonal crystal structure with a low melting point (306 °C) facilitated confined carbonization to yield bulk or layered features. The monoclinic crystal structure with a relatively low melting point for CuCl2 was inclined to produce flat lamellar nanocarbon. X-ray diffraction (XRD) patterns of SACs before acid pickling (Supplementary Fig. S4) exhibit metal chloride peaks, indicating their template role during the plastic transformation. After hydrochloric acid pickling, the XRD patterns of diverse SACs (Supplementary Fig. S5) presented a prominent (002) carbon peak at 2θ = 26°, while no discernible impurity peak was observed (except for MnSA-PE, MnSA-PP, and NiSA-PVC), confirming that most metal salts were successfully removed. The metal loadings of all plastic-derived SACs are below 1 wt% (Supplementary Table S2).
Transition electron microscopy (TEM) images of the five transition metal SACs derived from different types of plastics in Fig. 2a depict that all the SACs displayed lamellar structures. High-angle annular dark-field scanning transmission electron microscopy (HAADF-STEM) images in Fig. 2b further demonstrate the uniform dispersion of metal single atoms in the carbon matrix for each plastic-derived SAC. In addition, MPs (with a mass ratio of PE: PP: PS: PET: PVC = 1:1:1:1:1) were also successfully transformed into SACs using the same salt template approach. The TEM and HAADF-STEM images (Fig. 2c, d) display that all MPs-derived SACs exhibit atomically dispersed metal sites in the lamellar carbon matrix. Energy-dispersive X-ray spectroscopy (EDS) mapping images in Fig. 2e further confirm the homogeneous distributions of C, N, and metal atoms in MPs-derived SACs.
Fig. 2: Microscopic characterizations of plastic-derived SACs.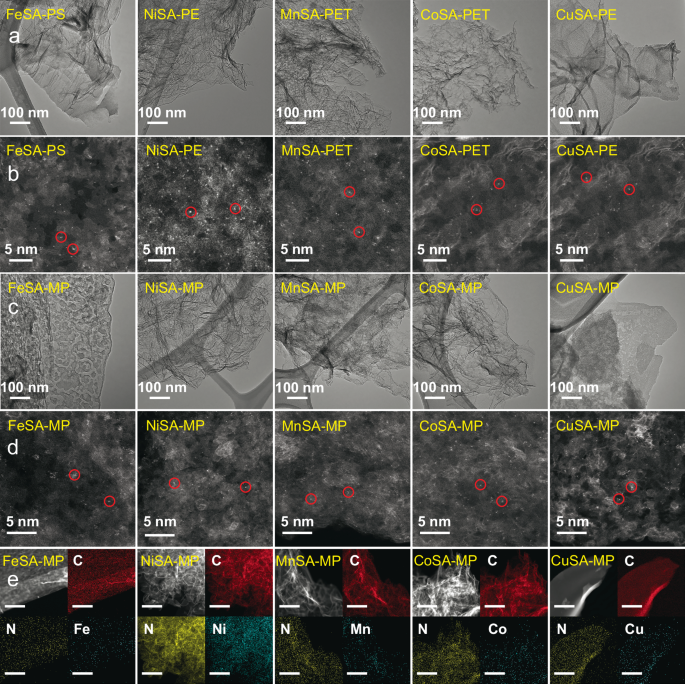
a TEM images of five SACs derived from single-type plastics. b HAADF-STEM images of five SACs derived from single-type plastics and single atoms are circled in red. c TEM images of five SACs derived from mixed plastics (MPs). d HAADF-STEM images of five SACs derived from MPs and single atoms are circled in red. e HAADF-STEM and the corresponding EDS mapping images of five SACs derived from MPs. The scale bar is 500 nm.
We further found that a mass ratio of plastics to metal chloride salts critically affects both the product yield and structure of SACs. The product yield and XRD patterns (Supplementary Figs. S6–S10) of samples synthesized at varying mass ratios indicate that excessive plastics or metal chloride salts resulted in a low product yield or impurities in the carbon products that could not be removed by hydrochloric acid. Hence, optimizing the mass ratio was essential to effectively transform different plastics into SACs, and the optimal mass ratios were summarized in Supplementary Table S3. In the optimal mass ratio, metal chloride was always excessive because the formation of nanocarbons with a lamellar structure needed excessive metal chloride to act as templates.
The SAC product yield and carbon conversion efficiency (by mass) were summarized in Fig. 3a and Supplementary Fig. S11 to evaluate the impact of categories of metals and plastics on conversion efficiency. Because of low metal loadings, SAC product yields and corresponding carbon conversion efficiency were almost identical. Notably, the product yield of Cu SACs was significantly higher than other transition metals, with CuSA-PE achieving the highest product yield at 88%. The exceptional yield of Cu SACs was due to the lower solubility of carbon in solid Cu30,31, resulting in the flat growth of graphene on the Cu surface (Supplementary Fig. S3e). In contrast, the relatively higher solubility of carbon in other transition metals led to the formation of corrugated carbons (Supplementary Figs. S3b–d). The flat growth mode was conducive to maximum interaction between decomposed plastic molecules and active Cu surface, leading to subsequent extensive in-plane carbon extension, thereby increasing the carbon yield. Among the various plastics, PVC displayed a considerably higher product yield than other plastics, possibly owing to the formation of chlorinated ethylene with activated C–C bonds that are conducive to the carbonization process.
Fig. 3: Product yield and specific surface areas of plastic-derived SACs.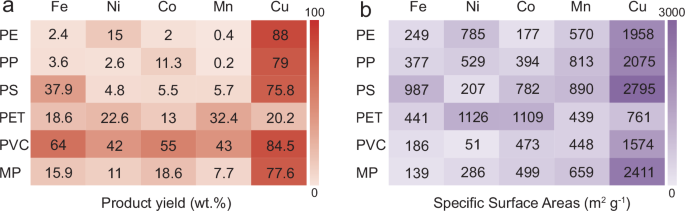
a Product yield and b SSAs of various SACs synthesized from different plastics and metal salts. The color depth represents the numerical magnitudes of product yield and specific surface areas.
Nitrogen sorption and desorption isotherms of various SACs are depicted in Supplementary Figs. S12–S16. Their corresponding total pore, micropore, and mesopore volumes as well as SSAs are included in Fig. 3b and Supplementary Fig. S17. Notably, CuSA-PS exhibited the highest SSA (2795 m2 g−1) and micropore volume (1.12 cm3 g−1), whereas MnSA-PE showed the highest pore volume (9.16 cm3 g−1) and mesopore volume (8.94 cm3 g−1). The influence of different transition metals on the pore structures of SACs is illustrated in Supplementary Fig. S18. Cu SACs generally exhibited significantly higher SSAs (Supplementary Fig. S18a) and micropore volumes (Supplementary Fig. S18c) compared to other metal-based SACs, implying that Cu promoted the formation of micropores during plastic transformation, which in turn accounts for the large SSAs. Conversely, Mn and Ni SACs presented larger total pores (Supplementary Fig. S18b) and mesopore volumes (Supplementary Fig. S18d) than other metal-based SACs, illustrating that Mn and Ni tend to convert plastics into mesoporous structures. These mesopores primarily contributed to the overall pore volume due to the existence of larger void spaces. Supplementary Fig. S19 shows the impact of plastic types on pore formation. PS-derived SACs exhibited higher SSAs (Supplementary Fig. S19a) and micropore volumes (Supplementary Fig. S19c), whereas PP- and PE-derived SACs displayed higher total pore (Supplementary Fig. S19b) and mesopore volumes (Supplementary Fig. S19d). These findings suggest that PS precursors preferred to form micropores, while PP and PE were inclined to produce mesopores. The ID/IG ratios of each plastic-derived SACs calculated from the corresponding Raman spectra were all close to 1 (Supplementary Figs. S20–S24 and Supplementary Table S4), indicating that most SACs exhibited similar graphitic structures. In summary, the characterizations demonstrated the universality of this salt-templating approach for upcycling various plastics into SACs with high quality and controlled physicochemical properties.
Universality in the electronic and coordination environments
Synchrotron soft X-ray spectroscopy (SXRS) was employed to elucidate the chemical configuration of the synthesized SACs. The carbon K-edge spectra of various SACs in Supplementary Fig. S25a exhibited three peaks at 285.3 (peak π), 288.2 (peak N-M), and 292.6 eV (peak σ). The π and σ peaks arise from the dipole transition of the C 1s core electron to π* C=C and σ* C–C orbitals32. The N-M peak signifies the formation of C-N-metal bonds in the carbon matrix33,34. Supplementary Fig. S25b depicts the nitrogen K-edge spectra of various SACs. Ni, Mn, and Cu SACs presented three prominent peaks at 397.8, 400.9, and 407 eV, corresponding to pyridinic, pyrrolic, and graphitic nitrogen, respectively34,35. In contrast, Fe and Co SACs displayed only two peaks corresponding to pyrrolic and graphitic nitrogen, suggesting differences in the nitrogen coordination environments across different metal centers. The metal L-edge spectra (Supplementary Fig. S25c) further revealed the oxidation states of the metal single sites in the synthesized SACs. Mn SACs exhibited mixed valence states of Mn2+ and Mn3+, located at 639.5 and 640.8 eV, respectively36. Other SACs predominantly displayed a +2 oxidation state, including Fe2+ at 708.5 eV, Ni2+ at 851.4 eV, Co2+ at 778 eV, and Cu2+ at 929.9 eV37,38,39. Lastly, the Cl L-edge spectra (Supplementary Fig. S25d) present a peak at 204 eV in Fe, Ni, Mn, Co SACs, and CuSA-PET, indicating that Cl was selectively functionalized into these SACs.
X-ray absorption near-edge spectroscopy (XANES), and extended X-ray absorption structure (EXAFS) analyses provide high-resolution insights into the electronic and coordination structures of SACs40,41,42,43. The metal K-edge XANES spectra in Supplementary Fig. S26 reveal that the MPs-derived SACs exhibit identical features to their corresponding metal phthalocyanine (MPc), indicating their comparable D4h symmetry. Specifically, FePc, NiPc, CoPc, and CuPc present significant peaks at 7117, 8338, 7715, and 8986 eV, respectively, which correspond to the 1s → 4pz electron transition and the square-planar metal-N coordination44. The vanished 1s → 4pz transition peak in MPs-derived SACs revealed their modified metal coordination environment with distorted D4h symmetric geometry45. Supplementary Fig. S27 shows that most single type plastics-derived SACs (except for Mn-PP and Co-PP) exhibit similar features to their corresponding MPs-derived SACs, indicating their similar coordination environment. Fourier-transformed (FT) EXAFS spectra of various SACs and references are displayed in Figs. 4a, b. The FT peak was observed at 2.2 Å for metal-metal bonding in Ni-PVC and Co-PE exclusively, implying the presence of metallic clusters or nanoparticles in these catalysts. By contrast, all other SACs exhibited peaks at 1.4–1.7 Å without the peak at 2.2 Å, confirming that metal sites primarily existed in an isolated state. The wavelet transform (WT) contour plots of the MPs-derived SACs and metal references (Fig. 4c) further supported the single atom features of these obtained SACs. Quantitative EXAFS curve fitting analysis (Fig. 4d, Supplementary Figs. S28–S32, and Tables S5–S9) disclosed that most plastics-derived Cu SACs (apart from CuSA-PET) exhibited Cu-N4 coordination structure and other metal-based SACs (Fe, Co, Ni, Mn) all showed Metal-N4-Cl coordination structure (Supplementary Table S10). The Cl L-edge spectra in Supplementary Fig. S33 reveal a distinct Cl signal in NiSA-PE, while no Cl signal is observed in Carbon-HDPE, confirming that Cl was not incorporated into the carbon framework of Carbon-HDPE. Given that Cl− is a bulky monodentate ligand, in-plane incorporation would induce significant steric repulsion with neighboring N and C in the carbon framework. Consequently, Cl− preferentially occupies the axial position of metal, which minimizes the steric hindrance and electronic repulsion, leading to a more energetically favorable geometry, such as a square-pyramidal or distorted trigonal bipyramidal configuration46,47,48. In addition, Cl coordination in the axial position exhibited much lower formation energy than the in-plane incorporation49. The unique coordination environment of Cu SACs likely stemmed from the fully electron-filled 3d orbitals of the Cu atom, which preferred to construct the Cu-N4 coordination without Cu–Cl interactions. Overall, SXRS and XANES analyses demonstrated that the metal atoms in most plastics-derived SACs were anchored to the carbon substrate through nitrogen binding with an in-plane Metal-N4 coordination.
Fig. 4: Synchrotron characterizations of plastic-derived SACs.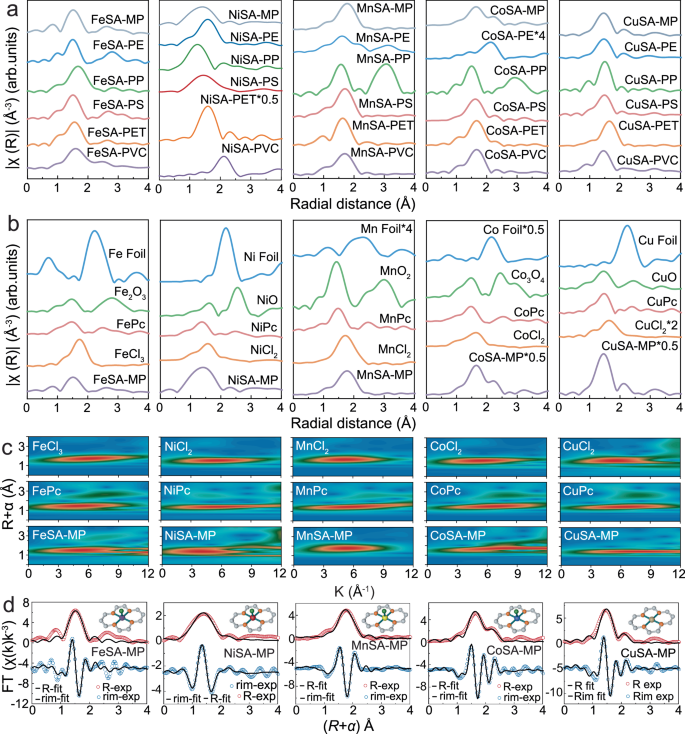
a Fourier-transformed extended X-ray absorption structure (FT-EXAFS) spectra in R space of diverse SACs synthesized from different plastics and metal salts. b The comparison of FT-EXAFS spectra in R space between MPs-derived SACs and various metallic references (metal foils, metal oxides, metal phthalocyanine (Pc), and metal chlorides). c Wavelet Transform (WT)-EXAFS plots of MPs-derived SACs, metal phthalocyanine, and metal chloride. d The FT-EXAFS R space fitting spectra of various SACs synthesized from MPs and the inset figure is the molecular model of each MP-SAC.
Performance evaluation of plastic-derived SACs
The catalytic performance of the plastics-derived SACs was first evaluated in PS-AOPs. As shown in Supplementary Fig. S34, the effect of peroxymonosulfate (PMS) dosage on phenol removal demonstrated that phenol could be completely removed in 10 min at PMS dosage exceeding 0.3 mM (PMS:phenol = 3:1). Further increases in PMS concentration did not improve the degradation efficiency, because all catalytic metal sites have been occupied. Therefore, 0.3 mM PMS was selected to evaluate the catalytic performance of the plastics-derived SACs in phenol oxidation (Fig. 5a and Supplementary Fig. S35). Among the 30 tested samples, 12 SACs achieved 100% phenol degradation within 30 min with PMS activation. Supplementary Fig. S36a, b show that PS- and PET-derived SACs and Cu-based SACs displayed higher phenol adsorption, attributed to their substantial SSAs and micropore volumes. Furthermore, CoSA-PET, MnSA-PE, CoSA-MP, MnSA-PET, and MnSA-PP exhibited extremely higher kinetic rate constants (kobs) (0.58 min−1, 0.56 min−1, 0.47 min−1, 0.44 min−1, and 0.39 min−1, respectively) than other SACs (Supplementary Fig. S37). Their dosage-normalized kobs (Fig. 5b) and turnover frequency (TOF, Fig. 5c) outperformed most SACs synthesized from other methods (Supplementary Table S11). Supplementary Fig. S38 highlights the impact of plastic and metal types on kobs, illustrating that PET-derived SACs and Mn-based SACs possessed the highest catalytic efficiency, followed by Co and Cu SACs. Conversely, PVC-derived SACs exhibited relatively low activity in PMS activation. The distinct catalytic performances between SACs using the same metal while different plastics are correlated to the specific surface area (SSA) and defect degree (ID/IG) of each SAC, which was verified by the linear relationship (Supplementary Fig. S39) between dosage-normalized kobs and SSA, ID/IG normalized kobs (per active site kobs). These findings suggest that upcycling plastics into high-activity Mn-, Co-, and Cu-based SACs provides a viable strategy for effective catalysts to drive rapid oxidation of organic pollutants in AOPs.
Fig. 5: Catalytic efficiency of plastic-derived SACs in waste water treatment.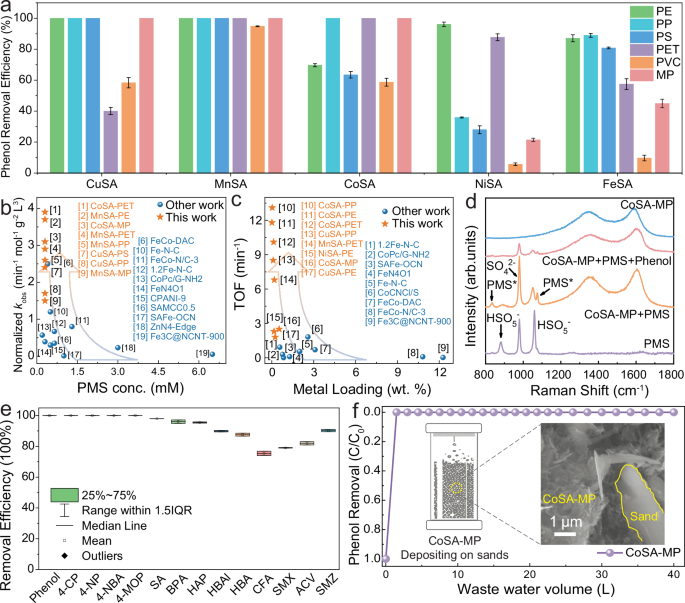
a Phenol removal efficiency of diverse plastic-derived SACs. b Normalized kinetic rate constants of phenol removal for SACs synthesized from different methods. c Comparison of TOF values and metal loading for state-of-the-art Fenton-like SACs. d In-situ Raman spectra. e Removal efficiency of various pollutants in CoSA-MP/PMS system in 30 min. f The stability test of the CoSA-MP + PMS oxidation system and the illustration of CoSA-MP depositing on sand (inset). Experimental conditions: (a–e without d) [catalyst] = 0.05 g L−1, [PMS] = 0.3 mM, [Pollutant] = 0.1 mM. d [catalyst] = 1 g L−1, [PMS] = 100 mM, [Phenol] = 100 ppm. (f) [PMS] = 0.3 mM, [Phenol] = 2 ppm, [catalyst] = 200 mg. The error bars in Fig. 5a,e refer to the standard deviations (mean values ± s.d., n = 2), obtained by repeating the experiment at least twice.
As real-life plastic wastes commonly consist of multiple plastic types, MPs-based SACs hold a greater promise in practical applications. Among them, CoSA-MP exhibited the highest PMS activation efficiency and relatively low pollutant adsorption, making it ideal for mechanistic studies of catalytic PMS activation and pollutant oxidation. As shown in Supplementary Fig. S40, the negligible inhibiting effect of typical radical scavengers (methanol, ethanol, and 2,2,6,6-tetramethyl-4-piperidinol (TEMP)) and insignificant oxidation effect on benzoic acid and nitrobenzene in the CoSA-MP/PMS system excluded the involvement of hydroxyl/sulfate radicals (•OH and SO4•−) or 1O2 in the phenol oxidation15,50,51,52. Electron paramagnetic resonance (EPR) analysis only detected 5,5-dimethyl-1-pyrroline N-oxide (DMPOX), a direct oxidation product of 5,5-dimethyl-1-pyrroline N-oxide (DMPO), while no radical adduct was observed, indicating a non-radical oxidation pathway (Supplementary Fig. S41a)53. The flat signal in Supplementary Fig. S41b further confirmed the absence of 1O2, as no TEMP adduct was detected54. Furthermore, CoSA-MP did not enhance the oxidation of methyl phenyl sulfoxide (PMSO) or increase methyl phenyl sulfone (PMSO2) formation (Supplementary Fig. S42a). The PMSO2 yield was even lower than the direct PMS oxidation without a catalyst (Supplementary Fig. S42b), indicating that CoIV=O was not generated in the CoSA-MP + PMS system26. These findings collectively suggest that free radicals, 1O2, and CoIV=O were not the dominant reactive species in the CoSA-MP/PMS system.
In-situ Raman spectroscopy was conducted to investigate the interactions between CoSA-MP and PMS (Fig. 5d). The PMS solution presented three characteristic peaks at 980 (SO42−), 879 and 1060 cm−1 (HSO5−). The addition of CoSA-MP introduced two new peaks at 835 and 1074 cm−1, indicating the formation of surface-confined intermediates (PMS*). These new peaks weakened upon the addition of phenol, suggesting that the PMS* behaved as a non-radical reactive species involved in pollutant oxidation55. In-situ Fourier transform infrared spectroscopy (FTIR) spectra (Supplementary Fig. S43) of PMS solution exhibited characteristic peaks at 1060, 1105, and 1260 cm−1, corresponding to the S=O stretching vibration of HSO5−, S-O stretching vibration of SO42−, and HSO5−, respectively49,56. Upon introduction of CoSA-MP, the peaks at 1060 and 1260 cm−1 red-shifted to 1051 and 1200 cm−1, respectively, indicating the generation of PMS* intermediates. Following the phenol addition, these peaks reverted to 1060 and 1260 cm−1, indicating instant PMS* consumption for phenol oxidation57.
Open circuit potential curves (Supplementary Fig. S44a) further illustrate that the addition of PMS resulted in a substantial potential increase, which stabilized at 1.015 V, indicating that the formation of the PMS*-SAC complex led to a raised oxidation potential. After the introduction of phenol, the potential decreased, confirming that PMS* accepted electrons from phenol (electron donor) via the carbon surface, verifying the electron-transfer process (ETP) in the CoSA-MP/PMS system. The current-time curve (Supplementary Fig. S44b) provided additional insight into these interactions. When the CoSA-MP electrode was applied a 1.015 V potential (matching the equilibrium potential of PMS* in the open circuit potential), the current experienced a sharp drop from 1 × 10⁻⁴ to 2 × 10⁻⁶ μA. Upon phenol addition, the current instantly increased to 6.4 × 10⁻⁶ μA and then gradually decreased to 4.6 × 10⁻⁶ μA, confirming that the CoSA-MP serves as the electron shuttle to transfer electrons from phenol and surface-activated PMS* during the oxidation process58. To verify the ETP regime, we constructed a galvanic oxidation setup (GOS, Supplementary Fig. S45a), using CoSA-MP-coated graphite paper as both electrodes. PMS and phenol solutions were placed in separate cells, bridged by a proton exchange membrane and an ammeter. The CoSA-MP + GOS system (Supplementary Fig. S45b) displayed a sharp current (2.8 mA) and 100% phenol removal, while the GOS system with bare graphite paper electrode as the control group showed minimal activity (0.3 mA, ~6%). These results confirm CoSA-MP served as both an activator and electron mediator to trigger an ETP regime for spontaneous PMS activation (electron acceptor) and pollutant oxidation (charge donor). A metal-poisoning experiment in Supplementary Fig. S46 depicts that phenol removal efficiency was significantly reduced upon ethylenediaminetetraacetic acid (EDTA) or potassium thiocyanate (KSCN) addition, indicating that Co single atoms are the primary catalytic sites for PMS activation59.
The CoSA-MP/PMS system achieved a total organic carbon (TOC) reduction from 8.35 to 0.78 mg L−1, corresponding to ~90% carbon removal (Supplementary Fig. S47). Surface product extraction and ultrahigh performance liquid chromatography-mass spectroscopy (HPLC-MS) analysis (Supplementary Fig. S48a) revealed that the major surface species were dimeric and trimeric phenoxyls (Supplementary Fig. S48b). A proposed polymerization pathway (Supplementary Fig. S49) involves PMS*-mediated electron abstraction from phenol at the hydroxy group, ortho, and para positions, thus generating organic radicals. These radicals undergo C–C and C–O coupling to form different oligomers, and some may undergo hydroxylation or oxidation to quinone-containing polymers60,61.
Natural water systems contain various inorganic ions (such as Cl−, SO42−, NO3−) and humic acid (HA), which normally influence the performance of AOPs62,63,64. The impacts of these background factors and real water matrixes were also evaluated. Supplementary Fig. S50 demonstrated that these ions and practical water matrix had minimal impacts on phenol degradation in the CoSA-MP/PMS system, suggesting the resilience of the CoSA-MP/PMS system to fulfill the remediation task in practical water treatment. Harsh conditions, such as extreme solution pH typically limited the application of conventional metal-based AOPs65,66. The post-reaction solution was analyzed by inductively coupled plasma mass spectrometry (ICP-MS), and the Co concentration was only 1.3 ppb, demonstrating the structural stability of single-atom Co in CoSA-MP. Nevertheless, as illustrated in Supplementary Fig. S51, the CoSA-MP/PMS system maintained 100% phenol removal efficiency across a wide pH range (3 to 11, initial pH control and pH buffer condition), demonstrating the structural robustness of plastics-derived SACs during the catalytic oxidation process. Furthermore, the CoSA-MP/PMS system achieved over 70% removal efficiency within 30 min for a variety of organic pollutants (Fig. 5e and Supplementary Figs. S52 and S53), including phenol, 4-chlorophenol (4-CP), 4-aminophenol (4-NP), 4-aminobenzoic acid (4-NBA), 4-methoxyphenol (4-MOP), sulfanilamide (SA), bisphenol A (BPA), 4-hydroxyacetophenone (HAP), 4-hydroxybenzaldehyde (HBAl), 4-hydroxybenzoic acid (HBA), 2-(4-chlorophenoxy)−2-methylpropionic acid (CFA), sulfamethoxazole (SMX), acyclovir (ACV), and sulfamerazine (SMZ). The long-term practical water treatment (Supplementary Fig. S54) of phenol was investigated in a fixed-bed reactor packed with CoSA-MP and sands (the inset of Fig. 5f). The system continually treated 40 L wastewater and maintained 100% phenol removal (Fig. 5f), implying the high purification efficiency and stability of the CoSA-MP + PMS system.
Moreover, the plastics-derived SACs also exhibited excellent performances in typical electrochemical systems, such as nitrogen reduction reaction (NRR) to yield ammonia, oxygen reduction reaction (ORR), and lithium-sulfur (Li-S) batteries. Supplementary Fig. S55 illustrates that CuSA-PE showed a high current density and Faraday efficiency for NH4+ formation (78%), implying its excellent NRR catalytic performance. The negligible current fluctuation over a 12 h operation further demonstrated the stability of CuSA-PE67. In the electrochemical ORR measurements (Supplementary Fig. S56), MnSA-PET and CuSA-MP exhibited high onset potential of (0.9 and 0.86 V, respectively) and relatively low H2O2 selectivity (11% and 8% at 0 V), indicating that they preferred the 4e− ORR pathway to reduce O2 to H2O68. In contrast, NiSA-PE and NiSA-MP illustrated a high peroxide oxidation current on the ring electrode (0.09 and 0.08 mA) and high H2O2 selectivity (86% and 73%), suggesting that they proceeded toward the 2e− pathway69.
In addition, when equipped in a Li-S battery, the galvanostatic discharge profiles of the plastics-derived SACs-based sulfur cathodes exhibited elevated and extended discharge plateaus (Supplementary Fig. S57a), reflecting enhanced reduction kinetics from sulfur to polysulfides. Notably, S/NiSA-PE, S/CoSA-PET, and S/MnSA-PET electrodes achieved initial discharge capacities of 1175, 1012, and 1011 mAh g−1, respectively, outperforming the reference S/CNT (908 mAh g−1). This improved catalytic activity was further corroborated by the positive shift in cathodic peaks and the higher, sharper redox currents observed in cyclic voltammetry (Supplementary Fig. S57b). Furthermore, the S/NiSA-PE electrode maintained a significantly higher discharge capacity of 770 mAh g−1 after 100 cycles, compared to 620 mAh g−1 for S/CNT (Supplementary Fig. S58), demonstrating its superior long-term electrochemical stability and performance for a Li-S battery.