
The SXR-ATAS experimental methodology employed in this work builds on ref. 16, with the addition of an in-situ time-of-flight mass spectrometer (TOF-MS) which allows for the identification of the charged fragments generated through strong-field ionisation (SFI) independently from the SXR absorption spectra (see Supplementary Section S1 for experimental details). In short, starting from the tetrahedral silane molecule (SiH4) in its electronic ground state, we suddenly activate the JT effect by strong-field-ionising the triply-degenerate highest-occupied molecular orbital (HOMO) with an optical (500–1000 nm) laser pulse. The ultrafast vibrational dynamics that this launches in \({{{{{{\rm{SiH}}}}}^{+}_{4}}}\) are probed with SXR absorption using an isolated sub-200-as pulse covering the silicon-L2,3 edge. This experimental scheme yields a cross-correlation with a standard deviation of just σ = 1.00 ± 0.05 fs (or 2.37 ± 0.13 fs in full width at half maximum measured in xenon, see Supplementary Fig. S1). The experimental XAS are processed using a singular-value based filtering (Supplementary Section S1.3) and interpreted with the help of previous synchrotron studies17 and our MS results.
The experimental data are presented in Figs. 1b and 2a. The first shows a picosecond-spanning measurement that captures the entire dissociation of \({{{{{{\rm{SiH}}}}}^{+}_{4}}}\), whereas the second shows a finer delay-step measurement in which the initial vibrational dynamics are more clearly visible. A lower energy range of the latter dataset was also the subject of ref. 16.
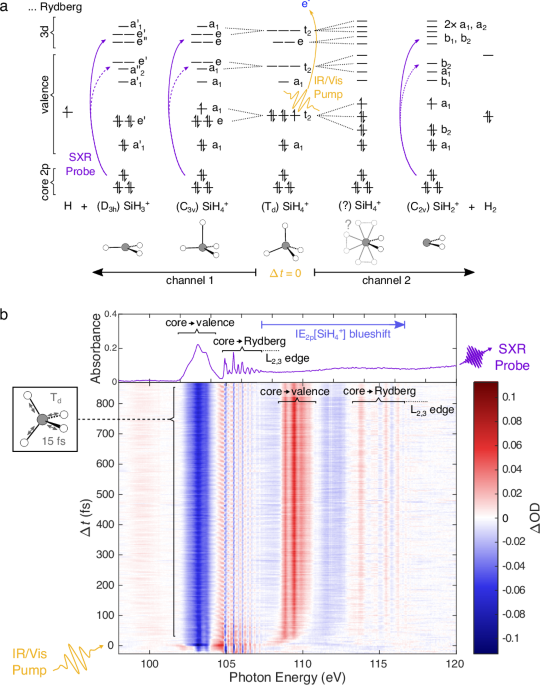
Fig. 1: Overview of the chemical system and the ATAS results.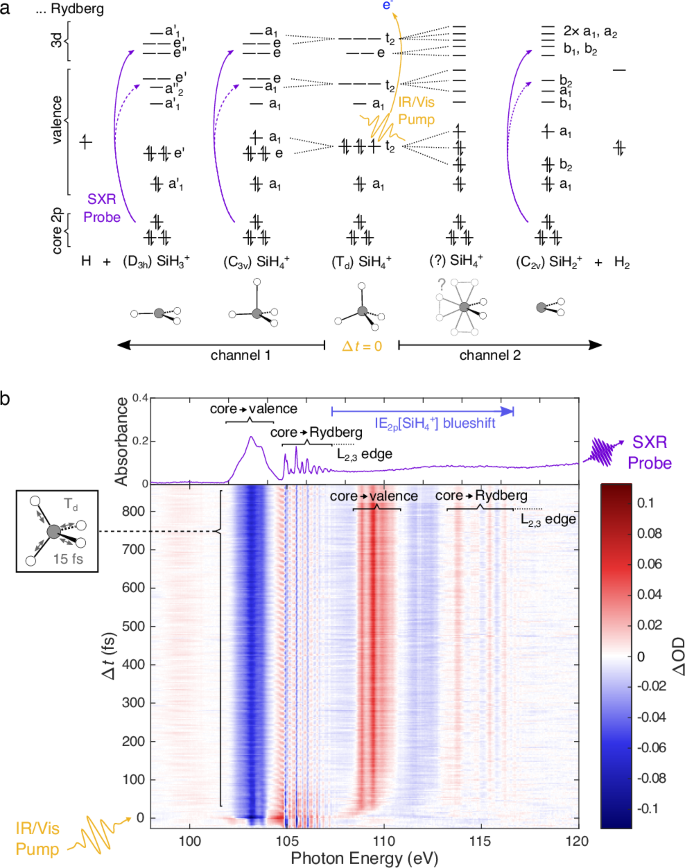
a Schematic of the orbital structure of \({{{{{{\rm{SiH}}}}}^{+}_{4}}}\) and its fragments. The energetic ordering, occupation and symmetry of the orbitals of \({{{{{{\rm{SiH}}}}}^{+}_{4}}}\) and its fragments in various relevant geometries is shown. The SFI pump process is represented with a yellow arrow while the XAS (probe) transitions are represented by purple lines. Solid lines indicate the dominant observed transitions. b The results of an ATAS measurement on silane, whose measured static absorption is plotted in the top panel. The core-valence (102–104.5 eV) and core-Rydberg (104.5–107.5 eV) transitions of SiH4 are clearly separated, with the latter showing far narrower features. The blueshift of the L2,3-absorption edge of the cationic species (shown as a blue arrow) is discussed in Supplementary Section S2.2.
Before unravelling the JT dynamics of \({{{{{{\rm{SiH}}}}}^{+}_{4}}}\), we first examine the 15-fs-period signals that dominate the 102.5–107.5 eV region of the transient spectrum. These are the result of Si–H stretching vibrations in the electronic ground state of SiH4, illustrated on the left-hand side of Fig. 1b. As the measured vibrational wavepacket is not found to be displaced immediately after Δt = 0, and based on comparisons with the literature14,18,19, we determine that these dynamics are initiated through bond softening. These coherent observables also serve as a proverbial canary: their constant amplitude across all delays assures us that modulations in other vibrational quantum beats are not coherent artefacts induced by the pump-pulse pedestal.
We now turn to \({{{{{{\rm{SiH}}}}}^{+}_{4}}}\). Upon ionisation of the HOMO of silane, the JT effect lowers the energy of the system by breaking its Td symmetry, raising the energy of the SOMO and lowering that of the doubly-occupied orbitals (Fig. 1a). In contrast to the methane cation, which is readily observed in its unfragmented form20, the JT-relaxation in \({{{{{{\rm{SiH}}}}}^{+}_{4}}}\) leads to dissociation into \({{{{{{\rm{SiH}}}}}^{+}_{3}}}\) or \({{{{{{\rm{SiH}}}}}^{+}_{2}}}\) ions21. Measurements from our in-situ TOF-MS at various pump intensities (Supplementary Fig. S2) reveal the products of SFI to be always dominated by approximately equal amounts of \({{{{{{\rm{SiH}}}}}^{+}_{3}}}\) and \({{{{{{\rm{SiH}}}}}^{+}_{2}}}\). This agrees with non-time-resolved ionisation studies21,22 and demonstrates that the use of few-cycle SFI does not significantly modify the fragmentation ratio of \({{{{{{\rm{SiH}}}}}^{+}_{4}}}\) compared to above-threshold single-photon ionisation. This is particularly important for the analysis of the \({{{{{{\rm{SiH}}}}}^{+}_{2}}}\) channel as it ensures that the energetically-forbidden sequential fragmentation channel \({{{{{{\rm{SiH}}}}}^{+}_{4}}}\,\to \,{{{{{{\rm{SiH}}}}}^{+}_{2}}}\) + H + H remains closed for our experimental conditions.
The XAS of these fragments can be observed in our ATAS results, showing excellent agreement with previous synchrotron studies17,23. Ionisation leads to a large change in the overall structure of the \({{{{{\rm{SiH}}}}}^{+}_{n}}\) L2,3-edge XAS. While the absorption spectrum of silane exhibits only two distinct regions (2p → anti-bonding below 104.5 eV and 2p → Rydberg above23), the ionic species exhibit three17 (a 2p → anti-bonding region centred at 106 eV, a 2p → 3d region centred around 110 eV, and a 2p → Rydberg region centred at 115 eV). ATAS measurements usually focus on the core-valence spectral region as it typically exhibits stronger and broader signals which are easier to calculate. The higher resolution, SNR and self-sufficiency of our methodology, however, allows us to take full advantage of the two higher-energy regions which are usually well-separated from the other absorption features due to the ionisation-induced blue-shift (see Supplementary Section S2.2).
We start with the analysis of the \({{{{{{\rm{SiH}}}}}^{+}_{3}}}\) channel in Fig. 1b. From symmetry considerations, the breaking of a single Si–H bond must occur through the JT-activation of one or both of the t2-symmetry vibrational modes. These are the ν3 anti-symmetric stretch (15 fs period in silane) and the ν4 umbrella-bending modes (36 fs period in silane). Our experiments manifest both of these modes: the faster ν3 vibrations are very short lived; they only appear in the experimental results for the first 25 fs after Δt = 0 fs in the central energy of 2p → Rydberg transition at 112 eV. Supplementary Fig. S7 shows how they modulate the energy of these peaks with a period of 7–8 fs.
The results in the second spectral region, magnified in Fig. 2a, exhibit richer dynamics. Over the first 30 fs, its absorption features experience a blue shift as well as modulations in their linewidths. Upon dissociation, the measured transient spectrum narrows and converges to a spin-orbit-split pair of peaks at 108.8 and 109.4 eV characteristic of \({{{{{{\rm{SiH}}}}}^{+}_{3}}}\) (a comparison between the synchrotron17 and ATAS results can be found in Fig. 3a). As the 108.8 eV peak does not overlap with the spectra of \({{{{{{\rm{SiH}}}}}^{+}_{2}}}\), the integrated absorption between 108.6 and 109.0 eV can be used as a transient measure of convergence to \({{{{{{\rm{SiH}}}}}^{+}_{3}}}\).
Fig. 2: The ballistic \({{{{{{\rm{SiH}}}}}^{+}_{3}}}\) dissociation pathway.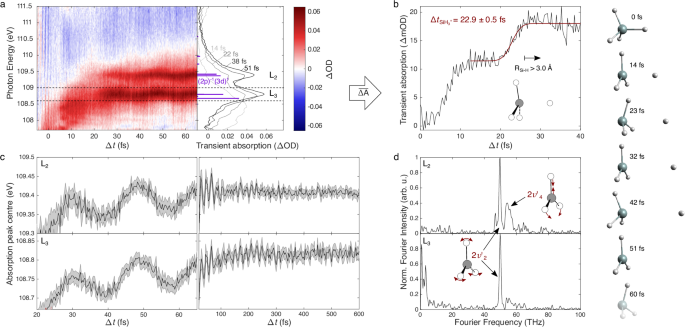
a Reanalysed results of a previously-published ATAS measurement16 showing the ballistic dissociation of \({{{{{{\rm{SiH}}}}}^{+}_{4}}}\) into \({{{{{{\rm{SiH}}}}}^{+}_{3}}}\). Snapshots of the absorption spectra are compared with the result of the NEVPT2 calculations (purple bars), assigning the spectral features to 2p → 3d transitions (see Supplementary Section S2.3.1). The integral of the ΔOD between 108.6 and 109.0 eV (dashed horizontal lines) is shown in (b), exhibiting two sigmoidal rises. The second rise is assigned to the breaking of the Si–H bond and an error-function fit for Δt > 12.5 fs yields a \({{{{{{\rm{SiH}}}}}^{+}_{3}}}\) fragmentation time of \(\Delta {t}_{{{{{{{\rm{SiH}}}}}^{+}_{3}}}}=22.9\pm 0.5\) fs. c Results of Gaussian fits (95% confidence intervals shown in grey) of transient spectra as a function of Δt (from a and Fig. 1b), revealing the post-fragmentation vibrational dynamics of \({{{{{{\rm{SiH}}}}}^{+}_{3}}}\). Agreement between experiment and AIMD calculations is demonstrated through snapshots (far-right) and in Supplementary Figs. S5 and S6. A Fourier transform, shown in (d), reveals the frequency of these beats to be 50 THz, the second harmonic of the 838 cm−1 umbrella mode25.
The integrated absorption shown in Fig. 2b exhibits two sigmoidal rises; whereas the first is dependent on the exact energy range of the integration because it is a consequence of the blue shift, the second is a result of the changes in linewidth (the origin of which is explored in Supplementary Section S3.4). From an error function fit of this second sigmoid (shown in maroon), the dissociation time of the \({{{{{{\rm{SiH}}}}}^{+}_{3}}}\) channel is found to be \(\Delta {t}_{{{{{{{\rm{SiH}}}}}^{+}_{3}}}}=22.9\pm 0.5\) fs. This result is in agreement with the only published theoretical study on \({{{{{{\rm{SiH}}}}}^{+}_{4}}}\)fragmentation24, which has estimated the bond dissociation time (here defined as the time taken to double the bond length) to be roughly 20 fs. To supplement these results we performed our own AIMD simulations (see Supplementary Section S2.4 for more details) which yield a dissociation time of 19 fs.
The experimentally observed dynamics of this first channel do not end with the breaking of the Si–H bond. The \({{{{{{\rm{SiH}}}}}^{+}_{3}}}\) fragment is expected to retain 750 meV of vibrational energy24, resulting in long-lived, large-amplitude vibrations. Experimentally, this manifests as clear vibrational quantum beats in the transient-absorption spectra for Δt > 25 fs. A Gaussian fit of each transient spectrum of both the short and long scan (results shown in Fig. 2d and methodology in Supplementary Section S3.2) reveals that the central energies of the absorption peaks oscillate with a period of 20 fs (50 THz)—twice the frequency of the 838 cm−1 (39.8 fs) \({{{{{\rm{a}}}}}^{{\prime}{\prime}}}_{2}\)-symmetry \({{\nu }^{{\prime} }}_{2}\) out-of-plane umbrella mode of \({{{{{{\rm{SiH}}}}}^{+}_{3}}}\)25.
The excitation of the \({{\nu }^{{\prime} }}_{2}\) mode is also seen in AIMD simulations: the AIMD snapshots on the right of Fig. 2 show how the plane containing the three bound hydrogen atoms continues to oscillate above and below the silicon atom despite the hydrogen atom having dissociated after ~25 fs. While we demonstrate numeric agreement between experiment and simulations in Supplementary Figs. S5 and S6, it is important to stress that the conclusions drawn in this work are not dependant on it; which allows the uncoupling of the experimental and theoretical results. The excitation of the \({{\nu }^{{\prime} }}_{2}\) mode is also supported when we consider the mapping of the irreducible representation of the SiH4 ν4 mode to that of the trigonal-planar \({{{{{{\rm{SiH}}}}}^{+}_{3}}}\) species: T2 (Td) → A1 (C3v) \(\to \,{{{{{\rm{A}}}}}^{{\prime}{\prime}}}_{2}\) (D3h). We experimentally observe the second harmonic of the \({{{{{\rm{a}}}}}^{{\prime}{\prime}}}_{2}\)-symmetry ν′2 mode due to its symmetry—an equal displacement along the positive or negative direction produces a spectroscopically indistinguishable geometry. The observables of the system therefore only depend on the absolute displacement of the mode, which explains why the observed modulation has half the period of the vibrational mode.
The amplitude of the oscillations appear to decrease at Δt ~ 100 fs—two vibrational periods of the \({{\nu }^{{\prime} }}_{2}\) umbrella mode. Especially in the case of the 109.4-eV line (upper panel of Fig. 2d), this is followed by a partial rephasing which peaks around a delay of 200 fs, with a lasting dephasing observed after ~400 fs. This sub-picosecond dephasing of the vibrational quantum beat is a result of the anharmonicity experienced by the umbrella-mode wavepacket due to its large-amplitude motion. Further anharmonic effects may be introduced through the Coriolis interaction between the \({{\nu }^{{\prime} }}_{2}\) (\({{{{{\rm{a}}}}}^{{\prime}{\prime}}}_{2}\)) mode and the \({{\nu }^{{\prime} }}_{4}\) (\({{{{\rm{e}}}}}^{{\prime} }\)) H–Si–H rocking/scissoring mode (938 cm−1)25,26. This is supported by the appearance of the \({{\nu }^{{\prime} }}_{4}\) mode’s second harmonic (56 THz) in the Fourier spectra, particularly in that of the higher-energy L2 absorption line (we attributed this selectivity to the fact that, unlike the L3, the L2 transition dipole vector has components in the plane of the molecule).
We now move to the second channel: \({{{{{{\rm{SiH}}}}}^{+}_{4}}}\,\to \,{{{{{{\rm{SiH}}}}}^{+}_{2}}}\) + H2. As with \({{{{{{\rm{SiH}}}}}^{+}_{3}}}\), the L2,3 absorption spectrum of the \({{{{{{\rm{SiH}}}}}^{+}_{2}}}\) can be obtained from synchrotron studies17. By taking advantage of these absolute cross sections, it is even possible to determine the relative abundance of the two fragments directly from the transient spectra at long delays. Through minimizing the difference between the measured spectrum and a weighted sum of synchrotron spectra (right panel of Fig. 3a), we find the ratio of abundance to be 1:1, in agreement with our TOF-MS results and the single-photon-ionisation literature. This analysis relies on a correction to account for the fact that the pump’s focus is smaller than the probe’s (discussed further in Supplementary Section S3.6).
Next, we compare the structure of the two cationic species’ XAS. Owing to its lower C2v symmetry, \({{{{{{\rm{SiH}}}}}^{+}_{2}}}\) exhibits more distinct core-valence transitions than \({{{{{{\rm{SiH}}}}}^{+}_{3}}}\), leading to a broad congested XAS between 109 and 111 eV. The \({{{{{{\rm{SiH}}}}}^{+}_{2}}}\) species’ featureless absorption tail between 109.7 and 110.7 eV exhibits minimal overlap with the XAS of \({{{{{{\rm{SiH}}}}}^{+}_{3}}}\), allowing us to use this spectral region as a probe of the abundance of the \({{{{{{\rm{SiH}}}}}^{+}_{2}}}\) species. In contrast to the sigmoid-like temporal evolution of the \({{{{{{\rm{SiH}}}}}^{+}_{3}}}\) absorption, that of \({{{{{{\rm{SiH}}}}}^{+}_{2}}}\) (shown in Fig. 3b) is found to be well described with a negative exponential decay, signifying that the dissociation of \({{{{{{\rm{SiH}}}}}^{+}_{4}}}\) to \({{{{{{\rm{SiH}}}}}^{+}_{2}}}\) is limited by a first-order stochastic process27. From a least-squares fit we obtain a decay constant for the \({{{{{{\rm{SiH}}}}}^{+}_{2}}}\) dissociation (and therefore the lifetime of a metastable \({{{{{{\rm{SiH}}}}}^{+}_{4}}}\) species) measuring \({\tau }_{{{{{{{\rm{SiH}}}}}^{+}_{2}}}}=140\pm 19\) fs.
Fig. 3: The transient \({{{{{{\rm{SiH}}}}}^{+}_{4}}}\) species and its decay into \({{{{{{\rm{SiH}}}}}^{+}_{2}}}\).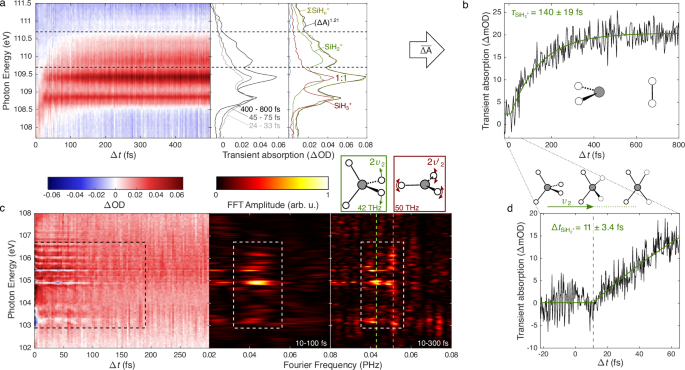
a Results of the longer ATAS measurement (Fig. 1b) showing the \({{{{{{\rm{SiH}}}}}^{+}_{2}}}\) fragment’s transient absorption. The right-hand panel compares time-averaged transient spectra and their non-linear correction (ΔA)1.21 (greyscale) with synchrotron results17 (coloured). The absorption between 109.7 and 110.7 eV is integrated and plotted as a function of pump-probe delay in (b), in which a negative exponential decay fit reveals a 140 ± 19 fs decay constant. c The spectral signature and vibrational dynamics of the JT-distorted \({{{{{{\rm{SiH}}}}}^{+}_{4}}}\) species (highlighted with dashed rectangles). The transient spectrum is produced by applying a 4-THz-wide Fourier filter to the ATAS results, followed by a 33% depletion correction (see Supplementary Section S3.5). The right-hand panels show the result of a Fourier transform over the first 100 fs and 300 fs, respectively, and highlight the strongest Fourier frequencies with dashed vertical lines. The 42 THz signals are caused by ν2 torsional vibrations (see central inset) and are the experimental signature of the \({{{{{{\rm{SiH}}}}}^{+}_{4}}}\) species. d Shows the integrated absorption from the fine delay scan. A thresholded negative exponential fit reveals the induction time to be 11 ± 3.4 fs.
Whereas the picosecond-spanning measurement probes the stochastic lifetime of the unstable \({{{{{{\rm{SiH}}}}}^{+}_{4}}}\) fragment, the finer delay-step measurement reveals a finite induction time \(\Delta {t}_{{{{{{{\rm{SiH}}}}}^{+}_{2}}}}\) for the reaction. Corresponding experimentally to the delay at which the integrated absorption shows the first sign of change, it reveals the time taken for the system to rearrange into the metastable \({{{{{{\rm{SiH}}}}}^{+}_{4}}}\) and therefore sheds light on the reaction path. From a least-squares fit of the integrated absorption using a thresholded negative exponential decay (see Supplementary Section S3.3 for details), we find that this amounts to \(\Delta {t}_{{{{{{{\rm{SiH}}}}}^{+}_{2}}}}=11\pm 3.4\) fs.
Note that the stark difference in timescales and absence of the stochastic temporal evolution in the 108.6–109.0 eV spectral region is proof that the metastable \({{{{{{\rm{SiH}}}}}^{+}_{4}}}\) species that leads to the \({{{{{{\rm{SiH}}}}}^{+}_{2}}}\) fragment does not decay into \({{{{{{\rm{SiH}}}}}^{+}_{3}}}\). Given the speed of the competing \({{{{{{\rm{SiH}}}}}^{+}_{3}}}\) reaction and the existence of the induction time, the bifurcation must occur very early in the reaction, in close vicinity to the Frank-Condon point, and the paths of the two wavepackets must not re-cross (indicated by a red cross in Fig. 4).
Additional insight into the \({{{{{{\rm{SiH}}}}}^{+}_{2}}}\) dissociation mechanism can be gained by identifying the transient signals of the metastable \({{{{{{\rm{SiH}}}}}^{+}_{4}}}\) species. Perhaps due to the species’ low symmetry or large-amplitude motion, no clear \({{{{{{\rm{SiH}}}}}^{+}_{4}}}\) 2p → 3d/Rydberg absorption features are observed in the experimental results. As we will show next, however, the stronger 2p → antibonding transitions do appear. The synchrotron measurements reveal where these stronger \({{{{{{\rm{SiH}}}}}^{+}_{4}}}\) transients can be expected: Supplementary Fig. S12 compares the L2,3-edge of \({{{{{\rm{SiH}}}}}^{+}_{n}}\) for n = 1–3 indicating that, for n = 4, one would expect absorption between 103 and 108 eV. This spectral region exhibits a large overlap with the absorption of the neutral silane species, where strong depletion and ground state vibrational dynamics are already present. To uncover the \({{{{{{\rm{SiH}}}}}^{+}_{4}}}\) signals these must be removed. The ground-state bleach is corrected by applying a constant 33% depletion correction, while the 15-fs vibrational dynamics of the ground state are removed using a Fourier filter (see Supplementary Section S3.5 for more details). The resulting ground-state-free transient spectra are shown in Fig. 3c, which reveal previously obscured vibrational transients between 103 and 107 eV that decay over the first 100–150 fs.
An FFT over the first 100 fs (middle panel of Fig. 3c) reveals the dominant frequency of these short-lived signals to be between 40 and 50 THz. A longer, higher-resolution FFT (right-hand panel) shows that these signals can be separated in both Fourier frequency and spectral energy. One weaker signal is mostly located below photon energies of 105 eV and exhibits a 50 THz Fourier frequency, matching the \({{\nu }^{{\prime} }}_{2}\) quantum beats of the \({{{{{{\rm{SiH}}}}}^{+}_{3}}}\) fragment and therefore corresponding to the core-antibonding transients of the \({{{{{{\rm{SiH}}}}}^{+}_{3}}}\) species. A second signal exhibits a new Fourier frequency at 42 THz, which is found to be particularly strong at a photon energy of 104.9 eV and more weakly at 103.2 and 105.4 eV. We assign this to the metastable \({{{{{{\rm{SiH}}}}}^{+}_{4}}}\) species. Note that these vibrational signals appear in close spectral proximity to the much higher frequency electronic quantum beats discussed in our previous work16 (whose dominant electronic beats appear at 105.6 and 106.1 eV). The signals, however, are unrelated: the sub-100 meV resolution of our instrument clearly spectrally distinguishes them.
The 42 THz frequency of this quantum beat, together with the induction time of 11 fs identifies the reaction path of the second channel (see Fig. 4). Given the symmetry of the system and the vibrational mode, we expect the observed beats to exhibit the second harmonic of the vibrations they originate from (as is also the case for \({{{{{{\rm{SiH}}}}}^{+}_{3}}}\)). 21 THz falls into the typical range for H–Si–H torsion modes28 and matches the weak 93 meV (22.5 THz) vibronic progression in the photoelectron spectrum of silane29, which has been assigned to the E-symmetry ν2 torsion/scissoring mode with MCTDH simulations30 (see inset above Fig. 3c). Meanwhile, the 11-fs induction time being a quarter of this vibrational period reveals that the dissociation begins once the vibrational wavepacket has reached the local minimum of the PES along the ν2 mode. At this point, a stochastic decay process must become activated which gradually depletes the population of the \({{{{{{\rm{SiH}}}}}^{+}_{4}}}\) species yielding the dissociated \({{{{{{\rm{SiH}}}}}^{+}_{2}}}\) product.
Fig. 4: Schematic of the bifurcating reaction.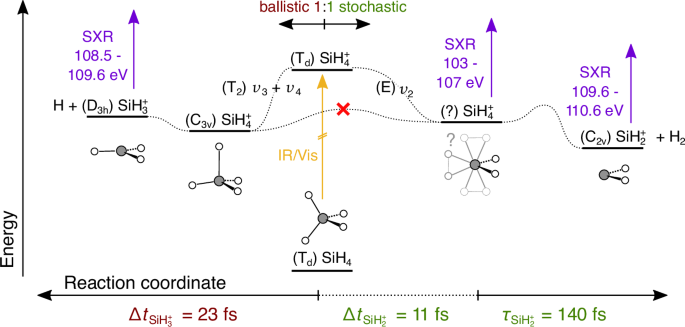
The relevant local minima of the \({{{{{{\rm{SiH}}}}}^{+}_{4}}}\) system (from ref. 36) are plotted as a function of energy vertically and according to the reaction path horizontally. The symmetry and geometry of each minima is also shown. The dotted curves represent the reaction paths that transform one geometry into another and are labelled according to the symmetry of the vibrational mode (in the Td point group) that dominates them. The strong-field ionisation of the pump pulse is represented by the orange arrow while the purple arrows represent the probing of the different states with the delayed isolated attosecond SXR pulse. The spectral regions in which the respective state absorb are indicated as well. The experimentally determined timescales of the reactions are specified at the bottom of the figure.
It is important to emphasise the unique insight offered by these results. Not only are the timescales and vibrational modes involved in the \({{{{{{\rm{SiH}}}}}^{+}_{4}}}\,\to \,{{{{{{\rm{SiH}}}}}^{+}_{2}}}\,+\) H2 chemical transition revealed, but the moment when the compact vibrational wavepacket decoheres is also resolved. From this point on, the reaction proceeds stochastically with no ability to preserve coherence.
Attempts at reproducing the \({{{{{{\rm{SiH}}}}}^{+}_{2}}}\) channel’s observed dynamics with AIMD have revealed the limitations of classical-trajectory calculations. Of the 50 trajectories calculated in their study, Tachikawa24 found only one that yielded \({{{{{{\rm{SiH}}}}}^{+}_{2}}}\). Our own AIMD results, employing 1000 trajectories with initial conditions sampled from a thermal Wigner distribution (rather than the purely thermal distribution used by Tachikawa), yielded an even lower probability of \({{{{{{\rm{SiH}}}}}^{+}_{2}}}\) formation (only 1.4% at 300 K). When the trajectories were sampled at 3000 K, this fraction only increased to 12.9%. These results are clearly inconsistent with the approximately equal branching observed experimentally. Since adiabatic semi-classical AIMD trajectories do not reproduce the dynamics of the \({{{{{{\rm{SiH}}}}}^{+}_{2}}}\) dissociation channel, excited-state dynamics, non-adiabatic dynamics and nuclear quantum effects (such as tunnelling or above-barrier reflection) may be possible explanations for this discrepancy.
This study has shown how the unmatched temporal and energy resolution of our novel approach coupled with the self-sufficiency provided by the in-situ MS yields unprecedented insights into the fastest structural dynamics occurring in nature. Taking the Jahn–Teller driven dissociation of \({{{{{{\rm{SiH}}}}}^{+}_{4}}}\) as an example, we completely resolved and disentangled the quantum dynamics of a bifurcating wave packet, shedding new light on the mechanisms involved. As a result, this study has provided the first spectroscopic observation of the transient \({{{{{{\rm{SiH}}}}}^{+}_{4}}}\) molecule, including its vibrational dynamics and bifurcating reaction paths. It has revealed that the dissociation into \({{{{{{\rm{SiH}}}}}^{+}_{3}}}\,+\) H proceeds ballistically in 22.9 ± 0.5 fs and coherently excites the umbrella motion of \({{{{{{\rm{SiH}}}}}^{+}_{3}}}\). It has also revealed that the dissociation into \({{{{{{\rm{SiH}}}}}^{+}_{2}}}\,+\) H2 proceeds stochastically with a time constant of 140 ± 19 fs, but only after a finite induction time of 11 ± 3.4 fs. The failure of AIMD at reproducing both the [\({{{{{{\rm{SiH}}}}}^{+}_{2}}}\)]:[\({{{{{{\rm{SiH}}}}}^{+}_{3}}}\)] branching ratio and the detailed dynamics of the \({{{{{{\rm{SiH}}}}}_{2}^{+}}}\,+\) H2 channel offers both a notable challenge and a unique benchmark for future quantum-dynamical simulations.
These findings on the JT effect in \({{{{{{\rm{SiH}}}}}^{+}_{4}}}\) are not only fundamentally important, they also answer questions of industrial relevance; the fragmentation dynamics of \({{{{{{\rm{SiH}}}}}^{+}_{4}}}\) are relevant to our understanding of silane plasmas and how they form high-purity amorphous silicon films31, a critical process in the production of low-cost photovoltaic cells and thin-film transistors32.
Looking forward, this study demonstrates the importance of single-femtosecond temporal resolution for the complete characterisation of vibrational dynamics, further developing our understanding of the competing mechanisms that underlie them. The unprecedented capabilities of such experiments can now be extended to more complex systems, such as metal complexes to better understand the mechanisms that govern photocatalysis33, and to light-induced superconductors34,35 for elucidating the quantum-mechanical primary processes controlling such phenomena.