
Quantitative data
Our main data source for numerical sustainability data is the CDP (formerly known as Carbon Disclosure Project) reporting cycle 2023. CDP has collected climate impact disclosure from companies since 2002. Scholars frequently use CDP data to study corporate climate performance over time50,51,52,53. In addition, we use financial data from S&P Capital IQ.
The study includes 89 oil and gas, airlines, and automobile manufacturing companies. These sectors are well-suited for investigating the role of voluntary emission offsetting, as they are characterised by high emissions and include some of the largest emission offsetting companies. In contrast, other hard-to-decarbonise industries, such as steel, cement, and maritime shipping, rarely engage in voluntary offsetting40. The sample includes all passenger airlines and automobile manufacturers that disclose their emissions to CDP. Further, we selected the 40 companies with the highest scope 1 emissions from the oil and gas sector due to the large number of companies in the CDP dataset. PJSC Lukoil was excluded from the analysis due to substantial structural changes in the Russian gas industry during the study period. Consequently, the final sample consists of 39 oil and gas companies, 27 passenger airlines, and 23 automobile manufacturers.
We use data from CDP’s 2023 survey wave to obtain (1) companies’ scope 1, 2 and 3 emissions, (2) carbon credit retirement data (number of credits and project types), (3) emission targets, and (4) purchased allowances under emission trading schemes. Companies’ reporting years in the 2023 CDP survey wave end between 31. March 2022 and 31. March 2023, with the majority (70 companies) reporting for the calendar year 2022. In addition to the 2023 survey wave, we use CDP’s 2018 survey wave to obtain historical scope 1 and 2 emission data. Since 36 companies in our sample did not participate in CDP’s emission disclosure in 2018, we complement the data with information from corporate sustainability or annual reports. For nine companies (Koç Holding, San Miguel Corporation, Copa Holding, Kinder Morgan, Wizz Air Holding, Grupo Aeromexico, NFI Group, Hawaiian Holding, and Chorus Aviation), we have not found scope 1 emission data for 2018.
To improve data reliability, we cross-validate carbon credit retirement data with the largest voluntary carbon market registries of Verra, Gold Standard, and CDM. While the CDM was introduced to enable industrialised countries to reach their emission targets under the Kyoto Protocol, CDM credits can also be retired for voluntary purposes. If a company’s cumulative credit retirements in those carbon market registries are larger than what the company reports to CDP, we use the registry data. Discrepancies between CDP data and registry data happen predominantly in cases where companies offset emissions for fossil products sold to clients (e.g. Inpex Corporation and PETRONAS).
Historical emission performance
We define the historical emission performance as the ratio of scope 1 emissions reported in the CDP survey waves 2023 and 2018. We do not include scope 2 emissions since 20 companies in the sample did not report scope 2 emissions in 2017, and 13 further companies reported scope 2 emissions in 2017 without disclosing whether they used the location-based or market-based accounting approach. Further, location-based scope 2 emissions are heavily influenced by grid-emission factors, while market-based scope 2 emissions can be lowered through the purchase of renewable energy attributes that have been shown to have little effect on renewable energy expansion28,29. To ensure robustness, we present findings that include changes in combined scope 1 and 2 emissions in the supplementary information (Table S4). Further, we do not consider scope 3 emissions since current reporting practices do not allow for meaningful cross-organisational comparison54. We exclude Mercedes-Benz Group from the emission analysis due to the spin-out of Daimler Truck in December 2021. Further, we exclude Inpex Corporation from the emission analysis since it is an outlier with a 1085% increase in scope 1 over the study time. In the supplementary information we illustrate with a leave-one-out cross-validation that Inpex Corporation is the only data point that influences the results substantially (see Supplementary Information Fig. S1).
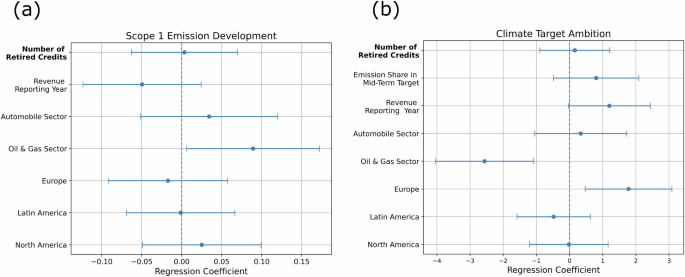
We perform ordinary least squares (OLS) regression using the python package statsmodels (version 0.14.1) to estimate the association between retired carbon credits and the change in historical emission reductions. We control for companies’ sizes, industrial sectors, and continents of headquarters. We estimate:
$${Y}_{i}={\beta }_{0}+{\beta }_{1}{X}_{i}+{\beta }_{2}{C}_{i}+{\epsilon }_{i}$$
(1)
where i indexes the companies, Yi is a company’s ratio of scope 1 emissions reported in the CDP survey waves 2023 and 2018, Xi is the number of carbon credits a company retired in CDP’s 2023 reporting cycle, Ci are the control variables, and ϵi represents the error term, capturing unobserved factors affecting Yi. We control for revenue, sector, and continent of headquarters. We convert the categorical variables for the sector (automobile, oil and gas, and airlines) and the continent of headquarters (Asia, Europe, Latin America, and North America) into binary indicator columns (i.e. one-hot encoding). That means in the regression, each categorical variable equals 1 if a company belongs to a specific sector or is headquartered in a particular region and 0 otherwise. To avoid multicollinearity, we excluded the sectoral category “Airlines” and the geographical category “Asia” from the regression. These omitted categories serve as the reference groups against which the effects of other categories are compared.
Climate target ambition
It is difficult to compare climate target ambition due to differences in scope, base years and target years. Therefore, corporate climate targets must be harmonised before they can be directly compared across companies55. Here we calculate the ambition for each emission scope (scope 1, 2, and 3) and then add the ambitions weighted with the relative importance of that scope for a specific industry (relative importance = avg. share of total emissions for scope n in industry X).
We use the following assumptions and simplifications to construct the target emission trajectories between 2020 and 2050 in line with previous studies that compared climate targets across organisations:
Between intermediate targets, emission trajectories are linear55.
Emissions that are not covered by any target remain unchanged55,56
We only consider company-wide targets, not product targets – e.g. when a company sells oil and gas but only has a target for their oil operation, we do not regard it since a reduction in oil emissions could be compensated by increased gas production. The only exception is when there are product-level targets for all main products of a company (e.g. separate targets for oil and gas operation). This assumption helps to avoid the difficulties of aggregating product-level emission-intensity targets for integrated energy companies that often sell different energy and non-energy products56 by constructing a company-wide intensity metric.
In line with SBTi’s net zero standard6, we accept both absolute and intensity targets. If, for the same year, intensity and absolute targets are given, we use the absolute target. While other studies also accept absolute and intensity targets55,56, in contrast to Bolay et al. (2022), we do not use the associated expected change in absolute emissions for intensity targets that companies need to report to CDP. Instead, we directly use the targeted change in emission intensity to construct a company’s emission trajectory. The deviation from previous studies is due to low data quality for the expected change in absolute emissions for intensity targets. Often, it is unclear if companies correctly use positive and negative numbers to indicate expected increases or decreases in absolute emissions. Further, it is not possible to verify the data since this data is typically not reported in annual or sustainability reports. To verify that companies that use intensity targets do not systematically set more ambitious climate targets, we show in the Supplementary Information that the share of a company’s target that is covered by intensity targets is not significantly correlated with its target ambition (Table S5) and, therefore, does not bias the result reported in the regression analysis.
We assign an ambition score for each subtarget by comparing planned emission trajectories with emission reductions in line with the annual average of all 1.5 degree Celsius warming emission scenarios from IPCC’s Sixth Assessment Report57 Studies that evaluated climate targets compare target ambitions either to emission trajectories58 or to targeted average annual change in emissions55,56. We choose to compare companies based on the targeted cumulative emissions until 2050 instead of targeted average annual changes in emissions since not only the average change in emissions but also the shape of the emission trajectory is directly linked to global warming. The choice of the reference emission trajectory is not relevant for the regression results since it is the same constant that is deducted from each observation and, hence, does not influence the regression coefficients. Further, we do not use different reference emission trajectories per sector or geography to avoid biasing our regression results. Instead, we explicitly control for geography and sector in the regression.
Figure 6 illustrates how we translate emission targets to emission trajectories and target ambition for the example company A. Company A’s emission target only covers 90% of its emissions. Therefore, we assume that 10% of emissions remain unchanged. First, we construct the emission trajectory between the base year and target years, assuming emissions decline linearly. Second, we set 2020 as the reference year where emissions are at 100%. Finally, we quantify the target ambition as the area between the targeted company emission trajectory and the average of IPCC’s 1.5 degree Celsius warming emission scenarios:
$${\rm{Target}}\, {\rm{Ambition}}\,= \mathop{\sum }\limits_{n=1}^{3}\left({\rm{avg}}\_{\rm{share}}\_{\rm{scope}}\_n\right. \\ \times \left(\int _{2020}^{2050}\,{\text{IPCC}}\_1.5\_{\rm{scenario}}\,\,dt\right. \\ \left.\left.- \int _{2020}^{2050}\,{\text{Company}}\_{\rm{target}}\_{\rm{scope}}\_n\,dt\right)\right)$$
(2)
Fig. 6: Illustration of target ambition calculation.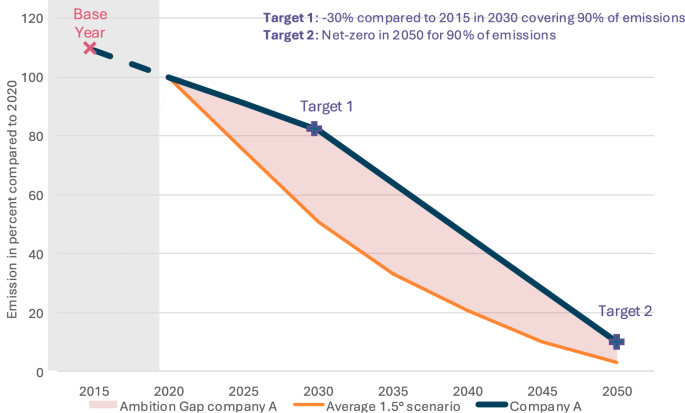
Illustration of emission target quantification for company A. The red area is the magnitude of ambition. Since the targeted emission trajectory is higher than the 1.5° degree trajectory, the ambition is negative.
Positive target ambition values indicate targets surpassing the reference scenario’s ambition, negative target ambition values fall short of the reference scenario’s ambition, and values of zero indicate an exact match with the average of IPCC’s 1.5 degree Celsius warming emission scenarios.
We perform OLS using the python package statsmodels (version 0.14.1) to estimate the effect size of using carbon credits on the companies’ climate target ambitions. We estimate:
$${Y}_{i}={\beta }_{0}+{\beta }_{1}{X}_{i}+{\beta }_{2}{C}_{i}+{\epsilon }_{i}$$
(3)
where i indexes the companies, Yi is a company’s climate target ambition (eq. (2)), Xi is the number of carbon credits a company retired in CDP’s 2023 reporting cycle, Ci are the control variables, and ϵi represents the error term, capturing unobserved factors affecting Yi. We control for revenue, sector, continent of headquarters, and share of emissions covered by intermediate targets on the path to net zero. We convert the categorical variables for the sector (automobile, oil and gas, and airlines) and the continent of headquarters (Asia, Europe, Latin America, and North America) into binary indicator columns (i.e. one-hot encoding). That means in the regression, each categorical variable equals 1 if a company belongs to a specific sector or is headquartered in a particular region and 0 otherwise. We include the share of emissions covered by intermediate targets (i.e. emission targets that are no net zero targets) to avoid systematically favouring companies that set only long-term net zero targets without intermediate goals. For instance, a company with a net zero target for 2050 but no intermediate targets would appear to have higher target ambition than the exemplary company depicted in Fig. 6, as the red area decreases without Target 1.
Purpose of emission offsetting
Besides the quantitative evaluation of how many carbon credits companies retire, we qualitatively evaluate how companies use carbon credits over time using the qualitative data analysis software Atlas.ti. We manually scanned through 488 corporate sustainability and annual reports for the years 2014−2023 using the search words “offset”, “carbon credit”, “carbon market”, “compensate”, and “compensation”. We assigned codes when the text passage revealed the purpose of voluntary carbon credit retirement. We tagged 522 text passages on carbon credit usage in 238 distinct documents.
We manually classify the use case of carbon credits into five categories:
Retirement to meet emission targets: Companies plan to use carbon credits to reach an emission target. The quantity of retired carbon credits depends on the gap to target completion.
Offsetting fixed portion of emissions: Companies define a fixed portion of their emissions to offset (e.g. scope 1, scope 2, specific product).
Employees’ business travel
Customer Offsetting: Companies either offer customers the service to purchase carbon credits during checkout (mostly business to consumer) or offer pre-offset products (both business to consumer and business to business).
Other: Offset usage that does not fit in other categories. These are often pilot projects to source carbon credits in preparation for compliance schemes or fixed-term marketing events.
Carbon credit costs estimation
Prices companies pay for carbon credits are not publicly available at a granular level. Therefore, we estimate feasible price ranges by using the lowest prices reported by companies (USD 3.72 by easyJet59) in our sample as the low end of the price range and average credit prices 2022 by project type reported by Ecosystem Marketplace60 as the upper end of the price range. Using Ecosystem Marketplace’s data as an upper bound is a feasible assumption for the upper end of the feasible price range since companies in our sample are multinational companies purchasing relatively large quantities of carbon credits. Therefore, we assume these companies do not pay prices above the market average. We estimate the lower (boundarylow) and upper (boundaryhigh) boundary of the feasible carbon credit cost range for company i purchasing carbon credits from project type n as:
$${\text{budget}}\, {\rm{boundary}}_{low,i}={\text{credit}} \,{\rm{price}}_{easyJet} * {\text{credits}} \,{\rm{retired}}_{CDP2023,i}$$
(4)
$${\text{budget}} \,{\rm{boundary}}_{high,i}=\sum _{n}\left({\text{avg}}\, {\rm{credit}}\, {\rm{price}}\, {\rm{price}}_{n} * {\text{credits}} \,{\rm{retired}}_{n,i}\right)$$
(5)
To put the costs of carbon credits in perspective, we compare them with companies’ CAPEX and costs of emission allowances under compliance emission trading schemes. CAPEX, which represents the funds a company spends to buy or improve assets, helps assess whether carbon credit costs are substantial enough to compete with investments in internal decarbonisation. Additionally, by comparing these costs to compliance emission pricing mechanisms, we evaluate whether carbon offsetting incentivises companies to accelerate decarbonisation efforts beyond existing regulation.
ETS cost estimation
We estimate the costs for emission allowances in European emission trading schemes (EU-ETS, UK-ETS, and Switzerland-ETS) by multiplying the number of allowances a company purchased under a specific ETS with average allowance prices in 2022. Companies disclose the number of allocated allowances, purchased allowances, and overall emissions under ETSs in the CDP survey40. Average ETS prices in 2022 are based on the World Bank’s carbon pricing database (EU ETS: USD 86.52, UK ETS: USD 98.99; Switzerland: 65.59 USD)46. The only exception is easyJet, which does not disclose the number of purchased allowances in the CDP report. Here we determine the number of purchased emission allowances as the difference between scope 1 emissions under the different ETSs disclosed to CDP40 and publicly available information on allocated emission allowances61,62,63.
Reporting summary
Further information on research design is available in the Nature Portfolio Reporting Summary linked to this article.