
Study populations
This study complies with all relevant ethical regulation and was approved by the appropriate ethics committees. Our study combined three ethically approved cohorts. In our local MODY cohort, all probands or their guardians provided informed consent, and the North Wales Ethics Committee approved the study, with Genetic Beta Cell Research Bank approving sample access. The National Institute for Health Research (NIHR) Exeter Clinical Research Facility management committee approved access to these samples and genotype data for our T2D and non-diabetic controls. This research also utilized data from the UK Biobank resource carried out under UK Biobank application number 103356. UK Biobank protocols were approved by the National Research Ethics Service Committee.
Exeter MODY cohortMODY individuals with confirmed pathogenic variants
We analysed individuals referred for monogenic diabetes genetic testing at the Exeter Genomics Laboratory, Royal Devon University Healthcare NHS Foundation Trust, Exeter, UK. These referrals originated from clinical suspicion of MODY during routine clinical care in the UK. These individuals were found to have likely pathogenic or pathogenic variants either by Sanger sequencing or gene panel test performed as part of routine clinical care. Our cohort comprised European individuals with diabetes and carrying pathogenic variants in HNF1A (n = 997), HNF1B (n = 145) or HNF4A (n = 320). We focused on the more commonly diagnosed, age-dependent forms of MODY (HNF1A, HNF4A and HNF1B). We excluded GCK-MODY because it represents a fundamentally different disease: individuals present with lifelong, mild fasting hyperglycaemia that does not progress with age, does not require treatment and is not associated with excess complications33. In this context, age at diagnosis reflects the timing of detection rather than age at disease onset.
Unsolved MODY individuals
We evaluated 300 European individuals referred from routine clinical care in the UK with suspected MODY. All participants received their diabetes diagnosis before age 30 years and lacked clinical features suggestive of T2D (BMI ≥ 30 kg m−2) or T1D (positive islet autoantibodies, C-peptide <200 pmol l−1 and a ten-SNP T1D genetic risk score above the 50th centile of the gold-standard T1D population from the WTCCC study)22. These individuals underwent comprehensive genetic testing for all known monogenic diabetes genes (n = 58) and were not found to have pathogenic variants in these genes. The clinical features of these solved and unsolved MODY cases, at referral for genetic testing, are summarized in Supplementary Table 1.
Type 2 diabetes and non-diabetes control cohort
We analysed participants from two ethically approved population cohorts in Southwest England: the Exeter 10000 study (https://exetercrfnihr.org/about/exeter-10000/)34 and the Diabetes Alliance for Research in England study (https://www.diabetesgenes.org/current-research/dare/)35. These studies recruited unselected participants through primary care practices across the Southwest United Kingdom. At recruitment, participants completed baseline questionnaires and provided fasting blood and urine samples for measurement of diabetes-related markers, including fasting glucose and HbA1c. Our analysis included European individuals who underwent array genotyping as part of these studies. We classified participants as having T2D if they either did not require insulin treatment or initiated insulin treatment after 36 months from diagnosis, thereby excluding potential misclassified T1D cases. We defined controls as individuals without a known diabetes diagnosis and HbA1c ≤ 48 mmol mol−1 (6.5%)36. The final cohort comprised 7,645 controls and 4,773 individuals with T2D, with their clinical characteristics presented in Supplementary Table 1.
UK Biobank cohort
The UK Biobank represents a large-scale, prospective population-based study comprising approximately 500,000 UK residents aged 40–70 years at enrolment37. Recruitment occurred between 2006 and 2010, with comprehensive data collection through multiple channels: participant questionnaires, structured interviews and biomarker measurements37. The study supplemented this information with medical history data from Hospital Episode Statistics records coded using ICD-9 and ICD-10 codes. We defined diabetes status using three criteria: self-reported diagnosis, HbA1c levels ≥6.5 % at recruitment or active diabetes treatment at recruitment. Our study cohort consisted of 424,553 European individuals who underwent exome sequencing and array genotyping. Clinical characteristics of these individuals can be found in Supplementary Table 10. We analysed the exome sequence data to identify individuals with likely pathogenic and pathogenic variants in HNF1A/HNF4A/HNF1B as described previously4, with details of variants identified in Supplementary Table 11.
Genetic analysisMODY pathogenic variants in Exeter MODY cohort and UK Biobank
For the Exeter MODY cohort, all referred patients were screened for potential MODY-associated variants using either Sanger sequencing or gene panel testing, following the methodologies detailed by Ellard et al.38. For the UK Biobank participants, we utilized exome sequence data to identify carriers of pathogenic MODY variants. We annotated all variants using clinically validated transcripts: GenBank NM_000545.6 for HNF1A, NM_000458.4 for HNF1B and NM_175914.4 for HNF4A. We classified variants according to the American College of Medical Genetics and Genomics/Association of Molecular Pathology guidelines, designating them as either likely pathogenic (class 4) or pathogenic (class 5)39. This classification process followed our established protocols for the local Exeter cohort and aligned with our recent study’s methodology4. Supplementary Table 11 presents a comprehensive list of variants identified in the UK Biobank cohort.
Array genotyping
Exeter MODY, T2D and non-diabetic controls
We performed array genotyping using the Infinium Global Screening Array platform. Our comprehensive quality control protocol excluded samples with call rates below 98%, sex mismatches, relationship discrepancies or inbreeding coefficients exceeding 0.1. At the variant level, we removed markers with missingness above 2%, minor allele frequency below 5% or deviation from the Hardy–Weinberg equilibrium (P < 1 × 10⁻⁶). We applied these quality control measures both independently for each batch and following batch integration. We then used linkage disequilibrium (LD) pruned markers for genotype imputation through the TOPMed reference panel v.2 (ref. 40) via the Michigan Imputation Server41. To determine genetic ancestry, we compared our data with reference populations from the 1000 Genomes Phase 3 and Human Genome Diversity Project, implementing a principal component analysis (PCA) approach within the GenoPred Pipeline (v.2.2.1)42,43. For relationship inference, we analysed LD-pruned data using the KING robust algorithm (v.2.2.4) to identify unrelated individuals up to the third degree44. To better capture the within-cohort population structure, we conducted PCA using FlashPCA (v.2.0)45. Initially, we calculated principal components in unrelated European individuals and then projected these onto related European individuals.
UK Biobank
The UK Biobank individuals were SNP-genotyped using the UK BiLEVE array for the first ~50,000 individuals, with the remaining using the UK Biobank Axiom array. This dataset underwent central quality control by the UK Biobank and was imputed to the TOPMed reference panel40. Approximately 450,000 individuals from the UK Biobank Array also underwent exome sequencing using the IDT xGen Exome Research Panel v.1.0. Detailed sequencing methodology for UK Biobank samples has been described previously46. In brief, variants were called using GATK v.3.0 filtering variants with an inbreeding coefficient <−0.03 or without at least one variant genotype of DP ≥ 10, GQ ≥ 20 and, if heterozygous, AB ≥ 0.20. For this analysis, we included 424,553 individuals who had both exome and array data and were of European ancestry, inferred from projected PCA using the same approach as for the local cohort.
Polygenic score calculation
We calculated polygenic scores for T2D20, T1D47 and seven diabetes-related traits48,49,50,51,52, alongside eight pathway-specific T2D risk scores20. We constructed weighted polygenic scores using genome-wide significant variants. For traits with comprehensive genome-wide association study (GWAS) summary statistics available, we implemented genome-wide calculations to capture additional genetic signal. Our computational pipeline utilized PLINK 1.9’s score function for genome-wide significant variant-based scores53. For the genome-wide polygenic scores, we implemented the GenoPred v.2.2.1 pipeline with the LDpred2 auto model, enabling comprehensive processing of GWAS summary statistics43,54. Further details are available in Supplementary Table 3, including the specific approach used for each trait, including the calculation method, number of variants incorporated and the source GWAS studies.
Heritability estimation
To estimate the common variant contribution to MODY and T2D, SNP-based heritability was estimated in unrelated individuals using GCTA GREML-LDMS, stratifying into four LD bins of equal size to construct the genetic relationship matrix.55 To test the validity of these estimates we ran phenotype correlation–genotype correlation and restricted maximum likelihood approaches implemented in LDAK, using thinned predictors to construct the kinship matrix56,57. We used sex, age and the first ten within-cohort principal components as covariates for each method. For MODY, disease prevalence was set at 0.00054 and 0.0002526, and for T2D, at 0.158 (Table S12). Variants with an imputation quality > 0.9 and minor allele frequency > 1% were used to in this analysis.
Statistical analysisAssessing common variant enrichment in MODY cohort
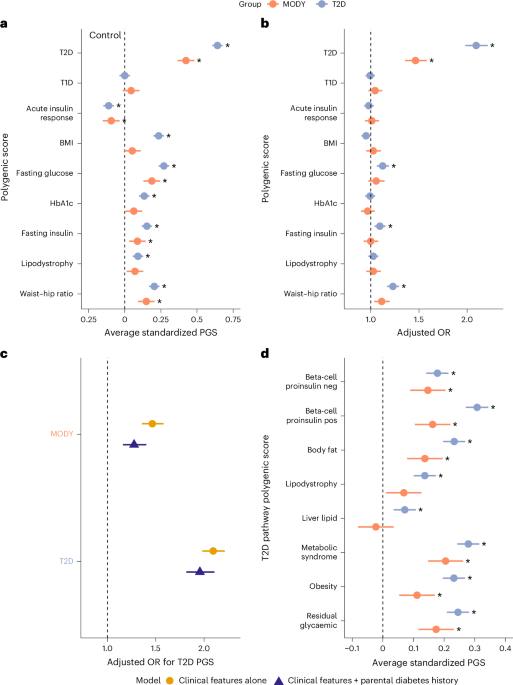
To assess polygenic risk in MODY carriers and T2D cases, we employed several different approaches. To initially assess whether any common variant pathways contribute to clinically referred HNF-MODY we tested nine PGSs for enrichment. All scores were standardized using the control group as reference (mean = 0, s.d. = 1). To test differences in polygenic scores from controls, we used linear models adjusting within-cohort principal components to control for population structure. We assessed each score individually first, however, due to well-known overlaps of variants across these related metabolic traits, we then performed multivariable logistic regression analysis to identify the key independent common variant pathways contributing to HNF-MODY after adjusting for sex, age, BMI and the first ten within-cohort principal components. We repeated these steps with unsolved MODY cases to examine the hypothesis that they have excess polygenic risk. Owing to the high parental history in MODY that may tag inherited polygenic risk, we then performed further analysis adjusting for parental history of diabetes. We performed sensitivity analysis by limiting to each gene and to probands alone. To investigate whether less-deleterious variants are associated with higher polygenic enrichment, we first grouped variants into missense and protein-truncating variants (PTVs), with PTVs assumed to be the most deleterious due to their likely haploinsufficiency effect. We further stratified missense variants by REVEL59 (Rare Exome Variant Ensemble Learner) score (<0.9 versus ≥0.9), using it as a proxy for functional severity.
We aimed to include the largest number of MODY cases to maximize the power of the study but were limited by sample and data availability. Based on our final sample size, a post hoc power calculation suggested that we had 80% power to detect minimum differences of 0.08, 0.16 and 0.05 s.d. in polygenic score between controls and genetically confirmed HNF-MODY, unsolved MODY and T2D, respectively. The minimum detectable differences for the clinically referred MODY genetic subgroups were 0.23, 0.16 and 0.094 s.d. for HNF1A, HNF1B and HNF4A, respectively.
Assessing impact of common variants on HNF-MODY phenotype
To investigate how common genetic variants influence the clinical presentation of HNF-MODY, we used mixed-effects models to assess associations between PGSs and key outcomes. Specifically, we applied mixed linear models to evaluate the relationship between PGSs and age at diabetes diagnosis, and mixed logistic models to assess associations with diabetes severity. To account for potential within-family correlations that could bias associations, all models included family ID as a random effect. Initial models included all nine polygenic scores to identify independent genetic pathways contributing to variation in clinical presentation. Further analysis focused on scores that were found to be independently associated with modifying the clinical presentation in HNF-MODY, further adjusting for confounding factors that have been previously reported or suspected to influence clinical outcomes. This included sex, age, BMI, year of diabetes diagnosis, proband or family member, variant location, parental history of diabetes (stratified by mother, father or both to capture potential intrauterine exposure), along with the first ten within-cohort principal components. To account for gene-level differences, we included genetic aetiology (MODY gene) as a covariate and examined outcomes separately by gene.
Assessing impact of common variants on clinically unselected HNF-MODY carriers
HNF-MODY carriers in the UK Biobank allowed us to assess how common variants affect diabetes risk in a clinically unselected setting. We modelled the probability of diabetes using logistic regression, with T2D PGS as a continuous covariate alongside MODY carrier status and relevant clinical characteristics including sex, age, BMI, parental history of diabetes and the first ten ancestry principal components. Among clinically unselected HNF-MODY carriers, we had 80% power to detect an OR greater than 1.58 per s.d. increase in T2D PGS, below the observed effect size of 2.17. To examine how diabetes risk varies across T2D common variant burden, we computed marginal effects per PGS percentile. Additionally, individuals were stratified into low, intermediate or high PGS groups, defined as the bottom quintile, middle three quintiles and top quintile, respectively, using non-MODY carriers with intermediate T2D risk as the reference group. We used logistic regression to assess differences in diabetes risk relative to the reference group, adjusting for the same covariates.
All statistical analyses were performed using R v.4.4.1 and Stata v.18.
Reporting summary
Further information on research design is available in the Nature Portfolio Reporting Summary linked to this article.