
Abstract
Background
To better understand the interplay between adiposity and metabolic health, joint phenotypes have been used to categorize people as being metabolically healthy (MH) or metabolically unhealthy (MU) while having a body mass index (BMI) indicative of obesity, overweight, or normal weight. This study examines the prevalence of these phenotypes in adults, the factors associated with them, and their relationship with adverse health outcomes.
Data and methods
Three cycles of the Canadian Health Measures Survey (from 2014 to 2019) were combined to characterize adults aged 20 to 79 years as MU if they had at least three out of five measures of elevated waist circumference, elevated triglycerides, reduced high-density lipoprotein cholesterol, elevated blood pressure, or elevated fasting glucose. Measured BMI, categorized as indicative of normal weight, overweight, or obesity, was combined with MH or MU to produce six joint phenotypes. Phenotype prevalence was examined across selected characteristics and separate multivariable logistic regression models estimated the association with self-reported health status and morbidity indicators.
Results
One in four Canadian adults was either MU with obesity or MU with overweight. These phenotypes were more prevalent at older ages. Among MH adults, higher BMI was associated with worse self-rated general health. MU adults with obesity were 1.8 times more likely to report worse general health than MH adults with obesity. MU adults with obesity or with overweight were 1.2 times more likely to have higher levels of systemic inflammation than MH adults with obesity or overweight. Higher BMI, regardless of metabolic health, was associated with higher levels of systemic inflammation.
Interpretation
Gaining insight into the population prevalence of metabolic health and BMI phenotypes and their association with health risks can help improve awareness and inform health promotion strategies.
Keywords
body mass index, metabolic health, overweight, obesity, prevalence, adult, health surveys.
Authors
Tracey Bushnik, Rachel Colley, Joel Barnes, and Douglas G. Manuel are with the Health Analysis and Modelling Division at Statistics Canada. Douglas G. Manuel is also with ICES in Ottawa, Ontario; the Department of Family Medicine at the University of Ottawa; and the C.T. Lamont Primary Health Care Research Centre at the Bruyère Research Institute in Ottawa, Ontario, Canada.
What is already known on this subject?
Obesity is associated with increased morbidity, increased risk of long-term medical complications, high health care costs, and reduced life expectancy.
Obesity is also associated with cardiometabolic abnormalities, including elevated waist circumference, elevated triglycerides, reduced high-density lipoprotein cholesterol, elevated blood pressure, and elevated fasting glucose.
Joint phenotypes have been used to categorize people as being metabolically healthy (MH) or metabolically unhealthy (MU) while having a body mass index (BMI) indicative of obesity, overweight, or normal weight to better understand the interplay between adiposity and metabolic health and the associated risks of negative health outcomes.
What does this study add?
One in four Canadian adults is MU with obesity or with overweight, and these conditions are more common at older ages.
Among MH adults, higher BMI is associated with poorer self-rated general health.
MU adults with obesity report worse general health than MH adults with obesity.
Higher BMI is associated with greater systemic inflammation, regardless of metabolic health.
Adults who are MU with higher BMI show the highest levels of inflammation.
Introduction
About one in four Canadian adults has a body mass index (BMI) indicative of obesity.Note 1 Obesity is a chronic complex disease defined by excessive adiposity that can impair health.Note 2 It is associated with reduced life expectancy; increased morbidity, including cancer and cardiovascular disease (CVD); and high health care costs.Note 2, Note 3 Obesity is also associated with increased risk for CVD risk factors, such as type 2 diabetes, hypertension, and dyslipidemia.Note 3 These CVD risk factors result from impaired metabolic health, which is commonly defined as increased triglycerides, reduced high-density lipoprotein cholesterol (HDL-C), abdominal obesity, and elevated blood pressure (BP) or elevated fasting glucose.Note 4, Note 5 Impaired metabolic health, in turn, is associated with increased risk of morbidity, including coronary heart disease,Note 6 cancer,Note 7 ocular diseases,Note 8, Note 9 and fatty liver disease.Note 10
The interplay between adiposity and metabolic health has been studied through joint phenotypes that categorize people as being metabolically healthy (MH) or metabolically unhealthy (MU) while having a BMI indicative of obesity, overweight, or normal weight.Note 6, Note 11, Note 12, Note 13, Note 14, Note 15, Note 16 Definitions of “metabolic health” in the literature are inconsistent and often include overlapping, but not identical, components of metabolic syndrome.Note 17 Some studies apply formal clinical definitions, while others use operational or modified versions, leading to varying population estimates of phenotype prevalence.Note 4 Liu et al. characterized metabolic health status based on the risk factors proposed by the International Diabetes Federation and the American Heart Association and National Heart, Lung, and Blood Institute.Note 17 They reported that 20% of adults in the United States were MH with overweight and 14% were MH with obesity, whereas 11% of adults were MU with overweight and 26% were MU with obesity.Note 12 Meanwhile, van Vliet-Ostaptchouk et al. applied metabolic health criteria proposed by the Expert Panel on Detection, Evaluation, and Treatment of High Blood Cholesterol in AdultsNote 18 and reported age-standardized cohort-specific prevalence of MH obesity ranging from 2% for men and 12% for women in Finland to 19% of men and 21% of women in Italy.Note 19
Studies have also found varying risk of negative health outcomes across phenotypes,Note 20 with systemic inflammation16 and potential confounding factors, such as age, education,Note 6 smoking,Note 21 and physical activityNote 3 (PA), playing a role. Caleyachetty et al. reported that MH individuals with obesity had a higher risk of coronary heart disease, cerebrovascular disease, and heart failure than MH individuals with normal weight.Note 14 In their systematic review and meta-analysis, Kramer et al. concluded that compared with MH people with normal weight, people with obesity—even in the absence of metabolic abnormalities—were at increased risk of all-cause mortality and cardiovascular (CV) events.Note 15 However, Kip et al. suggested that the components of impaired metabolic health, and not higher BMI, are the main risk factors for an adverse CV event.Note 16
Little is known about the population prevalence of these phenotypes and how they are associated with negative health outcomes in Canada. Using measured and self-reported data from the Canadian Health Measures Survey (CHMS), this study examines the prevalence of the phenotypes among adults aged 20 to 79 years, factors that may differentiate these phenotypes, and the association between the phenotypes and health status and morbidity indicators. Given that obesity is a costly public health issue that negatively affects physical and psychological health,Note 2 understanding who may be at additional risk owing to their metabolic health status can help inform health promotion strategies.
Data and methods
Data
Data from Cycle 4 (January 2014 to December 2015), Cycle 5 (January 2016 to December 2017), and Cycle 6 (January 2018 to December 2019) of the CHMS were combined. The CHMS is a cross-sectional survey that collects questionnaire data and directly measured health information from community-dwelling individuals aged 3 to 79 living in the 10 provinces. People living in the three territories or on reserves and settlements in the provinces, the institutionalized population, residents of certain remote regions, and full-time members of the Canadian Forces are excluded (about 4% of the Canadian population). The CHMS involves visiting a mobile examination centre (MEC) following an in-person household interview. Prior to the household interview, some dwellings are randomly flagged to indicate that a respondent should fast for at least 10 hours before the MEC appointment. The household interview gathers detailed information on health, nutrition, and lifestyle. At the MEC, there is an interview, and direct physical measurements are taken— such as BP, height, and weight—and samples of blood and urine are collected.
Current medications are recorded during the household and clinic interviews and are assigned to codes from the Anatomical Therapeutic Chemical (ATC) classification system. Ethics approval for the CHMS was received from Health Canada’s Research Ethics Board.Note 22 Further information about the CHMS is available online.Note 23
Those aged 20 to 79 years old who fasted prior to their visit to the MEC and were not pregnant at the time of data collection were eligible for this analysis: n=1,565 (Cycle 4), n=1,551 (Cycle 5), and n=1,569 (Cycle 6). Eligible respondents were excluded from the analysis if their BMI was less than 18.5 kg/m2 or if it was not possible to derive a phenotype because of missing data for the components of impaired metabolic health (n=97). The final analytical sample sizes were n=1,528 (Cycle 4), n=1,523 (Cycle 5), and n=1,537 (Cycle 6) for a total analytical sample size of 4,588.
Measures and definitions
Height: Height was measured to the nearest 0.1 cm using a ProScale M150 digital stadiometer (Accurate Technology Incorporated, Fletcher, United States).
Weight: Weight was measured to the nearest 0.1 kg with a Mettler Toledo VLC with Panther Plus terminal scale (Mettler Toledo Canada, Mississauga, Canada).
BMI: BMI categories for respondents who reported being Korean, Filipino, Japanese, Chinese, South Asian, or Southeast Asian were defined as with normal weight (BMI of less than 23 kg/m2), overweight (BMI of 23 kg/m2 to less than 25 kg/m2), or obesity (BMI of 25 kg/m2 or greater).Note 24 BMI categories for the remaining respondents were defined as with normal weight (BMI of less than 25 kg/m2), overweight (BMI of 25 kg/m2 to less than 30 kg/m2), or obesity (BMI of 30 kg/m2 or greater).Note 25
BP: Systolic BP (SBP) and diastolic BP (DBP) were measured with the BpTRUTM BPM-300 automated oscillometric device (BpTRU Medical Devices Ltd., Coquitlam, British Columbia) at the MEC. Six BpTRUTM readings were taken for each CHMS participant, with the last five averaged to determine the SBP and DBP levels.Note 26
Waist circumference (WC): WC was measured to the nearest 0.1 cm, directly on the landmarked skin, with a flexible, inelastic measuring tape with an attached tension metre. The measure was taken at the highest point of the iliac crest.Note 27
Components of metabolic health: Based on the diagnostic risk factors for metabolic syndrome proposed by the International Diabetes Federation and the American Heart Association and National Heart, Lung, and Blood Institute, the following five criteria were included in this study as components of impaired metabolic healthNote 17 and defined as follows:
Elevated WC for respondents who reported being South Asian, Chinese, Filipino, Southeast Asian, Korean, or Japanese was defined as 90 cm or greater for males and 80 cm or greater for females.Note 17 Elevated WC for the remaining respondents was defined as 102 cm or greater for males and 88 cm or greater for females.Note 17
Elevated BP was defined as having SBP of 130 mmHg or greater or DBP of 85 mmHg or greater or taking medication in the past month corresponding to beta blockers (ATC codes in category C07, excluding C07AA07, C07AA12, and C07AG02), agents acting on the renin-angiotensin system (ATC codes in category C09), thiazide diuretics (ATC codes in category C03, excluding C03BA08 and C03CA01), calcium channel antagonists (ATC codes in category C08), or other antihypertensives (ATC codes in category C02, excluding C02KX01).Note 17
Elevated triglycerides were defined as having triglycerides (measured in serum) of 1.7 mmol/L or greater or taking medication in the past month to treat elevated triglycerides (fibrates: ATC codes in C10AB).Note 17
Reduced HDL-C was defined as having HDL-C (measured in serum) less than 1.0 mmol/L in males and less than 1.3 mmol/L in females or taking medication in the past month for reduced HDL-C (nicotinic acid and derivatives: ATC codes in C04AC).Note 17
Elevated blood glucose was defined as having fasting glucose (measured in serum) of 5.6 mmol/L or greater or taking medication in the past month to treat elevated glucose (ATC codes in A10).Note 17
MH was defined as having two or fewer components of impaired metabolic health, consistent with the approach used by Liu et al.Note 12
MU was defined as having at least three out of five components of impaired metabolic health, consistent with the approach used by Liu et al.Note 12
Phenotypes refer to sets of characteristics that represent the interaction of genetic, environmental, and metabolic factors. Individuals were classified into six distinct phenotypes based on their combined metabolic health status and BMI category: (1) MH with normal weight, (2) MH with overweight, (3) MH with obesity, (4) MU with normal weight, (5) MU with overweight, and (6) MU with obesity.
Covariates
Sex at birth (male or female) and age in years were reported at the visit to the MEC.
Age groups were 20 to 39 years, 40 to 59 years, and 60 to 79 years. The highest level of education of the respondent was categorized into postsecondary graduate or not (yes or no). Smoking status was categorized into current daily smoker or not (yes or no). Self-reported total minutes per week of PA were categorized into meeting the PA guidelines of 150 minutes of activity per week or not (yes or no).
Health status and morbidity indicators
Self-rated general and mental health were each dichotomized by combining fair and poor into one category and good, very good, and excellent into the other. CVD conditions included self-reported heart disease, history of heart attack, and history of stroke and were dichotomized into none and one or more. Non-CV chronic conditions that have been linked to impaired metabolic health, obesity, or both were selected from self-reported, diagnosed long-term conditions expected to last (or that had already lasted) six months or more, including asthma,Note 28, Note 29 arthritis,Note 30 osteoporosis,Note 31, Note 32 cancer,Note 7, Note 33 liver or gallbladder disease,Note 34 inflammatory bowel disease (cycles 5 and 6 only),Note 35, Note 36 glaucomaNote 8 (cycles 5 and 6 only), and cataracts (cycles 5 and 6 only).9 These were summed and categorized into none, one, or two or more. For the regression analysis, this variable was dichotomized into at least one non-CV chronic condition or none (yes or no). High sensitivity C-reactive protein (hs-CRP) (measured in serum) was selected as a biomarker of systemic inflammation and classified into three categories: low (less than 1 mg/L, which is the desirable level), moderate (1 mg/L to 3 mg/L), or high (greater than 3 mg/L).Note 37 Respondents who had hs-CRP values below the limit of detection (n=139) were assigned to the low category. Respondents who had hs-CRP values above the analytical range (n=61) were treated as missing. For the regression analysis, inflammation was dichotomized into moderate to high (1 mg/L or greater) or not (yes or no).
Statistical analysis
All analyses were done using cycles 4, 5, and 6 combined. Proportions, means, and 95% confidence intervals (CIs) were estimated to examine the prevalence of components of impaired metabolic health, BMI categories, highest level of education, health behaviours (smoking status, meeting PA guidelines), and health status and morbidity indicators by sex. The proportion distribution of phenotypes was estimated across sexes, age groups, highest levels of education, and health behaviours. The prevalence of health status (general health, mental health) and morbidity indicators (CVD conditions, non-CV chronic conditions, inflammation) was estimated across the phenotypes. Separate multivariable logistic regression models were used to estimate the association between the phenotypes and the health status and morbidity indicators except CVD conditions—underlying sample sizes were too small for this indicator—while adjusting for sex, age group, education, smoking status, meeting PA guidelines, and CHMS cycle. In each model, listwise deletion exclusions were n=64 (general health), n=75 (mental health), n=64 (non-CV chronic conditions), and n=145 (inflammation), respectively. Adjusted health status and morbidity prevalence estimates, prevalence differences, prevalence ratios, and their 95% CIs across phenotypes were estimated from each model by calculating mean marginal effects, adjusted for covariates.
All estimates were weighted by using the combined survey weights for cycles 4, 5, and 6, and the sampling variance was calculated by using the combined bootstrap weights for these cycles. Statistical significance of t-tests, linear tests for trend, and model parameters were assessed at p < 0.05, with n multiple comparisons assessed at p < (0.05/n). All analyses were conducted in SAS 9.4 and SAS-callable SUDAAN 11.0.3.
Results
While 27% of adults aged 20 to 79 were classified as MU, 35% of adults were classified with overweight, and 31% with obesity (Table 1). Elevated WC was the most prevalent component of impaired metabolic health (47%), followed by elevated BP (31%), elevated fasting glucose (29%), reduced HDL-C (26%), and elevated triglycerides (25%). A higher proportion of males than females were classified with overweight, had elevated triglycerides, had elevated BP, had elevated fasting glucose, were a daily smoker, reported poor or fair general health, or reported one or more CVD conditions. Conversely, a higher proportion of females than males were classified with normal weight, had an elevated WC or reduced HDL-C, reported they had not met PA guidelines, had two or more non-CV chronic conditions, or had high levels of inflammation.
Table 1
Sample size and population characteristics, by sex, adults aged 20 to 79, Canada, excluding territories, 2014 to 2019
Table summary
This table displays the results of Sample size and population characteristics Total, Males, Females, Sample
size , % and 95%
confidence
interval (appearing as column headers).
Total
Males
Females
Sample
size
%
95%
confidence
interval
Sample
size
%
95%
confidence
interval
Sample
size
%
95%
confidence
interval
from
to
from
to
from
to
Age group
20 to 79
4,588
100.0
Note …: not applicable
Note …: not applicable
2,341
50.1
49.7
50.6
2,247
49.9
49.5
50.3
20 to 39
1,471
35.9
35.0
36.8
751
36.7
35.9
37.5
720
35.2Table 1 Note ‡
33.9
36.5
40 to 59
1,520
38.0
37.4
38.6
783
38.0
37.3
38.6
737
38.1
37.2
39.0
60 to 79
1,597
26.0
25.6
26.5
807
25.3
24.8
25.9
790
26.7Table 1 Note ‡
26.2
27.3
Metabolic health status
Metabolically healthy
3,321
73.3
70.4
76.0
1,669
72.6
69.3
75.7
1,652
74.0
70.0
77.6
Metabolically unhealthy
1,267
26.7
24.0
29.6
672
27.4
24.3
30.7
595
26.0
22.4
30.0
Body mass index categories
Normal weight
1,465
33.7
30.7
36.8
612
29.1
25.5
32.9
853
38.3Table 1 Note ‡
34.8
42.0
Overweight
1,621
35.0
32.0
38.1
949
38.8
34.8
43.1
672
31.1Table 1 Note ‡
27.8
34.6
Obesity
1,502
31.3
28.4
34.4
780
32.1
27.6
36.9
722
30.6
27.3
34.1
Components of impaired metabolic health
Elevated waist circumference
2,256
47.1
43.9
50.3
954
38.0
33.2
42.9
1,302
56.3Table 1 Note ‡
52.5
59.9
Elevated triglycerides
1,143
24.8
22.3
27.5
721
30.2
26.8
33.9
422
19.3Table 1 Note ‡
15.9
23.3
Reduced high-density lipoprotein cholesterol
1,246
25.6
22.8
28.6
546
22.5
20.0
25.1
700
28.8Table 1 Note ‡
24.5
33.5
Elevated blood pressure
1,484
30.5
28.0
33.1
826
33.7
30.4
37.1
658
27.3Table 1 Note ‡
24.2
30.6
Elevated fasting glucose
1,396
28.7
26.6
30.8
873
35.9
32.6
39.3
523
21.5Table 1 Note ‡
18.3
25.1
Highest level of education
Postsecondary graduate
No
1,221
29.9
27.1
32.9
625
31.8
28.6
35.1
596
28.1
24.3
32.2
Yes
3,334
70.1
67.1
72.9
1,694
68.2
64.9
71.4
1,640
71.9
67.8
75.7
Health behaviours
Daily smoker
Yes
544
14.5
12.6
16.7
319
19.5
16.5
22.8
225
9.5Table 1 Note ‡
7.5
12.1
No
4,028
85.5
83.3
87.4
2,017
80.5
77.2
83.5
2,011
90.5Table 1 Note ‡
87.9
92.5
Met physical activity guidelines
No
2,001
43.6
39.3
48.0
933
40.2
35.5
45.1
1,068
46.9Table 1 Note ‡
41.3
52.7
Yes
2,571
56.4
52.0
60.7
1,401
59.8
54.9
64.5
1,170
53.1Table 1 Note ‡
47.3
58.7
Health status
General health
Poor or fair
530
10.6
9.2
12.2
266
12.0
10.0
14.3
264
9.3Table 1 Note ‡
7.6
11.2
Good, very good, or excellent
4,058
89.4
87.8
90.8
2,075
88.0
85.7
90.0
1,983
90.7
88.8
92.4
Mental health
Poor or fair
364
8.0
6.9
9.3
157
7.0
5.6
8.8
207
9.0
7.0
11.4
Good, very good, or excellent
4,212
92.0
90.7
93.1
2,177
93.0
91.2
94.4
2,035
91.0
88.6
93.0
Morbidity indicators
Cardiovascular disease conditions
None
4,269
94.5
93.7
95.3
2,140
92.9
91.1
94.3
2,129
96.2Table 1 Note ‡
94.7
97.3
One or more
319
5.5
4.7
6.3
201
7.1
5.7
8.9
118
3.8Table 1 Note ‡
2.7
5.3
Non-cardiovascular chronic conditions
None
2,849
65.6
62.7
68.3
1,577
68.0
63.8
71.9
1,272
63.1Table 1 Note ‡
60.2
65.9
One
1,154
23.7
20.9
26.8
553
24.0
20.5
28.0
601
23.4
20.3
26.7
Two or more
585
10.8
9.2
12.5
211
8.0
5.9
10.7
374
13.5Table 1 Note ‡
11.7
15.6
Inflammation
Low
1,746
40.1
36.9
43.4
964
41.9
37.9
46.0
782
38.3
33.7
43.2
Moderate
1,683
37.1
34.5
39.8
881
39.3
35.3
43.5
802
34.9
31.3
38.7
High
1,078
22.7
20.6
25.0
462
18.8
15.7
22.4
616
26.8Table 1 Note ‡
24.2
29.5
Metabolic health by body mass index category
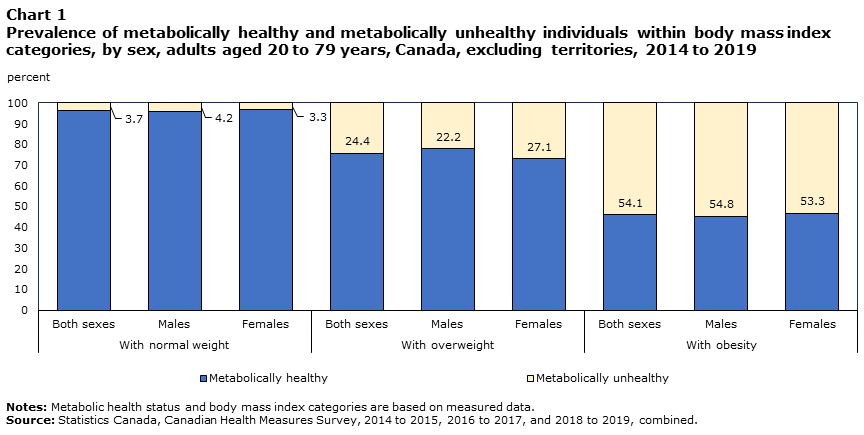
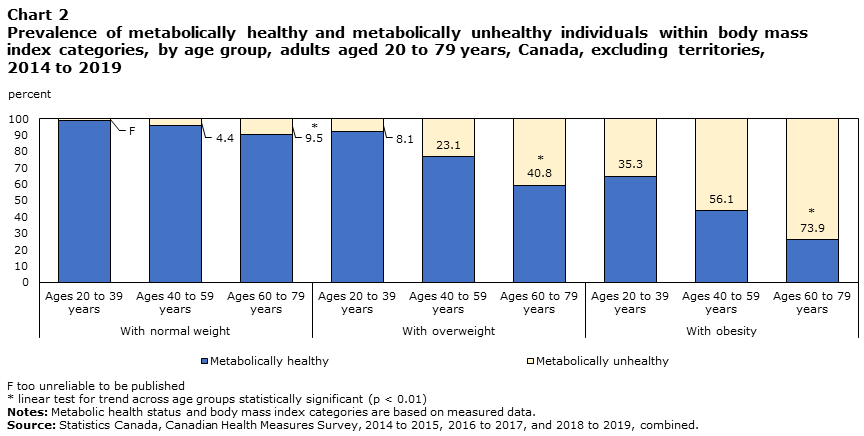
Just under 4% of adults with normal weight were MU, 24% of adults with overweight were MU, and 54% of adults with obesity were MU, with minimal differences between males and females (Chart 1). The prevalence of being MU in all BMI categories was higher in older age groups (Chart 2). For example, among adults with obesity, 35% of those aged 20 to 39 years were MU versus 74% of those aged 60 to 79 years (linear test for trend p<0.01).
Description of Chart 1
Data table for chart 1
Table summary
This table displays the results of Data table for chart 1 With normal weight, With overweight, With obesity, Both sexes, Males and Females, calculated using percent units of measure (appearing as column headers).
With normal weight
With overweight
With obesity
Both sexes
Males
Females
Both sexes
Males
Females
Both sexes
Males
Females
percent
Metabolically unhealthy
3.7
4.2
3.3
24.4
22.2
27.1
54.1
54.8
53.3
Metabolically healthy
96.3
95.8
96.7
75.6
77.8
72.9
45.9
45.2
46.7
Description of Chart 2
Data table for chart 2
Table summary
This table displays the results of Data table for chart 2 With normal weight, With overweight, With obesity, Ages
20 to 39
years, Ages
40 to 59
years and Ages
60 to 79
years, calculated using percent units of measure (appearing as column headers).
With normal weight
With overweight
With obesity
Ages
20 to 39
years
Ages
40 to 59
years
Ages
60 to 79
years
Ages
20 to 39
years
Ages
40 to 59
years
Ages
60 to 79
years
Ages
20 to 39
years
Ages
40 to 59
years
Ages
60 to 79
years
percent
Metabolically unhealthy
Note F: too unreliable to be published
4.4
9.5Note *
8.1
23.1
40.8Note *
35.3
56.1
73.9Note *
Metabolically healthy
99.0
95.6
90.5
91.9
76.9
59.2
64.7
43.9
26.1
Prevalence of phenotypes
About 73% of adults were categorized as MH, distributed across BMI groups as MH with normal weight (33%), with overweight (26%), and with obesity (14%) (Table 2). The 27% of adults categorized as MU were distributed across BMI groups as MU with normal weight (1%), with overweight (9%), and with obesity (17%). The prevalence of being MH with normal weight was higher among females (37%) than males (28%), and the prevalence of being MH with overweight was lower (23% among females versus 30% among males). Among older age groups, the prevalence of being MH with normal weight and being MH with obesity was lower, whereas the prevalence of all MU phenotypes was higher (linear test for trend p<0.01). Among postsecondary graduates, the prevalence of being MU with obesity was lower compared with those who were not postsecondary graduates. The prevalence of being MU with obesity was also lower among those who reported meeting PA guidelines versus those who reported not meeting them.
Table 2
Proportion distribution of phenotypes, by sex, age group, highest level of education, smoking status, and physical activity, adults aged 20 to 79, Canada, excluding territories, 2014 to 2019
Table summary
This table displays the results of Proportion distribution of phenotypes Metabolically healthy, Metabolically unhealthy, with normal weight, with overweight, with obesity, % and 95%
confidence
interval (appearing as column headers).
Metabolically healthy
Metabolically unhealthy
with normal weight
with overweight
with obesity
with normal weight
with overweight
with obesity
%
95%
confidence
interval
%
95%
confidence
interval
%
95%
confidence
interval
%
95%
confidence
interval
%
95%
confidence
interval
%
95%
confidence
interval
from
to
from
to
from
to
from
to
from
to
from
to
Overall
32.5
29.5
35.6
26.4
23.4
29.7
14.1
12.4
16.6
1.2
0.9
1.7
8.5
7.1
10.2
16.9
14.9
19.2
Sex
Male (ref.)
27.9
24.3
31.7
30.2
26.1
34.7
14.5
11.4
18.2
1.2
0.7
2.0
8.6
7.2
10.3
17.6
14.8
20.7
Female
37.1Note *
33.4
40.9
22.6Note *
19.1
26.6
14.3
11.8
17.1
1.3
0.8
2.1
8.4
6.2
11.4
16.3
13.8
19.1
Age group
20 to 39
44.3
39.0
49.8
24.3
19.5
29.9
18.7
14.3
23.6
Note F: too unreliable to be published
Note …: not applicable
Note …: not applicable
Note F: too unreliable to be published
Note …: not applicable
Note …: not applicable
10.2
7.6
13.5
40 to 59
27.4
23.3
31.9
30.0
24.5
36.1
14.2
11.1
17.9
1.3
0.7
2.2
9.0
6.8
11.8
18.1
14.2
22.9
60 to 79
23.5Table 2 Note §§
20.2
27.2
24.2
21.0
27.7
8.7Table 2 Note §§
6.7
11.2
2.5Table 2 Note §§
1.5
3.9
16.7Table 2 Note §§
13.8
19.9
24.5Table 2 Note §§
20.8
28.7
Postsecondary graduate
No (ref.)
30.2
25.8
34.9
25.9
21.1
31.3
12.5
9.2
16.9
0.8
0.4
1.4
10.2
7.7
13.3
20.4
16.8
24.7
Yes
33.3
30.0
36.8
26.9
23.6
30.5
15.2
12.6
18.2
1.2
0.9
1.8
7.9
6.3
9.9
15.4Note *
12.9
18.3
Smoker
Yes (ref.)
33.0
26.6
40.0
22.6
16.3
30.4
15.0
8.1
26.1
1.7
0.7
3.8
11.4
7.3
17.4
16.4
12.3
21.5
No
32.4
28.9
36.0
27.2
24.2
30.3
14.3
12.7
16.1
1.2
0.8
1.7
8.1
6.6
9.8
16.9
14.7
19.4
Met physical activity guidelines
No (ref.)
29.8
25.1
35.0
24.2
19.9
29.2
14.0
11.6
16.8
1.3
0.8
2.1
9.0
6.7
12.0
21.6
18.5
25.1
Yes
34.7
31.7
37.8
28.4
24.4
32.7
14.3
11.6
17.4
1.2
0.7
1.8
8.0
6.4
10.1
13.5Note *
10.8
16.8
Health status across phenotypes
Poor or fair general health prevalence was greater with higher BMI among MH adults (Table 3). It was higher among MU adults with overweight (17% [95% CI: 12%, 23%]) compared with MH adults with overweight (8% [95% CI: 6%, 12%]), and also higher among MU adults with obesity (22% [95% CI: 18%, 28%]) compared with MH adults with obesity (11% [95% CI: 7%, 17%]).
Table 3
Prevalence of health status and morbidity indicators, by phenotype, adults aged 20 to 79, Canada, excluding territories, 2014 to 2019
Table summary
This table displays the results of Prevalence of health status and morbidity indicators Metabolically healthy, Metabolically unhealthy, with normal weight, with overweight, with obesity, % and 95%
confidence
interval (appearing as column headers).
Metabolically healthy
Metabolically unhealthy
with normal weight
with overweight
with obesity
with normal weight
with overweight
with obesity
%
95%
confidence
interval
%
95%
confidence
interval
%
95%
confidence
interval
%
95%
confidence
interval
%
95%
confidence
interval
%
95%
confidence
interval
from
to
from
to
from
to
from
to
from
to
from
to
Health status
General health
Poor or fair
4.8
3.4
6.6
8.1
5.5
11.8
10.8
6.8
16.5Table 3 Note §
17.5
6.1
41.1
16.6Table 3 Note ‡
11.9
22.6
22.2Table 3 Note ‡
17.5
27.8
Good, very good, or excellent
95.2
93.4
96.6
91.9
88.2
94.5
89.2
83.5
93.2Table 3 Note §
82.5
58.9
93.9
83.4Table 3 Note ‡
77.4
88.1
77.8Table 3 Note ‡
72.2
82.5
Mental health
Poor or fair
8.5
6.3
11.2
6.0
3.9
9.3
8.1
5.2
12.5
9.7
2.8
28.4
7.2
3.5
14.3
10.4
7.3
14.7
Good, very good, or excellent
91.5
88.8
93.7
94.0
90.7
96.1
91.9
87.5
94.8
90.3
71.6
97.2
92.8
85.7
96.5
89.6
85.3
92.7
Morbidity
Cardiovascular disease conditions
None
97.3
96.1
98.2
95.6
93.7
97.0
96.4
92.5
98.4
Note F: too unreliable to be published
Note …: not applicable
Note …: not applicable
84.8Table 3 Note ‡
79.7
88.9
91.3Table 3 Note ‡
89.1
93.1
One or more
2.7
1.8
3.9
4.4
3.0
6.3
3.6
1.6
7.5
Note F: too unreliable to be published
Note …: not applicable
Note …: not applicable
15.2Table 3 Note ‡
11.1
20.3
8.7Table 3 Note ‡
6.9
10.9
Non-cardiovascular chronic conditions
None
70.8
66.1
75.1
66.4
59.7
72.4
73.7
64.7
81.1
60.6
45.9
73.6
55.4Table 3 Note ‡
47.2
63.4
52.8Table 3 Note ‡
46.1
59.3
One
20.2
15.3
26.1
23.9
18.0
31.0
17.3
12.0
24.3
22.9
11.9
39.5
30.6Table 3 Note ‡
24.9
37.0
32.1Table 3 Note ‡
27.5
37.1
Two or more
9.0
6.9
11.6
9.7
7.5
12.5
9.0
5.7
14.0
16.5
8.1
30.5
13.9
9.6
19.7
15.1Table 3 Note ‡
11.7
19.3
Inflammation
Low
62.1
57.2
66.7
42.5
37.5
47.8
27.7
21.2
35.3Table 3 Note §§
33.3Table 3 Note ‡
16.5
55.6
26.2Table 3 Note ‡
17.6
37.2
11.5Table 3 Note ‡
8.3
15.8Table 3 Note §
Moderate
28.5
24.5
32.8
40.6
35.6
45.9
33.4
23.7
44.6
54.8Table 3 Note ‡
33.5
74.5
55.6Table 3 Note ‡
45.3
65.5
40.9
34.1
48.1
High
9.5
7.2
12.4
16.8
13.1
21.4
38.9
30.1
48.5Table 3 Note §§
11.9
4.3
29.3
18.2
12.8
25.2
47.6
41.0
54.2Table 3 Note §§
Morbidity across phenotypes
The prevalence of one or more CVD conditions was higher among MU adults with overweight (15% [95% CI: 11%, 20%]) than among MH adults with overweight (4% [95% CI: 3%, 6%]) and higher among MU adults with obesity (9% [95% CI: 7%, 11%]) compared with MH adults with obesity (4% [95% CI: 2%, 8%]) (Table 3). There was also a higher prevalence of at least one non-CV condition among MU adults with obesity than among MH adults with obesity. The prevalence of low inflammation was lower for each MU phenotype compared with its MH counterpart. High inflammation was more prevalent among both MH and MU adults with higher BMI (linear test for trend p<0.01).
Model-adjusted prevalence of negative health indicators across phenotypes
After adjusting for sex, age group, education, smoking status, meeting PA guidelines, and CHMS cycle, model-adjusted prevalence of poor or fair general health was greater at higher BMI categories for MH adults (Table 4). The model-adjusted prevalence of moderate-to-high inflammation was greater at higher BMI categories for both MH and MU adults, reaching 74% (95% CI: 66%, 80%) for MH adults with obesity and 88% (95% CI: 83%, 92%) for MU adults with obesity. There was minimal difference across the phenotypes in model-adjusted poor or fair mental health. Excluding smoking status and meeting PA guidelines from the models— given their potential causal association with both the phenotypes and the health status and morbidity indicators—did not affect the results (data not shown).
Table 4
Model-adjusted prevalence of health status and morbidity indicators across phenotypes, adults 20 to 79 years, Canada, excluding territories, 2014 to 2019
Table summary
This table displays the results of Model-adjusted prevalence of health status and morbidity indicators across phenotypes Adjusted prevalence, %, 95%
confidence
interval , Difference
(%) and Ratio (appearing as column headers).
Adjusted prevalence
%
95%
confidence
interval
Difference
(%)
95%
confidence
interval
Ratio
95%
confidence
interval
from
to
from
to
from
to
Poor or fair general health
MH with normal weight (ref.)
5.0
3.7
6.8
Note …: not applicable
Note …: not applicable
Note …: not applicable
1.0
Note …: not applicable
Note …: not applicable
MH with overweight
8.2
5.7
11.5
3.1Note *
0.6
5.7
1.6
1.1
2.4
MH with obesity
11.4Table 4 Note §§
7.3
17.4
6.4Note *
1.4
11.4
2.3
1.4
3.8
MU with normal weight
11.6
3.5
32.4
6.6
-4.9
18.1
2.3
0.9
6.3
MU with overweight
14.3
9.4
21.2
9.3Table 4 Note ‡
3.4
15.3
2.9
1.7
4.9
MU with obesity
20.5
15.4
26.8
15.5Table 4 Note ‡
9.7
21.2
4.1
2.7
6.3
Poor or fair mental health
MH with normal weight (ref.)
8.2
6.1
10.9
Note …: not applicable
Note …: not applicable
Note …: not applicable
1.0
Note …: not applicable
Note …: not applicable
MH with overweight
6.0
4.0
9.1
-2.1
-5.9
1.7
0.7
0.4
1.5
MH with obesity
7.8
4.7
12.7
-0.4
-4.6
3.8
1.0
0.5
1.8
MU with normal weight
11.7
2.3
43.4
3.6
-10.5
17.7
1.4
0.4
5.6
MU with overweight
7.5
3.5
15.5
-0.6
-6.3
5.0
0.9
0.4
2.2
MU with obesity
10.1
6.9
14.6
1.9
-2.6
6.4
1.2
0.7
2.2
At least one non-cardiovascular chronic condition
MH with normal weight (ref.)
33.1
28.2
38.3
Note …: not applicable
Note …: not applicable
Note …: not applicable
1.0
Note …: not applicable
Note …: not applicable
MH with overweight
34.3
28.9
40.1
1.2
-6.4
8.8
1.0
0.8
1.3
MH with obesity
31.4
23.1
41.1
-1.7
-11.1
7.8
1.0
0.7
1.3
MU with normal weight
31.2
21.3
43.3
-1.8
-13.7
10.1
0.9
0.6
1.4
MU with overweight
31.4
25.6
37.9
-1.6
-9.2
5.9
1.0
0.7
1.2
MU with obesity
41.2
35.0
47.5
8.1
-0.1
16.3
1.2
1.0
1.6
Moderate-to-high inflammation
MH with normal weight (ref.)
37.7
32.9
42.9
Note …: not applicable
Note …: not applicable
Note …: not applicable
1.0
Note …: not applicable
Note …: not applicable
MH with overweight
58.6
53.4
63.7
20.9Table 4 Note ‡
14.7
27.1
1.6
1.4
1.8
MH with obesity
73.7Table 4 Note §§
65.5
80.4
35.9Table 4 Note ‡
27.9
43.9
2.0
1.7
2.3
MU with normal weight
61.5
33.2
83.7
23.8
-0.3
47.8
1.6
1.1
2.5
MU with overweight
71.8
59.4
81.6
34.0Table 4 Note ‡
21.6
46.5
1.9
1.5
2.4
MU with obesity
87.8Table 4 Note §§
82.9
91.5
50.1Table 4 Note ‡
44.8
55.3
2.3
2.1
2.6
Compared with MH adults with normal weight, MU adults with overweight were 2.9 times (95% CI: 1.7, 4.9) more likely and MU adults with obesity were 4.1 times (95% CI: 2.7, 6.3) more likely to report poor or fair general health (Table 4). Except for MU adults with normal weight, adults in all other phenotypes were 1.6 times (95% CI: 1.4, 1.8) to 2.3 times (95% CI: 2.1, 2.6) more likely to have moderate-to-high inflammation than MH adults with normal weight.
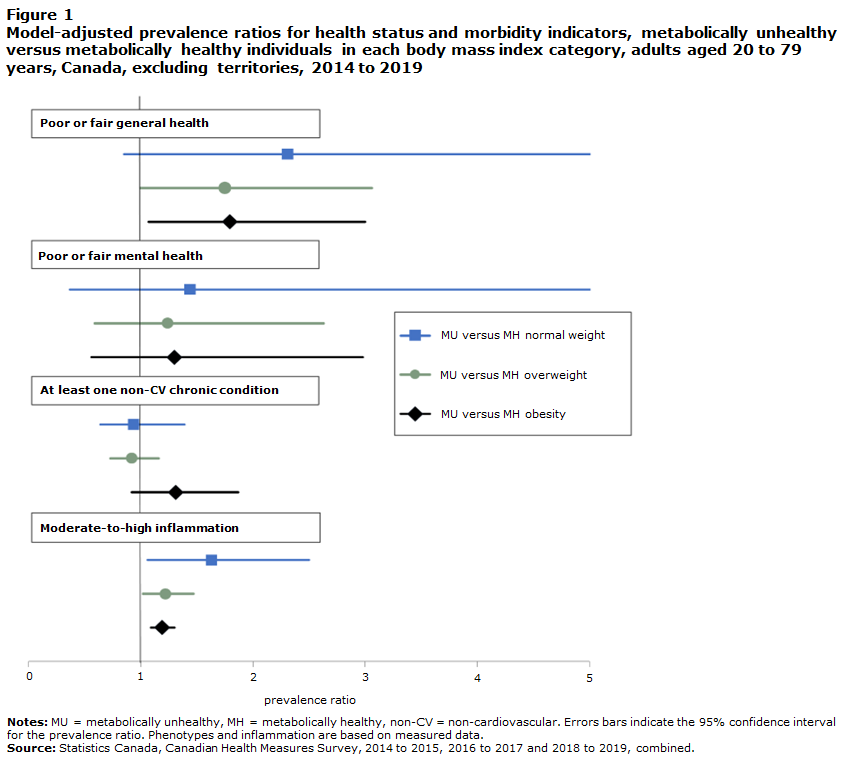
When the model-adjusted prevalence of negative health outcomes for MU versus MH adults was examined within BMI categories, MU adults with obesity were 1.8 times more likely (95% CI: 1.1, 3.0) to report poor or fair general health compared with MH adults with obesity (Figure 1). MU adults with normal weight were 1.6 times (95% 1.1, 2.5) more likely, MU adults with overweight were 1.2 times (95% CI: 1.0, 1.5) more likely, and MU adults with obesity were 1.2 times (95% CI: 1.1, 1.3) more likely than each of their MH counterparts to have moderate-to-high inflammation.
Description of Figure 1
Data table for Figure 1
Model-adjusted prevalence ratios for health status and morbidity indicators, metabolically unhealthy versus metabolically healthy individuals in each body mass index category, adults aged 20 to 79 years, Canada, excluding territories, 2014 to 2019
Table summary
This table displays the results of Model-adjusted prevalence ratios for health status and morbidity indicators Prevalence
ratio and 95% confidence interval (appearing as column headers).
Prevalence
ratio
95% confidence interval
from
to
Poor or fair general health
MU versus MH normal weight
2.3
0.9
6.3
MU versus MH overweight
1.8
1.0
3.1
MU versus MH obesity
1.8
1.1
3.0
Poor or fair mental health
MU versus MH normal weight
1.4
0.4
5.6
MU versus MH overweight
1.2
0.6
2.6
MU versus MH obesity
1.3
0.6
3.0
At least one non-cardiovascular chronic condition
MU versus MH normal weight
0.9
0.6
1.4
MU versus MH overweight
0.9
0.7
1.2
MU versus MH obesity
1.3
0.9
1.9
At vascular risk
MU versus MH normal weight
1.6
1.1
2.5
MU versus MH overweight
1.2
1.0
1.5
MU versus MH obesity
1.2
1.1
1.3
Discussion
This study examined the association between metabolic health status and BMI categories, estimated the population prevalence of the joint phenotypes, and examined the prevalence of selected negative health indicators according to these phenotypes among adults in Canada. Having defined MU as the presence of at least three out of five of elevated WC, elevated triglycerides, reduced HDL-C, elevated BP, and elevated fasting glucose, this study found that MU was associated with higher BMI and with older age, and that about one in four adults were categorized as MU. The prevalence of the phenotypes differed significantly by age, and the prevalence of poor or fair general health and systemic inflammation varied by phenotype.
Results showed that the prevalence of being MU was higher among adults in higher BMI categories, with just over half of all adults classified with obesity also defined as MU. The proportion of MU adults was higher with age, for all BMI categories, resulting in almost three out of four adults aged 60 to 79 with obesity being MU. These findings are consistent with those of others who have reported a positive association between the components of impaired metabolic health and obesityNote 12, Note 38, Note 39 and found that these components, regardless of obesity, become more prevalent with age.Note 40
The adults categorized as MU were distributed across BMI groups as MU with normal weight (1%), with overweight (9%), and with obesity (17%). A study using National Health and Nutrition Examination Survey (NHANES) data from 2017/2018 with the same adult phenotype criteria reported similar proportions of MU adults with normal weight (2%) and with overweight (11%) but a higher proportion of MU adults with obesity (26%).Note 12 This latter result likely reflects the higher overall obesity prevalence reported in that study (41%) compared with the present study (31%); this is consistent with adult obesity rates being historically higher in the United States than in Canada.Note 41 The proportions of MH adults with normal weight and with overweight in the present study were higher than in the NHANES study— 33% of MH adults with normal weight in this study versus 25% in the NHANES study and 26% of MH adults with overweight in this study versus 20% in the NHANES study. However, the proportion of MH adults with obesity was the same (14%), and both studies showed a similar trend, with higher prevalence of MU phenotypes at older age groups.
Compared with MH adults with normal weight—the suggested reference phenotypeNote 15—this study found that MU adults with overweight and with obesity were more likely to report poor or fair general health—three times more likely for those with overweight and four times more likely for those with obesity. Poor self-rated health increases the risk of mortality. In longitudinal studies, it predicted not only all-cause mortality but mortality from ischaemic heart diseases and cerebrovascular diseases.Note 42
Systemic inflammation is a key mechanism driving atherosclerotic CVD.Note 43 By categorizing hs-CRP—a blood biomarker of systemic inflammationNote 43—into categories of inflammation, the current study found that adults with higher BMI were more likely to have moderate-to-high inflammation regardless of metabolic health status. Moreover, MU adults with overweight or obesity had an even higher likelihood of moderate-to-high inflammation compared with their MH counterparts. These results align with previous observations that higher BMI and metabolic ill health are associated with higher inflammatory activity.Note 43, Note 44 While it is not surprising that the combination of obesity and MU had the highest model-adjusted prevalence of moderate-to-high inflammation—9 out of 10 MU adults with obesity—almost 4 in 10 MH adults with normal weight did as well. Given that elevated levels of inflammatory markers are associated with increased risk of CVD,Note 44, Note 45 these results suggest that regardless of BMI, metabolic health and biomarkers of inflammation should also be examined when assessing health status.
This study has several strengths. The results are based on a representative sample of adults, which produced robust population estimates of the phenotypes. Height, weight, and the components of metabolic health were measured objectively using systematic methodologies. Because the CHMS data are cross-sectional, duration in a particular phenotype was unknown. Studies suggest phenotype membership is not static and that, in particular, MH people at higher BMIs are at increased risk of becoming MU over time.Note 4, Note 39 However, others have suggested that current BMI—as used in this study—better reflects CV and metabolic risk than time spent in a BMI category.Note 46
Certain limitations of this study should be considered. Systemic inflammation is on the causal pathway of developing metabolic abnormalitiesNote 44 and is associated with excess visceral fat.Note 43 Thus, the observed association between the phenotypes and moderate-to-high inflammation in the current study is likely bidirectional. Fat mass distribution—which is associated with metabolic healthNote 4—was not measured in the CHMS. Additional behaviours on the pathway between obesity, metabolic health, and health status and morbidity, such as diet quality or alcohol consumption, were not examined in this study. Small sample sizes prevented comparisons of sex and age group associations between the phenotypes and the health indicators, examination of model-adjusted prevalence of CVD, or analysis of specific population groups. Finally, the findings of this study should be considered in the context of the chosen definition of metabolic health.
Conclusion
By examining the interplay between BMI and metabolic health, this study produced the first population-level estimates of these joint phenotypes among adults in Canada. MU adults with obesity had the highest prevalence of systemic inflammation and were more likely to report poor or fair general health than MH adults with normal weight. Adults in all BMI categories who were MU had a higher prevalence of systemic inflammation than their MH counterparts. With poor self-reported health and inflammation shown to increase the likelihood of CVD morbidity and mortality, the results of this study provide a better understanding of phenotype prevalence and the related health risks. In turn, this can enhance awareness and inform health promotion strategies. National longitudinal data, which include metabolic health and BMI linked to health service use and death data, would help provide further insight into the association between obesity, metabolic health status, morbidity, and mortality risk in Canada.