The 2024-25 Oklahoma City Thunder experienced consistent success by controlling the two most impactful statistical factors. Oklahoma City outshot opponents on field goal attempts, combining an extremely stingy defensive unit with scoring champion Shai Gilgeous-Alexander. It also recorded the highest regular-season and playoff turnover differentials in NBA history.
The Thunder earned more total possessions through ball security and defensive playmaking, while maximizing those possessions through efficient scoring and consistent shot defense. As it turns out, 68 wins (54 double-digit) and the eventual title did not come about by accident.
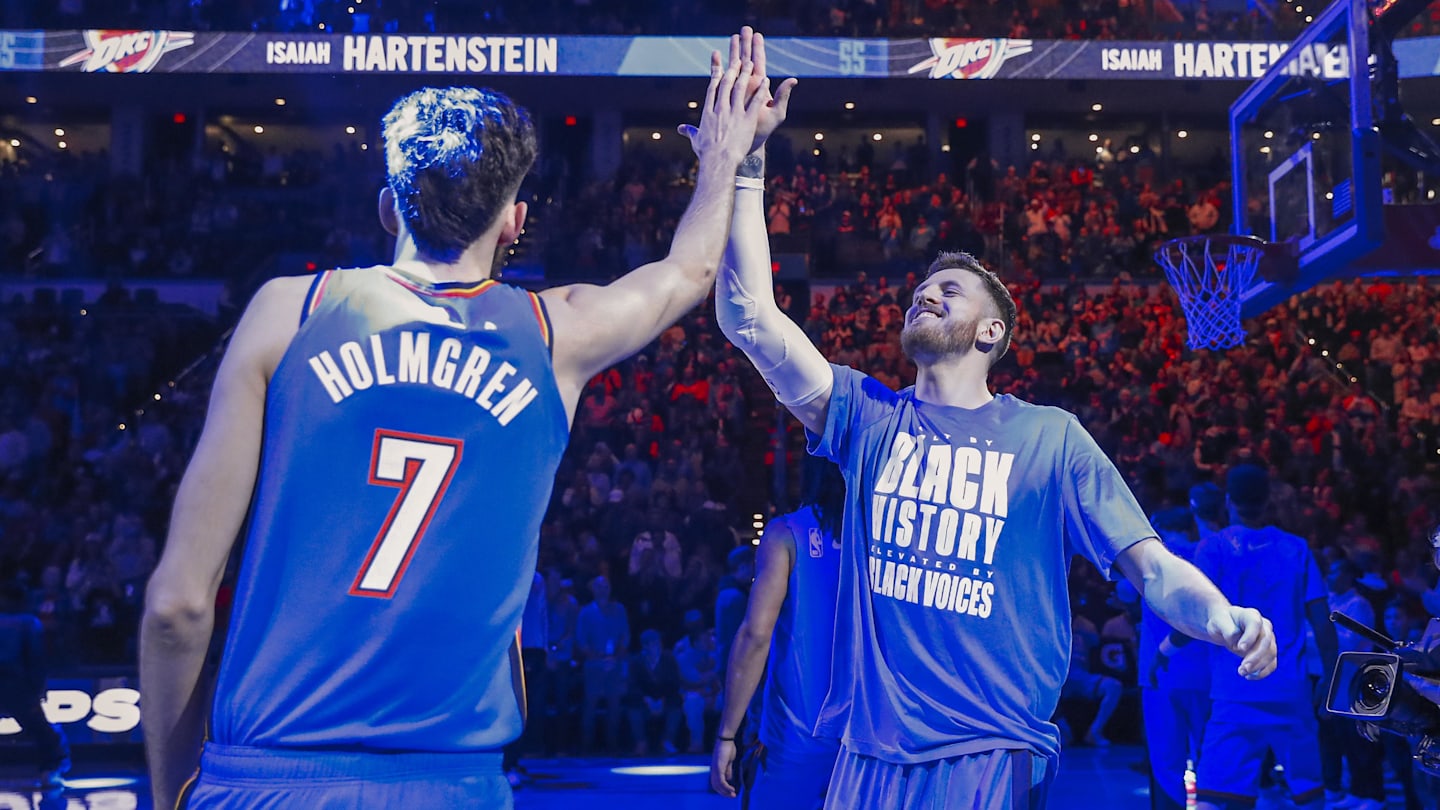
However, Oklahoma City’s biggest weakness remained even after adding dependable big man Isaiah Hartenstein. The Thunder trimmed its 2023-24 differential significantly but gave up more offensive rebounds than it grabbed for the sixth straight season.
Offensive rebounds are important because they offset missed shots, giving teams multiple scoring opportunities on the same possession. Their impact has decreased slightly since the NBAchanged the second-chance shot clock from 24 seconds to 14 seconds seven years ago, but that time is still more than enough to generate a quality look.
Offensive rebound percentage measures how many available rebounds are controlled by the offensive team or player. The formula: offensive rebounds / (offensive rebounds + opponent defensive rebounds).
The 57-win, 2023-24 Thunder posted an abysmal -5.2% offensive rebound differential during the regular season, with the third-worst offensive rebound percentage and fourth-worst opponent offensive rebound percentage. It improved in both categories last season.
Comparing team offensive rebound percentage and opponent offensive rebound percentage during the 2024-25 NBA regular season. / NBA.com
Oklahoma City’s 28.1% offensive rebound percentage (No. 20 in NBA) and 29.6% opponent offensive rebound percentage (No. 19 in NBA) were good for the league’s No. 20 differential.
The Houston Rockets, which did not produce particularly good effective field goal percentage or turnover percentage differentials, finished with the Western Conference’s No. 2 seed by demolishing the offensive glass. They registered a 36.3% offensive rebound percentage, the highest since the 2003-04 Utah Jazz (37.3%).
Six Houston players — Steven Adams (10.2), Jock Landale (5.5), Alperen Sengun (5.3), Tari Eason (4.4), Amen Thompson (4.2) and Jae’Sean Tate (4.1) — averaged at least four offensive boards per 100 possessions.
The Rockets (+7.8%), Memphis Grizzlies (+3.2%), Golden State Warriors (+3.0%) and Orlando Magic (+2.2%) posted the best four regular-season differentials, and all four made the playoffs.
The Indiana Pacers (-4.1%) and Milwaukee Bucks (-4.0%) were playoff teams despite bottom-five differentials.
The Thunder tallied more offensive rebounds and grabbed fewer defensive rebounds during its 23-game championship run than in the 82-game warm-up.
Comparing team offensive rebound percentage and opponent offensive rebound percentage during the 2025 NBA playoffs. / NBA.com
Oklahoma City’s 29.2% offensive rebound percentage (No. 11 in NBA) and 32.4% opponent offensive rebound percentage (No. 12 in NBA) resulted in a 1.7% worse differential than its regular season, although neither impacted its success harshly. The Indiana Pacers (-5.1% differential) also made the NBA Finals.
The Rockets (+6.6% differential) remained prolific but came up short to the Cleveland Cavaliers (+9.4% differential), which secured more than three of every four defensive rebounds. Houston played just seven playoff games due to poor performance in the more important factors.
The Los Angeles Lakers (-9.0% differential), LA Clippers (-5.4% differential) and Miami Heat (-4.9% differential) lost in the first round.
Last regular season, 25.2% of all rebounds were offensive rebounds. Oklahoma City grabbed 871 offensive boards out of 3,672 total (23.7%).
Eight of 14 returning Thunder players logged at least two offensive rebounds per 100 possessions, and 10 returners notched at least five defensive rebounds per 100 possessions.
Comparing current Oklahoma City Thunder players’ defensive rebound and offensive rebound percentages during the 2024-25 NBA regular season. Dot size correlates positively with total rebounds. / Basketball Reference
Hartenstein averaged 2.9 offensive rebounds (No. 1 on Thunder) and 7.9 defensive rebounds (No. 1 on Thunder) in his debut season. He missed 25 games but totaled 232 more boards than No. 2 Shai Gilgeous-Alexander.
Chet Holmgren (25.0% defensive rebound percentage) and Jaylin Williams (28.7% defensive rebound percentage) helped stabilize the Thunder across their limited minutes. Kenrich Williams (6.7% offensive rebound percentage) provided an additional presence on the other end.
Oklahoma City’s guards and wings were much, much more impactful in other areas.
During the 2025 playoffs, 26.0% of all rebounds were offensive rebounds. Oklahoma City registered 263 offensive boards out of 1,002 total (26.2%), as its overall defensive rebounding declined.
Of the Thunder’s 11 returners who played at least 100 playoff minutes, six recorded at least two offensive rebounds per 100 possessions and eight secured at least five defensive rebounds per 100 possessions.
Comparing current Oklahoma City Thunder players’ defensive rebound and offensive rebound percentages (min. 100 minutes) during the 2025 NBA playoffs. Dot size correlates positively with total rebounds. / Basketball Reference
Hartenstein (13.2% offensive rebound percentage) was still Oklahoma City’s best second-chance threat but averaged 5.5 fewer minutes than his regular season, leaving Holmgren (defensive rebound percentage) to take over the clean-up responsibilities.
Otherwise, the Thunder’s rebounding hierarchy did not change.
Oklahoma City can establish itself on the glass by sacrificing more important factors. In 497 total non-low-leverage minutes last season, the Hartenstein-Holmgren lineups produced a +7.0% offensive rebound percentage differential — thanks to allowing just 22.4% of possible defensive rebounds to fall into opposition hands.
Want to join the discussion? Like Thunder on SI on Facebook and follow us on Twitter to stay up to date on all the latest Thunder news. You can also meet the team behind the coverage.

