
![]()
SAVE TO MY FOLDER
Housing starts for September 2025
![]()
Done!
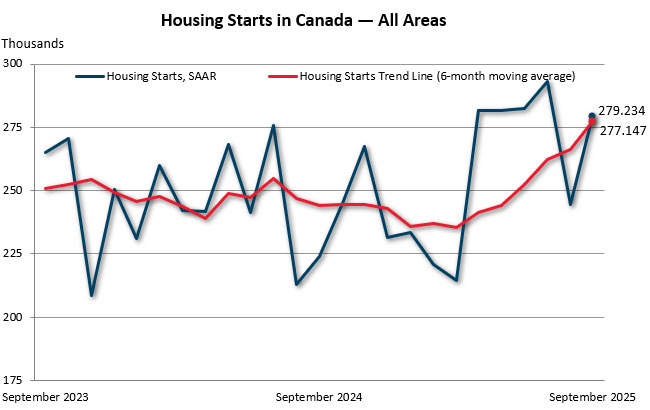
The six-month trend in housing starts increased (4.1%) in September (277,147 units), according to Canada Mortgage and Housing Corporation (CMHC). The trend measure is a six-month moving average of the seasonally adjusted annual rate (SAAR) of total housing starts for all areas in Canada.
Actual housing starts were up 19% year-over-year in centres with a population of 10,000 or greater, with 22,375 units recorded in September, compared to 18,806 units in September 2024. The year-to-date total was 178,033, up 5% from the same period in 2024.
The total monthly SAAR of housing starts for all areas in Canada was up 14% in September (279,234 units) compared to August (244,543 units).
“The six-month trend in housing starts was pushed higher in September, driven by significantly higher monthly starts in Ontario, Québec, and the Prairie provinces. Notably, Montréal and Toronto were responsible for more than a quarter of the total monthly starts nationally, primarily due to increased rental apartments starts. While these results indicate some resilience, it is worth noting that current housing starts levels are generally reflective of decisions made months or even years ago when investor confidence was higher than it is today,” said Tania Bourassa-Ochoa, CMHC’s Deputy Chief Economist.
Key facts:
The rural starts monthly SAAR estimate was 24,889 units.
Among Canada’s big three cities, Montreal and Toronto posted 135% and 112% year-over-year increases in actual housing starts respectively, both driven by significantly higher multi-unit starts. Vancouver recorded a 1% decrease in starts this month.
CMHC’s Starts and Completions Survey provides Canadians with objective, accurate and timely information on actual new residential construction in Canada. Read more about why housing starts matter on CMHC’s Housing Observer.
Monthly Housing Starts and Other Construction Data are accessible in English and French on our website and the CMHC Housing Market Information Portal.
Housing starts data is available on the eleventh business day each month. We will release the October housing starts data on November 18 at 8:15 AM ET.
CMHC uses the trend measure as a complement to the monthly SAAR of housing starts to account for considerable swings in monthly estimates and to obtain a clearer picture of upcoming new housing supply. In some situations, analyzing only SAAR data can be misleading, as the multi-unit segment largely drives the market and can vary significantly from one month to the next.
Read about our definitions and methodology to better understand the foundations of the Starts and Completions and Market Absorption surveys.
Housing starts facilitate the analysis of monthly, quarterly, and year-over-year activity in the new home market. The data CMHC collects as part of the Starts and Completions and Market Absorption surveys helps us obtain a clearer picture of upcoming new housing supply and is used as part of our various housing reports.
CMHC plays a critical role as a national convenor to promote stability and sustainability in Canada’s housing finance system. CMHC’s mortgage insurance products support access to home ownership and the creation and maintenance of rental supply. CMHC research and data help inform housing policy. By facilitating co-operation between all levels of government, private and non-profit sectors, CMHC contributes to advancing housing affordability, equity, and climate compatibility. CMHC actively supports the Government of Canada in delivering on its commitment to make housing more affordable.
Follow us on X, YouTube, LinkedIn, Facebook and Instagram.
Related links:
Information on this release:
To request an interview with a CMHC economist, contact:
Media Relations, CMHC
media@cmhc-schl.gc.ca
Housing Start Data in Centres 10,000 Population and Over (Province)
January – September 2024 – 2025
N.-L.
458
510
11
232
280
21
690
790
14
P.E.I.
189
242
28
896
840
-6
1,085
1,082
0
N.S.
1,173
1,220
4
4,199
5,326
27
5,372
6,546
22
N.B.
710
701
-1
2,979
3,196
7
3,689
3,897
6
Atlantic
2,530
2,673
6
8,306
9,642
16
10,836
12,315
14
Que.
3,126
3,477
11
25,663
34,305
34
28,789
37,782
31
Ont.
9,576
7,195
-25
46,552
38,916
-16
56,128
46,111
-18
Man.
1,299
1,711
32
3,106
3,506
13
4,405
5,217
18
Sask.
911
1,266
39
2,000
3,042
52
2,911
4,308
48
Alta.
11,295
11,911
5
22,282
28,803
29
33,577
40,714
21
Prairies
13,505
14,888
10
27,388
35,351
29
40,893
50,239
23
B.C.
3,349
2,999
-10
28,902
28,587
-1
32,251
31,586
-2
Canada
32,086
31,232
-3
136,811
146,801
7
168,897
178,033
5
1 Data for 2022 based on 2016 Census Definitions and data for 2023, 2024 and 2025 based on 2021 Census Definitions.
Source: CMHC Starts and Completion Survey, Market Absorption Survey
Housing Start Data in Centres 10,000 Population and Over (Metropolitan Areas)
January – September 2024 – 2025
Abbotsford – Mission
146
127
-13
756
1,685
123
902
1,812
101
Barrie
312
129
-59
446
499
12
758
628
-17
Belleville – Quinte West
163
118
-28
123
350
185
286
468
64
Brantford
168
222
32
39
1,298
##
207
1,520
##
Calgary
5,225
5,231
0
12,189
15,662
28
17,414
20,893
20
Chilliwack
121
99
-18
278
362
30
399
461
16
Drummondville
125
166
33
621
775
25
746
941
26
Edmonton
4,992
5,279
6
8,367
11,205
34
13,359
16,484
23
Fredericton
226
199
-12
280
702
151
506
901
78
Greater/Grand Sudbury
61
71
16
58
127
119
119
198
66
Guelph
43
23
-47
342
118
-65
385
141
-63
Halifax
604
609
1
3,682
4,732
29
4,286
5,341
25
Hamilton
250
232
-7
1,691
1,833
8
1,941
2,065
6
Kamloops
68
62
-9
196
302
54
264
364
38
Kelowna
280
198
-29
3,387
1,934
-43
3,667
2,132
-42
Kingston
171
124
-27
149
737
395
320
861
169
Kitchener – Cambridge – Waterloo
290
273
-6
2,062
3,252
58
2,352
3,525
50
Lethbridge
194
274
41
405
201
-50
599
475
-21
London
415
368
-11
2,587
2,035
-21
3,002
2,403
-20
Moncton
199
222
12
1,983
1,874
-5
2,182
2,096
-4
Montréal
814
952
17
11,675
18,379
57
12,489
19,331
55
Nanaimo
114
65
-43
670
289
-57
784
354
-55
Oshawa
338
303
-10
1,134
482
-57
1,472
785
-47
Ottawa – Gatineau
1,325
1,239
-6
6,919
7,713
11
8,244
8,952
9
Gatineau
276
308
12
2,084
1,476
-29
2,360
1,784
-24
Ottawa
1,049
931
-11
4,835
6,237
29
5,884
7,168
22
Peterborough
102
58
-43
113
17
-85
215
75
-65
Québec
452
529
17
4,794
6,091
27
5,246
6,620
26
Red Deer
67
96
43
247
241
-2
314
337
7
Regina
204
284
39
734
1,121
53
938
1,405
50
Saguenay
152
182
20
215
327
52
367
509
39
St. Catharines – Niagara
517
316
-39
781
1,185
52
1,298
1,501
16
Saint John
166
175
5
438
244
-44
604
419
-31
St. John’s
388
474
22
196
272
39
584
746
28
Saskatoon
647
928
43
1,228
1,833
49
1,875
2,761
47
Sherbrooke
220
197
-10
953
988
4
1,173
1,185
1
Thunder Bay
56
78
39
130
111
-15
186
189
2
Toronto
3,389
2,405
-29
28,559
17,724
-38
31,948
20,129
-37
Trois-Rivières
160
135
-16
1,269
893
-30
1,429
1,028
-28
Vancouver
1,645
1,562
-5
18,858
18,811
0
20,503
20,373
-1
Victoria
216
211
-2
2,850
3,560
25
3,066
3,771
23
Windsor
335
250
-25
1,394
621
-55
1,729
871
-50
Winnipeg
1,071
1,497
40
2,614
3,026
16
3,685
4,523
23
Total
26,431
25,962
-2
125,412
133,611
7
151,843
159,573
5
1 Data for 2022 based on 2016 Census Definitions and data for 2023, 2024 and 2025 based on 2021 Census Definitions.
Source: CMHC Starts and Completion Survey, Market Absorption Survey
Housing Start Data in Centres 10,000 Population and Over (Provinces)
N.-L.
58
80
38
45
35
-22
103
115
12
P.E.I.
36
37
3
0
41
##
36
78
117
N.S.
177
193
9
246
370
50
423
563
33
N.B.
107
112
5
539
312
-42
646
424
-34
Atlantic
378
422
12
830
758
-9
1,208
1,180
-2
Qc
402
443
10
3,554
4,158
17
3,956
4,601
16
Ont.
1,477
868
-41
3,981
6,597
66
5,458
7,465
37
Man.
170
200
18
281
736
162
451
936
108
Sask.
147
182
24
359
552
54
506
734
45
Alta.
1,441
1,405
-2
2,325
3,132
35
3,766
4,537
20
Prairies
1,758
1,787
2
2,965
4,420
49
4,723
6,207
31
B.C.
420
383
-9
3,041
2,539
-17
3,461
2,922
-16
Canada (10,000+)
4,435
3,903
-12
14,371
18,472
29
18,806
22,375
19
Data for 2022 based on 2016 Census Definitions and data for 2023, 2024 and 2025 based on 2021 Census Definitions.
Source: CMHC Starts and Completion Survey, Market Absorption Survey
## not calculable / extreme value
Housing Start Data in Centres 10,000 Population and Over (Metropolitan Areas)
Abbotsford – Mission
26
9
-65
247
226
-9
273
235
-14
Barrie
47
27
-43
115
9
-92
162
36
-78
Belleville – Quinte West
38
13
-66
11
78
##
49
91
86
Brantford
37
12
-68
20
68
240
57
80
40
Calgary
660
635
-4
1,430
1,626
14
2,090
2,261
8
Chilliwack
17
13
-24
4
93
##
21
106
405
Drummondville
15
12
-20
67
130
94
82
142
73
Edmonton
637
547
-14
798
1,236
55
1,435
1,783
24
Fredericton
37
35
-5
26
32
23
63
67
6
Greater / Grand Sudbury
18
6
-67
21
2
-90
39
8
-79
Guelph
7
2
-71
44
40
-9
51
42
-18
Halifax
64
85
33
166
290
75
230
375
63
Hamilton
51
20
-61
415
7
-98
466
27
-94
Kamloops
1
5
400
64
2
-97
65
7
-89
Kelowna
34
23
-32
425
72
-83
459
95
-79
Kingston
25
2
-92
9
3
-67
34
5
-85
Kitchener – Cambridge – Waterloo
22
29
32
119
1,230
##
141
1,259
##
Lethbridge
22
42
91
0
2
##
22
44
100
London
58
48
-17
149
1,054
##
207
1,102
432
Moncton
29
30
3
414
118
-71
443
148
-67
Montréal
108
120
11
1,003
2,490
148
1,111
2,610
135
Nanaimo
8
6
-25
4
11
175
12
17
42
Oshawa
36
43
19
14
56
300
50
99
98
Ottawa – Gatineau
216
115
-47
1,672
421
-75
1,888
536
-72
Gatineau
32
22
-31
346
40
-88
378
62
-84
Ottawa
184
93
-49
1,326
381
-71
1,510
474
-69
Peterborough
3
7
133
18
0
-100
21
7
-67
Québec
49
72
47
547
634
16
596
706
18
Red Deer
14
7
-50
0
9
##
14
16
14
Regina
43
49
14
31
263
##
74
312
322
Saguenay
10
16
60
50
56
12
60
72
20
St. Catharines – Niagara
60
18
-70
10
19
90
70
37
-47
Saint John
26
31
19
75
72
-4
101
103
2
St. John’s
48
76
58
36
34
-6
84
110
31
Saskatoon
95
127
34
317
289
-9
412
416
1
Sherbrooke
31
18
-42
242
222
-8
273
240
-12
Thunder Bay
15
19
27
28
48
71
43
67
56
Toronto
554
361
-35
1,179
3,317
181
1,733
3,678
112
Trois-Rivières
43
18
-58
620
92
-85
663
110
-83
Vancouver
209
215
3
1,774
1,753
-1
1,983
1,968
-1
Victoria
29
21
-28
331
203
-39
360
224
-38
Windsor
51
24
-53
268
106
-60
319
130
-59
Winnipeg
139
164
18
139
650
368
278
814
193
Total
3,632
3,122
-14
12,902
17,063
32
16,534
20,185
22
Data for 2022 based on 2016 Census Definitions and data for 2023, 2024 and 2025 based on 2021 Census Definitions.
Source: CMHC Starts and Completion Survey, Market Absorption Survey
## not calculable / extreme value
Housing Start Data — Seasonally Adjusted at Annual Rates (SAAR)
(Provinces — 10,000+)
N.L.
474
740
56
367
353
-4
841
1,093
30
P.E.I.
350
467
33
1,968
492
-75
2,318
959
-59
N.S.
1,703
1,543
-9
5,187
4,255
-18
6,890
5,798
-16
N.B.
945
1,069
13
5,743
3,760
-35
6,688
4,829
-28
Qc
4,874
4,890
0
40,970
44,355
8
45,844
49,245
7
Ont.
9,763
9,210
-6
44,422
76,591
72
54,185
85,801
58
Man.
2,059
2,227
8
6,972
8,832
27
9,031
11,059
22
Sask.
1,732
1,664
-4
2,724
6,624
143
4,456
8,288
86
Alta.
13,999
15,261
9
31,599
37,850
20
45,598
53,111
16
B.C.
4,182
3,965
-5
39,375
30,197
-23
43,557
34,162
-22
Canada (10,000+)
40,081
41,036
2
179,327
213,309
19
219,408
254,345
16
Canada (All Areas)
54,838
55,408
1
189,703
223,825
18
244,543
279,234
14
Data for 2022 based on 2016 Census Definitions and data for 2023, 2024 and 2025 based on 2021 Census Definitions.
Source: CMHC Starts and Completion Survey, Market Absorption Survey
## not calculable / extreme value
Housing Start Data — Seasonally Adjusted at Annual Rates (SAAR) (Metropolitan Areas)
Abbotsford – Mission
172
15
-91
804
2,712
237
976
2,727
179
Barrie
134
257
92
216
108
-50
350
365
4
Belleville – Quinte West
154
147
-5
12
936
##
166
1,083
##
Brantford
343
261
-24
2,112
816
-61
2,455
1,077
-56
Calgary
5,774
6,672
16
18,768
19,512
4
24,542
26,184
7
Chilliwack
150
82
-45
150
1,116
##
186
1,198
##
Drummondville
150
163
9
924
1,560
69
1,074
1,723
60
Edmonton
6,487
6,308
-3
12,156
14,832
22
18,643
21,140
13
Fredericton
236
308
31
612
384
-37
848
692
-18
Greater / Grand Sudbury
110
132
20
168
24
-86
278
156
-44
Guelph
41
23
-44
12
480
##
53
503
##
Halifax
944
852
-10
4,452
3,480
-22
5,396
4,332
-20
Hamilton
533
154
-71
2,016
84
-96
2,549
238
-91
Kamloops
10
63
##
0
24
##
10
87
##
Kelowna
124
317
156
156
864
454
280
1,181
322
Kingston
183
16
-91
48
36
-25
231
52
-77
Kitchener – Cambridge – Waterloo
388
437
13
7,356
14,760
101
7,744
15,197
96
Lethbridge
237
467
97
12
24
100
249
491
97
London
422
458
9
1,032
12,648
##
1,454
13,106
##
Moncton
355
287
-19
3,924
1,416
-64
4,279
1,703
-60
Montréal
1,275
1,245
-2
19,098
29,694
55
20,373
30,939
52
Nanaimo
97
81
-16
1,308
132
-90
1,405
213
-85
Oshawa
504
395
-22
2,280
672
-71
2,784
1,067
-62
Ottawa – Gatineau
1,743
1,161
-33
4,248
5,052
19
5,991
6,213
4
Gatineau
548
239
-56
1,212
480
-60
1,760
719
-59
Ottawa
1,195
922
-23
3,036
4,572
51
4,231
5,494
30
Peterborough
85
129
52
0
0
–
85
129
52
Québec
609
776
27
4,320
7,608
76
4,929
8,384
70
Red Deer
117
62
-47
156
108
-31
273
170
-38
Regina
362
380
5
564
3,156
460
926
3,536
282
Saguenay
216
249
15
240
672
180
456
921
102
St. Catharines – Niagara
451
197
-56
2,328
228
-90
2,779
425
-85
Saint John
283
295
4
144
864
##
427
1,159
171
St. John’s
487
773
59
396
408
3
883
1,181
34
Saskatoon
1,335
1,274
-5
2,160
3,468
61
3,495
4,742
36
Sherbrooke
210
177
-16
408
2,664
##
618
2,841
360
Thunder Bay
114
129
13
0
576
##
114
705
##
Toronto
3,232
3,578
11
22,032
39,804
81
25,264
43,382
72
Trois-Rivières
150
183
22
1,416
1,104
-22
1,566
1,287
-18
Vancouver
2,165
2,231
3
27,804
21,036
-24
29,969
23,267
-22
Victoria
380
238
-37
7,140
2,436
-66
7,520
2,674
-64
Windsor
297
234
-21
552
1,272
130
849
1,506
77
Winnipeg
1,637
1,872
14
6,204
7,800
26
7,841
9,672
23
Data for 2022 based on 2016 Census Definitions and data for 2023, 2024 and 2025 based on 2021 Census Definitions.
Source: CMHC Starts and Completion Survey, Market Absorption Survey
## not calculable / extreme value
Thank you for your feedback!
How Can We Help?
![]()
What could we improve?
Please select all that apply.
Note: You will not receive a reply. Don’t include personal information.
How Can We Help?
![]()
Report a Bug
Please describe the problem.
Thank you. Your feedback has been submitted.
Date Published: October 16, 2025