
BNN Bloomberg is Canada’s definitive source for business news dedicated exclusively to helping Canadians invest and build their businesses.
Jamie Dimon, CEO of the largest bank in the U.S. and one of the largest in the world used the term cockroaches when referring to recent frauds in credit markets last week.
I’m sure he choose those words carefully. The private market players quickly spoke up and downplayed the systemic nature of his comments. We have heard from several key regional banks and they do not seem to share the same concern, but few shared that same concerns in mid 2008 on the eve of the great financial crisis (GFC).
One of the leading indicators for credit risk concerns show up in credit default swaps (CDS). These are sophisticated financial derivatives that act like insurance on corporate and government debt. If interest is not paid, the insurance kicks in.
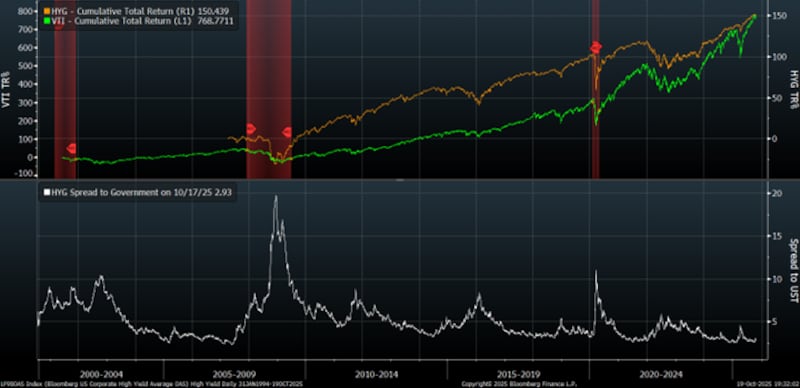
These instruments were a huge part of how some profited from the GFC. The first chart shows the total percentage return of the US equity (VTI green) and high yield debt (HYG orange) ETFs. The lower line is the spread of the HYG yield over the equivalent maturity of government (read “safe”) debt.
The correlation of credit spreads to equity market returns is very high. High yield debt is senior to equity in the capital stack, but will be as volatile as equities in a risk-off market. You can see that where spreads are today with equities at all-time highs, most have few concerns. Historically, we see insurance buying (VIX, CDS) in key sectors from investors that have more information than others.
 Graph1
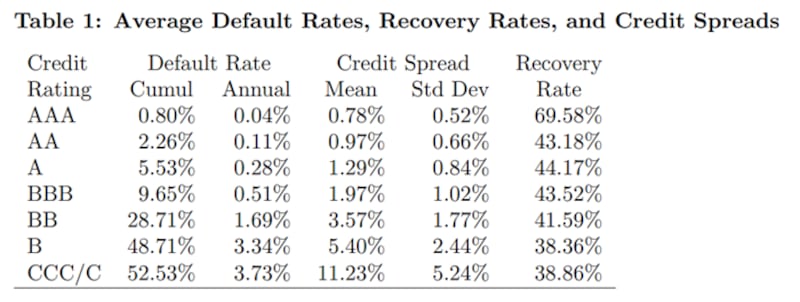
When one takes credit risk, getting your capital back is paramount. The table below created in 2023 from Moody’s data, shows the history of default and recovery rates.
Adding up the BB/B/CCC-C tranches, we see that annual default rates are about nine per cent with a recover of about 40 per cent. That means high yield credit is at risk of about five per cent capital loss annually on average. When the economy is strong, those numbers drop to one per cent and when it’s bad, can be more than 10 per cent.
 Graph 2
We just saw a few frauds pop up in the sub-prime auto loan sector with Tricolor and First Brands that inspired Dimon’s comments. While the industry has expressed confidence it’s not systemic and widespread, history reminds us that the top of a credit cycle always feels good before it doesn’t.
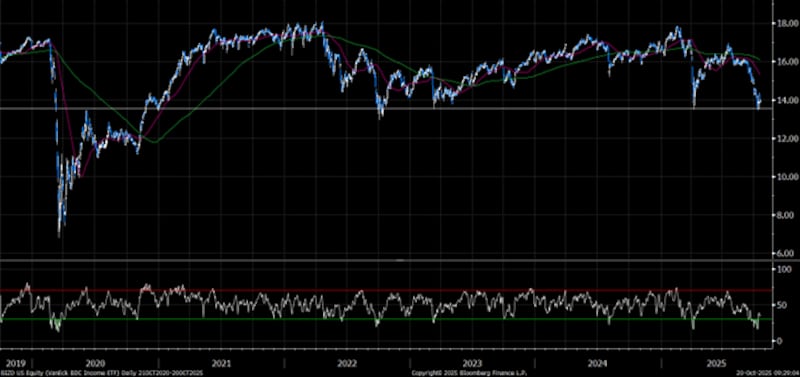
Keep an eye on the price action of HYG, VIXY, and specifically BIZD that all trade in the US and are highly correlated with credit risk. There are many other indicators that pros will look at, but these are visible for the DIY investors that may not have sophisticated views on capital markets.
 Graph 3
Trying to navigate markets is difficult for the industry pros. While I do not recommend this for the average investor, these are some of the indicators the pros are looking at to try and figure out if there are any other cockroaches.
Follow Larry:
YouTube: LarryBermanOfficial
Twitter: @LarryBermanETF
LinkedIn: LarryBerman