
Model scenarios
To explore the impact of global change (fishing and climate change) on carbon export and sequestration by marine macrofauna of commercial interest, we force BOATS with two contrasting scenarios of climate change: the respect of the Paris Agreement (SSP 1–2.6) and the business-as-usual scenarios (SSP 5–8.5). Two variables were used to force the model of biomass prediction (BOATS, see the next section), the NPP and the SST. In BOATS, following macroecological theory, NPP drives the accumulation of biomass in marine macrofauna based on factors such as trophic efficiency, predator-prey mass ratio, and phytoplankton size, while temperature affects physiological rates, including growth, mortality, and reproduction24,26. These two variables were obtained from two ESMs from the Couple Model Intercomparison Project 6 (CMIP6), namely the Geophysical Fluid Dynamics Laboratory (GFDL) and the Institut Pierre-Simon Laplace (IPSL). They cover the historical period 1950–2014 and future projections from 2015 to 2100. To explore the cumulative impact of climate change and fisheries, we also ran climate change scenarios together with contrasting scenarios of fishing effort: one without exploitation and another one where exploitation evolves dynamically to match the historical harvest dynamic until 2014, and where fishing effort is kept constant in the future until 2100. This protocol for simulations is the protocol of the Fisheries and MEM Intercomparison Project (FishMIP) for the ISIMIP3b29. These simulations were contributed, along with other MEMs, to the intercomparison of global fish biomass projections22. To compare BOATS biomass outputs in the fishing scenario, we also used global reconstruction data based on stock assessments from Worm and Branch31.
Alongside BOATS, to acknowledge structural and parameter differences between MEMs in simulating the impact of climate change on marine biomass22, we also used simulation outputs of a set of five other MEMs (Apecosm, DBPM, EcoOcean, FEISTY, and ZooMSS), referred to as “FishMIP simulations” in the main text. The simulations and model characteristics are described in the global fish biomass projection intercomparison by Tittensor et al.22 (see Supplementary Table 4 for model references and acknowledgments of the contributing modeling groups).
Description of the model BOATS
We used the BOATS model (Carozza et al.26,27 to estimate the change in biomass of marine macrofauna from 10 g to 100 kg targeted by fisheries (hereafter called macrofauna for simplicity). The main ecological model parameters and variables are listed in the Supplementary Tables 1–3. Macrofauna biomass is divided into three species groups k, the small, the medium, and the large species groups, and each group is itself divided into size classes. For each group, the life history of an individual starts in the first size class (10 g) and can grow until it reaches its asymptotic mass, so 0.3 kg, 8.5 kg, and 100 kg for the small, medium, and large species, respectively. The main model equation that estimates the variation through time (t) of macrofauna biomass per mass class m in each group k, fk(m,t) corresponds to:
$$\frac{\partial }{\partial t} \, {f}_{k}\left(m,t\right)= \frac{-\partial }{\partial m}{\gamma }_{S,k}\left(m,t\right)\bullet {f}_{k}\left(m,t\right)+\frac{{\gamma }_{S,k}\left(m,t\right)\bullet {f}_{k}\left(m,t\right)}{m} \\ -[{\Lambda }_{k}\left(m\right)+{\Lambda }_{F}\left(m,t\right)]\bullet {f}_{k}\left(m,t\right)$$
(1)
The first two terms on the right-hand side represent, respectively, the somatic growth of an individual across size classes, at a rate γS, and the accumulation of macrofauna biomass within the same size class. The third and last term of the equation represents losses from natural mortality that occur at a rate Λk and from fishing mortality that occurs at a rate ΛF. Both rates vary with time, with the average temperature in the upper ocean (top 75 m) and/or the vertically integrated NPP. The somatic growth rate (γS,k) corresponds to the net energy input needed for growth (somatic + reproduction) (ξI,k) minus the fraction of energy allocated to reproduction (γR,k):
$${\gamma }_{S,k}={\xi }_{I,k}-{\gamma }_{R,k}$$
(2)
Here, ξI,k is the minimum value between the theoretical maximum temperature-dependent growth rate in ad libitum food conditions derived from the assumption of a Von Bertalanffy growth (ξVB,k), and a growth rate limited by NPP (ξP,k), so based on the amount of energy available from primary production. This means that the net growth rate cannot exceed the biologically determined maximum rate, even under high NPP:
$${\xi }_{I,k}=\min ({{\xi }_{{VB},k},\xi }_{P,k})$$
(3)
with
$${\xi }_{{VB},k}=A\bullet {m}^{b}-{k}_{a}\bullet m$$
(4)
where \(A={A}_{0}\bullet {a}_{A}\left(T\right)\), A0 being the allometric growth constant69, modulated by aA(T) the van’t Hoff-Arrhenius exponential temperature dependence of growth, \({a}_{A}\left(T\right)=\exp \left(\frac{{\omega }_{a,A}}{{k}_{B}}\bullet \left(\frac{1}{{T}_{{ref}}}-\frac{1}{T}\right)\right)\), with ωa,A the growth activation energy of metabolism, kB the Boltzmann constant while T and Tref are the local temperature and a reference temperature, respectively. The term \({k}_{a}\bullet m\) accounts for the energy dissipation through activity, it is also proportional to aA(T) (see Carozza et al.26). When primary production is limiting:
$${\xi }_{P,k}=\frac{{\phi }_{C}\bullet \pi \bullet m}{{f}_{k}}$$
(5)
$$\pi=\frac{{\Pi }_{\psi }}{{m}_{\psi }}\bullet {\left(\frac{m}{{m}_{\psi }}\right)}^{\tau -1}$$
(6)
where Πψ is the vertically integrated NPP, τ is the trophic scaling exponent (i.e., how efficiently energy is transferred thought the trophic web), and mψ is the representative size of phytoplankton at which NPP takes place, estimated as the geometric mean of phytoplanktonic groups mass, \({m}_{\psi }={m}_{L}^{{{\Phi }}_{L}(t)}+{m}_{S}^{{1-{\Phi }}_{L}(t)}\), ΦL being the proportion of large cells and m the mass of large and small cells (as in Dunne, et al.70).
Finally, the energy allocated to reproduction (γR,k) corresponds to the fraction (Φk) of net energy input (ξI,k) allocated to reproduction:
$${\gamma }_{R,k}={\phi }_{k}\bullet {\xi }_{I,k}$$
(7)
where Φk is the mass-dependent fraction of input energy that is allocated to reproduction. Rewriting Eq. (2) provides:
$${\gamma }_{S,k}={(1-{\phi }_{k})\bullet \xi }_{I,k}$$
(8)
and assuming that \({\gamma }_{R,k}\) is proportional to mass and scales with a size-dependent rate sk(m), so that \({\gamma }_{R,k}={k}_{r}^{\max }\bullet {s}_{k}\bullet m\), we can estimate ϕk(m) as:
$${\phi }_{k}=\frac{{k}_{r}^{\max }\bullet {s}_{k}\bullet m}{{\xi }_{I,k}}{;} \, {\mbox{with}} \, {\xi }_{I,k}={\xi }_{{VB},k}$$
(9)
Where krmax, the normalizing constant, is estimated by solving the equation \({\phi }_{k}({m}_{\infty })=1\), so all energy input goes to reproduction when m∞ is reached:
$${k}_{r}^{\max }=\frac{{\xi }_{{VB},k}({m}_{{\infty},k})}{{s}_{k}({m}_{{\infty},k})\bullet {m}_{{\infty},k}}$$
(10)
Thus, Eq. (8) can be written as:
$${\gamma }_{S,k}=\left(1-\frac{{\xi }_{{VB},k}\left({m}_{{\infty},k}\right)\bullet {s}_{k}\bullet m}{{s}_{k}\left({m}_{{\infty},k}\right)\bullet {m}_{{\infty},k}\bullet {\xi }_{{VB},k}}\right)\bullet \min ({{\xi }_{{VB},k},\xi }_{P,k})$$
(11)
For the mortality term in Eq. (1), ΛF corresponds to the fishing mortality rate. It equals:
$${\Lambda }_{F,k}\left(m,t\right)={q}_{k}\left(t\right)\bullet {\sigma }_{k}\left(m\right)\bullet {E}_{k}\left(t\right)$$
(12)
It represents the catch of macrofauna group k at the size m, and is a function of the catchability q, a measure of the technological efficiency of fishing gear to capture macrofauna biomass, the selectivity function σ(m), which varies between 0 and 1 and expresses the intrinsic ability of a given gear to target a given size class m, and the fishing effort E.
In the simulations without fishing, there is no fishing effort E and no fishing mortality ΛF,k. With fishing, over the historical period (1950–2014), fishing effort evolves dynamically under an open-access dynamic proportional to the local net profit for the difference between fishing revenues and costs27. Effort is held constant at the 2015 level for projections to the year 2100. By design, BOATS is tuned to reproduce key aspects of global fisheries catch, including total catch, size structure of the catch, catch-to-biomass ratio, and maximum catch potential of large marine ecosystems (LME), when forced with observed satellite-based NPP and temperature29. Here, we use the same model configuration and parameters, but force the model with historical ESM simulations and future projections. To account for parameter uncertainty, an ensemble of 10,000 simulations at the LME level was conducted during model tuning, from which five representative parameter sets were selected (see Supplementary Table 3)27,28. Here, each simulation is replicated five times using the five parameter sets, resulting in a total of 20 simulations: 5 parameter sets x 2 ESMs (GFLD and IPSL) x with or without fishing. The model equations are solved numerically with a monthly time-step on a global 1° × 1° grid, for 3 species groups (small, medium, and large asymptotic size), with a discretisation of the biomass size spectrum into 50 size classes. We report the mean and standard deviation of the five replicate parameter sets for each combination of ESM and fishing scenario.
Modeling carcass production
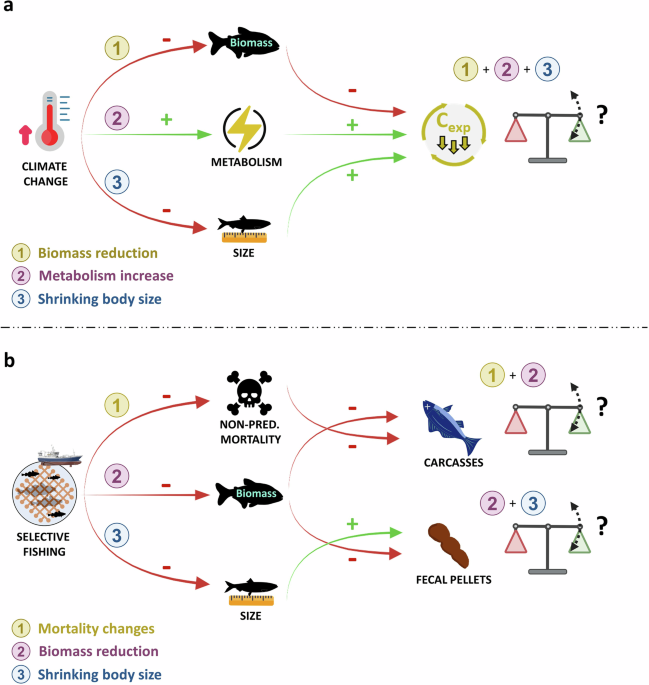
In BOATS, the natural mortality rate (Λk) represents all forms of natural mortality, including predation and non-predation mortality:
$${\Lambda }_{{{{\rm{k}}}}}={\Lambda }_{{pred}}+{\Lambda }_{{non}-{pred}}$$
(13)
In BOATS, Λk depends on temperature, mass, and asymptotic mass and is derived from Gislason et al.71, where all mortality causes are nested in a general formula, used for each species group k:
$${\Lambda }_{{{{\rm{k}}}}}=\lambda \left(T\right)\bullet {m}^{-h}\bullet {m}_{{\infty},k}^{h+b-1}$$
(14)
where m, m∞, h, and b are respectively the mass, the asymptotic mass, the allometric mortality scaling exponent, and the allometric growth scaling exponent. λ(T) is the temperature-dependent term estimated as:
$$\lambda \left(T\right)=\frac{{e}^{{\zeta }_{1}}\bullet {A}_{0}\bullet {a}_{\lambda }(T)}{3}$$
(15)
with ζ1 a mortality constant estimated from Gislason et al.71, A0 is the allometric growth constant from Andersen and Beyer69 and \({a}_{{\lambda }}\left(T\right)=\exp \left(\frac{{\omega }_{a,{\lambda }}}{{k}_{B}}\bullet \left(\frac{1}{{T}_{{ref}}}-\frac{1}{T}\right)\right)\) the van’t Hoff-Arrhenius exponential function for mortality.
The dead biomass of a group k (BDead,k) therefore corresponds to the portion of the biomass in that group (fk) that dies naturally:
$${B}_{{Dead},k}={\Lambda }_{{{{\rm{k}}}}}\bullet {f}_{k}$$
(16)
To estimate the proportion of that biomass that sinks to the deep-sea floor (i.e., the biomass not dead from predation), we estimated the contribution of Λnon-pred,k to the total mortality Λk, noted Δcontrib,k, as:
$${\Delta }_{{contrib},k}=\frac{{\Lambda }_{{non}-{pred},k}}{{\Lambda }_{k}}$$
(17)
We used the formula in Rogers, et al.72 to estimate Λnon-pred,k, while adding a temperature dependency term aλ(T):
$${\Lambda }_{{non}-{pred},k}=\left({\mu }_{R}*{m}^{{-\beta }_{R}}+{\mu }_{S} * {\left(\frac{m}{{m}_{S}}\right)}^{{\beta }_{S}}\right)\bullet {a}_{\lambda }\left(T\right)$$
(18)
Here, the first term (\({\mu }_{R}*{m}^{-{\beta }_{R}}\)) corresponds to the extrinsic mortality, so mortality mainly from starvation, which decreases exponentially with an increase in body mass (m). The second term \(\left({\mu }_{S}*{\left(\frac{m}{{m}_{S}}\right)}^{{\beta }_{S}}\right)\) mimics the mortality from senescence, so that larger individuals have a higher probability of dying once the mass at senescence (mS) is reached. The addition of both terms leads to the well-known U-shaped mortality function.
Although this function is derived from a model for coral-reef fish, U-shaped age-dependent mortality curves are well-documented for several species across the tree of life, including fish73. U-shaped age-dependent mortality functions are also used to model offshore species population dynamics such as tuna and tuna-like species (see Lehodey et al.74 with an application to carcass production in Mouillot et al.23). Although refining the parametrization of this function with species-specific data would further improve the accuracy of our estimate, the current knowledge, as well as the structure of the BOATS model, does not allow us to use a species- or group-specific (inshore vs offshore species) formula. We believe our approach, using a general U-shaped function, provides an ecologically grounded first-order estimate of carcass production across diverse fish groups.
The total dead biomass that sinks to the deep-sea floor (Bsink,k) therefore equals to:
$${B}_{{sink},k}={\Delta }_{{contrib},k} * {B}_{{Dead},k}$$
(19)
For the largest macrofauna only (i.e., size classes 50 of group 3) (Supplementary Figs. 4–6), it happens that the contribution of the non-predation mortality to the total mortality exceeds 1. In that case, we estimated that these organisms cannot die from predation but only from senescence, by limiting the value to 1.
Modeling fecal pellet production
We estimated carbon loss by macrofauna (respiration + fecal pellets) at the individual level (Ci,k) by first computing total energy input or gross ingestion (ξTOT), i.e., the energy needed for reproduction, growth, plus loss19. ξTOT is estimated using the net biomass production ξI (see Eq. (3)), divided by the assimilation efficiency (α):
$${\xi }_{{TOT}}=\frac{{\xi }_{{I}}}{\alpha }$$
(20)
As carbon loss corresponds to the difference between total ingestion (ξTOT) and the part used for growth and reproduction (ξI,k), Ci,k equals to:
$${C}_{i,k}={\xi }_{{TOT}}-{\xi }_{{I,k}}=\frac{{\xi }_{{I,k}}}{\alpha }-{\xi }_{{I,k}}$$
(21)
Factorizing Eq. (21) leads to:
$${C}_{i,k}=\frac{1-\alpha }{\alpha }\bullet {\xi }_{{I,k}}$$
(22)
To scale carbon loss (respiration + fecal pellets) to the entire population (Ctotal), we integrated the individual carbon loss Ci,k over the entire size spectrum for each species group k, and summed it:
$${C}_{{total}}={\sum }_{k}{C}_{k}$$
(23)
Where Ck, so the entire carbon loss from group k equals:
$${C}_{k}=\int _{{m}_{0}}^{{m}_{{\infty},k}}{C}_{i,k}\left(m\right)\bullet {n}_{k}\left(m\right){dm}$$
(24)
Where nk(m) corresponds to the abundance of macrofauna in a given group k and size class, \({n}_{k}\left(m\right)=\frac{{f}_{k}(m,t)}{m}\).
As in Bianchi et al.19, we assume that about ϕE = 20% of the biomass cycling rate is returned to the environment as fecal pellets, the remaining 80% being respired.
Modeling carbon export from fecal pellets and carcasses
We model the export of fecal pellets and carcass at depth z (FFPz) in each cell using an exponential function75 with a temperature-dependent microbial remineralization rate (kremin) and a sinking speed of macrofauna fecal pellets or carcass (Wsink). Once reaching the bottom of the ocean, we considered that the carbon is entirely remineralized in the last layer and is not buried in the sediment.
$${FF}{P}_{z+1}={FF}{P}_{{{{\rm{z}}}}}\times {e}^{\left(-\frac{{k}_{{remin}}}{{W}_{{sink}}}\times \left((z+1)-{{{\rm{z}}}}\right)\right)}$$
(25)
To take into account the impact of climate change on the microbial activity (remineralization), we used a temperature coefficient (Q10) of 2, so the microbial activity increases by a factor of 2 for each 10 °C increase, so that kremin equals:
$${k}_{{remin}}={k}_{1}\times {Q}_{10}^{\frac{{T}_{2}-{T}_{1}}{10}}$$
(26)
where k1 is the initial remineralization coefficient at a reference temperature T1, and T2 is the temperature in each cell at a given depth. The parameter Wsink is set to 787 m d−1 and 1150 m d−1 for fecal pellets and carcass, respectively12,76. We assumed that all fecal pellets were produced above the euphotic zone, at a depth z of zeu = 75 m. As the temperature of the ocean varies with depth, we divided the ocean into coarse layers, 0–200 m, 200–500 m, 500–1000 m, 1000–2000 m, and 2000 m to the bottom, and used the temperature fields from the CMIP6 GFDL and IPSL model forcings. Since there is a strong drift in potential temperature in the two last layers, we identified and removed the trend (linear detrending) using preindustrial control simulations. Finally, we ran the export model in a three dimensional ocean of dimensions 180 × 360 × 24, the last dimension corresponding to the 24 depth layers used later in the OCIM (next section).
Modeling carbon sequestration
We estimate the amount of carbon stored in the ocean interior by marine macrofauna using the OCIM30. The spatial resolution of the OCIM is 2° horizontally with 24 vertical depth layers. We use it here to track DIC injected (Cinj) by carbon remineralization in the interior ocean. Cinj was estimated using the result of Eq. (25) for each depth layer as:
$${C}_{{in}{j}_{z}}={FF}{P}_{z}-{FF}{P}_{z+1}$$
(27)
The tracer equation used to estimate the concentration and distribution of the injected DIC (C) corresponds to:
$$\frac{{dC}}{{dt}}=T * C+{C}_{{inj}}$$
(28)
Here, T corresponds to the transport matrix operator that accounts for ocean currents (i.e., advection-diffusion matrix), C is the concentration of DIC, and Cinj is the source of DIC from the remineralization of macrofauna-derived organic carbon converted in µmol/kg/yr. For simplicity, we assume a boundary condition of C = 0 at the sea-surface, which assumes instantaneous air–sea equilibration62. Given that a new steady-state resulting from changes in carbon export will be reached in several centuries (~1000 years), we ran both transient and steady-state simulations. Transient simulations illustrate the real-time impact of changing exports on carbon sequestration, while steady-state simulations assume that transient changes will be sustained indefinitely over time, illustrating the potential maximum long-term effects of climate change and fisheries on carbon sequestration by macrofauna. An initial pre-industrial baseline was found by solving Eq. (27) at steady-state and using C_inj for 1950. Then, a transient simulation with yearly changing export was performed using the backward Euler method, starting at 1950 and ending in 2100. Finally, we found another steady-state assuming that the C_inj value for 2100 extends indefinitely into the future. We obtained the total carbon sequestered by macrofauna in the ocean interior by globally integrating C to obtain a value of carbon sequestration (Cseq) in GtC. The time of sequestration (in years) was obtained by dividing Cseq by the globally integrated carbon export (in GtC yr−1). Finally, we calculated the carbon sequestration origin, or regions where carbon sequestered by macrofauna in the ocean interior comes from, as the product of carbon injected at each depth and the mean sequestration time at that depth, also known as the mean first-passage time (e.g., Siegel et al.77, Primeau78). The OCIM was run on MATLAB.
Estimation of KMCAs
KMCAs are defined using an upper quartile method as areas where both the commercial macrofauna biomass and their contribution to carbon sequestration are high (i.e., value of biomass and contribution to carbon sequestration in the upper quartile). To quantify the impact of fishing and climate change on the spatial distribution of the KBCA, we estimated the spatial distribution of the KBCA for two decades: in the 1950s in a scenario without fishing, and the 2010’ in a scenario with historical fishing. All analyses were done in the R statistical computing environment (version 4.1.0)79. All outputs are available at Mariani et al.80.
Reporting summary
Further information on research design is available in the Nature Portfolio Reporting Summary linked to this article.