
Study design and participants
We used data from the UK Biobank, a prospective cohort of over 500,000 participants aged 40–69 years in England, Scotland, and Wales [13]. Baseline assessments of 500,000 participants were undertaken in 22 centers between 2006 and 2010, followed by a first repeat assessment of 20,000 participants between 2012 and 2013. Between 2013 and 2015, 236,519 participants were invited to wear an accelerometer under free-living conditions, of whom 106,053 agreed to wear the monitor and 103,579 returned data (Supplemental Fig. 1) [14]. Hospital admission records and death registry data were linked to the UK Biobank to provide information on disease diagnosis and death. This study was approved by the UK’s National Health Service National Research Ethics Service (Ethics Committee reference number: 11/NW/0382).
We included participants who had a COPD diagnosis before wearing the accelerometer and who had valid accelerometer data [14] (n = 1,628), and excluded those with missing values on covariates (n = 77). A total of 1,551 participants were included in the final analysis (Supplemental Fig. 2).
Measures
Raw accelerometer-measured physical activity was collected using a wrist-worn tri-axial accelerometer (Axivity AX3, designed by Open Lab, Newcastle, UK). Participants were instructed to wear it for seven continuous days (during awake and sleep time) on their dominant wrist and carry on with their normal activities. Time spent in MVPA, LPA and sedentary behaviors were derived from raw accelerometer data using a previously published machine learning algorithm developed and validated for use with the UK Biobank [15]. Briefly, this algorithm was developed from an accelerometer validation study of 152 free-living adults (aged 18–91 years) who wore the AX3 accelerometer and a wearable camera and kept a time use diary [15]. Using camera images and time-use diaries, researcher annotated accelerometer data based on the Compendium of Physical Activities, labeling specific activities with their metabolic equivalent of task (METs) [16]. Accelerometer data were then defined as sleep, sedentary behavior, LPA and MVPA. Using the labelled data from this accelerometer validation study, machine-learning models were trained to classify behaviors in the UK Biobank accelerometer data. Performance of this algorithm has been supported with a mean accuracy of 88% (95% CI, 87% to 89%) and Cohen’s kappa of 0.80 (95% CI, 0.79 to 0.82) [15]. This behavior classification method has been used in other UK Biobank studies [17,18,19].
The COPD diagnosis and date of diagnosis were identified through the UK Biobank algorithms, via hospital admission records and self-reported medical conditions (see code list in Supplemental Table 1). Date of death was obtained through the linkage to death registries. Participants were followed up until the date of death, or the date of censoring (30 November 2022), whichever came first.
Potential covariates were collected at baseline and first repeat assessment. Socio-demographic characteristics included age at accelerometer measurement (continuous in years), sex (male, female), race and ethnicity (white, non-white), educational attainment (college/university, A level/national vocational qualification [NVQ] or equivalent, and O level/certificate of secondary education [CSE]/none), and Townsend Deprivation Index (a greater TDI indicating a lower overall socioeconomic status). Additional confounders included non-physical activity lifestyle factors: smoking status (never, former, current); alcohol frequency (never/occasionally, 1–3 times/week, ≥ 3 times/week), and healthy diet adherence (yes, no; Supplemental Table 2) and body mass index (BMI, underweight, normal, overweight, or obese). Self-reported chronic conditions included coronary heart disease, stroke, hypertension, diabetes, asthma, and cancer. Years between initial COPD diagnosis and accelerometer measurement were also collected as a covariate.
Statistical analysis
Descriptive statistics were presented as percentages for categorical variables, means (standard deviation, SD) for normally distributed variables, and medians (interquartile range, IQR) for non-normally distributed variables. We compared the characteristics of participants between those deceased and not deceased using χ2 test for categorical variables and Mann-Whitney U test or t test for continuous variables. We conducted multivariable Cox proportional hazards models to estimate the hazard ratio (HRs) and 95% CI for all-cause mortality according to physical activity exposures (MVPA, LPA, ST). Models were adjusted for age, sex, race and ethnicity, educational attainment, Townsend Deprivation Index, smoking status, alcohol frequency, healthy diet adherence, body mass index, pre-existing chronic diseases (coronary heart disease, stroke, hypertension, diabetes, asthma, and cancer) and years between initial COPD diagnosis and accelerometer measurement. We further adjusted for either two of MPVA, LPA, and ST (two-factor model) and all three activity factors (partition model) (See Supplemental Methods). The proportional hazards assumption was checked using Schoenfeld residuals and no violation was found (P >.05 for all models).
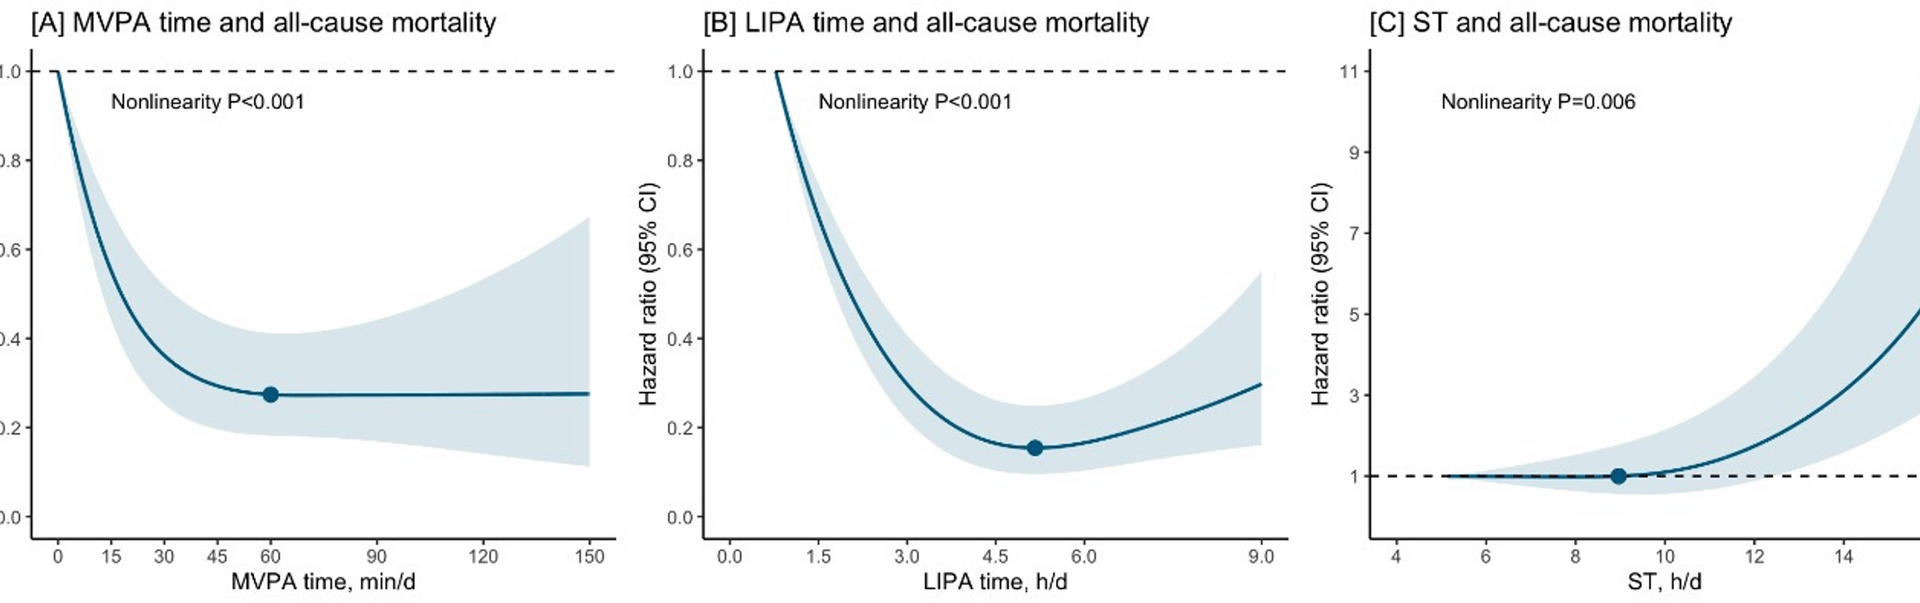
We used restricted cubic splines to assess the dose response associations of MVPA, LPA, ST and all-cause mortality, allowing for potential non-linearity. Knots were placed at the 10th, 50th, and 90th percentile. The reference value was set at the lowest exposure level. Non-linearity was assessed with Wald tests. Based on the shape of dose-response associations, we estimated the threshold amount of ST (i.e., the exposure level above which a mortality risk increase was observed) and the optimal amount of MVPA or LPA (i.e., the exposure value at which the maximum significant risk reduction was observed). Subgroup analyses were conducted by sex and age at physical activity measurement (45–64 years, 65 years or older).
The sleep time, ST, LPA and MVPA are collectively known as the 24-hour movement behaviors. The isotemporal substitution models (ISM) is an analytic approach to evaluate the hypothetical effects of reallocating time spent on one activity to another across different movement behaviors [20]. We used isotemporal substitution models (ISM) to estimate the theoretical effect of replacing 15 min/day or 30 min/day of ST with an equal time spent in MVPA or LPA, adjusting for potential confounders.
We conducted sensitivity analyses to confirm the robustness of our findings. To minimize the possibility of reverse causality, we did a landmark analysis excluding deaths occurring within the two years after accelerometer measurement (n = 1,503). Due to the large volume of missing spirometry data, we did not adjust for baseline lung function in the main analysis. To further investigate the confounding by baseline lung function, in another sensitivity analysis, we repeated the main analyses with further adjustment of FEV1/FVC ratio (n = 1,047). We also conducted sensitivity analyses by excluding COPD patients with concomitant asthma (n = 929).
Statistical analysis was performed using Stata/SE 17.0 (StataCorp) and R Software 4.2.3 (R Foundation for Statistical Computing); a two-sided P value < 0.05 was considered as statistically significant. The present analysis was performed from May 31 to October 15, 2024.